
Remember me
We investigated the antinociceptive effects of flickering light in two chronic pain models: the complete Freund’s adjuvant (CFA) model of inflammatory pain and the spared nerve injury (SNI) model of neuropathic pain (Fig. 1a, e). Unilateral intraplantar injection of CFA induces persistent inflammation and mechanical hyperalgesia.36 The SNI model, which mimics human neuropathic pain, reliably produces long-lasting allodynia and hyperalgesia.37
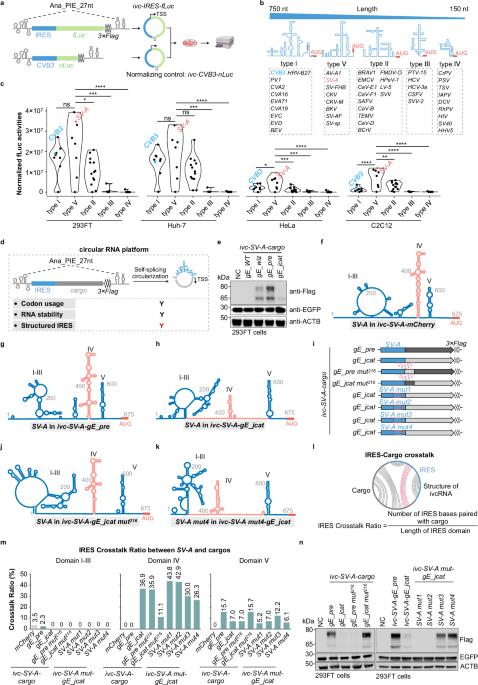
Fig. 1: 40 Hz light flickering alleviated mechanical hyperalgesia in chronic pain models.
a Experimental design for light stimulation of CFA mice at different intensities and frequencies. PWT, paw withdrawal threshold. b PWT in CFA-model mice with or without 2-h daily light stimulation. Left: time course of PWT during light stimulation. Both 40 Hz and 80 Hz flickering light at 2000 lux significantly reduced mechanical hyperalgesia, as shown by increased PWT at CFA day 7 compared with the baseline (CFA day 2). n = 11 mice in each group. Right: between-group comparison of PWT at CFA day 7. CFA mice exposed to 40 Hz light at 2000 lux exhibited significant analgesia than in untreated controls. n = 11 mice in each group. c Paw withdrawal frequencies to von Frey filaments were significantly lower in CFA mice treated with 40 Hz, 2000 lux light compared with untreated controls. n = 13 mice in each group. d The analgesic effects of 40 Hz light at 2000 lux persisted for more than 6 h after cessation of stimulation in CFA mice. n = 16 mice in each group. e Experimental design for light stimulation in SNI mice at different intensities and frequencies. f PWTs in SNI mice with or without 2-h daily light stimulation. Left: time course of PWT. 40 Hz light flickering at 2000 lux significantly attenuated mechanical hyperalgesia, with the PWT at SNI day 35 elevated relative to the baseline (SNI day 14). n = 11 mice in each group. Right: between-group comparison of PWTs at SNI day 35, showing significant analgesia in the group treated with 40 Hz light at 2000 lux compared with untreated controls. n = 11 mice in each group. g Paw withdrawal frequencies to von Frey filaments were significantly lower in SNI mice treated with 40 Hz light at 2000 lux than in untreated controls. n = 14 mice in each group. h The analgesic effects of 40 Hz light at 2000 lux persisted for more than 6 h after cessation of stimulation in SNI mice. n = 12 mice in each group. i Experimental design for different durations of stimulation with 40 Hz light at 2000 lux. j PWTs in CFA mice under different durations of light stimulation: NL (no light stimulation), 40 Hz for 1 h (1 h per 12 h), and 40 Hz for 4 h (4 h per 12 h). Both treatment durations produced comparable analgesic effects. n = 8 mice in each group. k PWTs in SNI mice under the same light treatment regimens as in j, again showing similar analgesic efficacy between 1-h and 4-h stimulation. n = 8 mice in each group. l 40 Hz light flickering at 2000 lux did not affect the development of mechanical hyperalgesia in CFA mice. n = 8 mice in each group. m 40 Hz light flickering at 2000 lux did not affect the development of mechanical hyperalgesia in SNI mice. n = 8 mice in each group. Error bars represent SEM. Numerical labels indicate P values from within-group or between-group comparisons. For behavioral tests, *P < 0.05, **P < 0.01, ***P < 0.001, ****P < 0.0001; ns, not significant.
We first evaluated the analgesic efficacy of light stimulation at flickering frequencies of 20 Hz, 40 Hz, and 80 Hz, as well as direct current (DC) illumination, all delivered at 2000 lux in a chamber illuminated by LEDs. The treatment regimen consisted of two 1-h sessions per day: one in the morning and one 12 h later, totaling 2 h of stimulation daily. In the CFA model, 40 Hz stimulation at 2000 lux significantly alleviated mechanical hyperalgesia after 6 consecutive days of treatment relative to the baseline at CFA day 2 and untreated controls (Fig. 1b). On the basis of paw withdrawal frequency, such light stimulation significantly reduced mechanical hypersensitivity to non-noxious mechanical stimuli (0.07–0.16 g range) (Fig. 1c). The analgesic effects persisted for more than 6 h after stimulation ended, with partial but non-significant effects remaining thereafter (Fig. 1d). In SNI mice, the same 2-h daily regimen required 21 consecutive days to achieve significant analgesic effects (Fig. 1e–g). Similarly, the analgesia persisted for over 6 h after light cessation but diminished substantially thereafter (Fig. 1h). We next assessed thermal sensitivity following light stimulation. The 2000 lux 40 Hz flickering light did not significantly alter responses to either cold (4 °C) or heat (55 °C) stimuli in either model. Nonetheless, we observed a trend toward reduced cold and heat hypersensitivity in SNI mice, which did not reach statistical significance (Supplementary information, Fig. S1a).
Neither 20 Hz nor DC light produced significant analgesia (Fig. 1b, f). Although 80 Hz stimulation significantly reduced mechanical hyperalgesia in CFA mice relative to their baseline at CFA day 2 (P = 0.028), this effect was not statistically significant compared with untreated controls (P = 0.1591) (Fig. 1b), and only a mild, non-significant improvement was seen in SNI mice (Fig. 1f). Lowering the light intensity to 1000 lux at 40 Hz yielded only modest, non-significant improvements in both models (Fig. 1b, f). Collectively, these results showed that 40 Hz light flickering at 2000 lux produced the strongest and most reliable analgesic effects.
To determine whether extending daily exposure would enhance analgesia, we increased the stimulation to 4 h each in the morning and evening (8 h/day). However, the analgesic efficacy was comparable to that observed with the 2-h daily regimen in both models (Fig. 1i–k).
We also examined whether greater brightness would accelerate the therapeutic response. At 4000 lux, 40 Hz flickering for 2 h per day significantly shortened the treatment duration, alleviating hyperalgesia within 3 days in the CFA model and 7 days in the SNI model (Supplementary information, Fig. S1b–e). By contrast, 4000 lux DC light produced minimal effects during the same periods. Because prolonged exposure to high-intensity light (≥ 3000 lux) may cause stress, headaches, or retinal damage, subsequent experiments did not use such high-luminance light. In addition, in the formalin-induced spontaneous pain model, a single 1-h session of 40 Hz light flickering significantly reduced scratching behavior in Phase II compared with untreated controls, indicating a rapid, acute analgesic effect (Supplementary information, Fig. S1f, g). Finally, we explored the prophylactic potential of 40 Hz light flickering applied from the onset of injury. Initiating treatment on the day of CFA injection or SNI surgery failed to prevent the development of mechanical hyperalgesia (Fig. 1l, m). Once chronic pain was established, 2-h and 8-h daily regimens produced comparable analgesic effects. Therefore, a 2-h daily 40 Hz light stimulation at 2000 lux was used for all subsequent experiments.
A 40 Hz light flickering-responsive analgesic ensemble in the CeATo identify neurons activated by 40 Hz light flickering, we used Fos-CreERT2/TRAP2;Ai9 mice, leveraging stimulus-transcription coupling via the immediate early gene Fos. This approach enables the genetic tagging of neurons activated during a defined time window. Accordingly, mice were first injected with CFA or underwent SNI surgery, followed by tamoxifen administration immediately after 40 Hz light treatment to tag the activated neuronal population. Animals were sacrificed one week later for imaging analysis (Fig. 2a–d). Quantification revealed robust activation in the CeA, as evidenced by significantly higher numbers of TRAPed neurons after 6 days (CFA) or 21 days (SNI) of 40 Hz stimulation compared with their respective pain-only controls. By contrast, 1 day of 40 Hz stimulation did not significantly increase the number of TRAPed CeA neurons in either model, with numbers comparable to those of untreated controls (Fig. 2a–d). TRAPed neurons in additional brain regions, including the visual cortex (V1) and insular cortex (IC), were also examined and quantified (Supplementary information, Fig. S2a–c). Representative whole-brain images from SNI mice are provided to illustrate the distribution of TRAPed neurons activated by 40 Hz light stimulation (Supplementary information, Fig. S2d).
Fig. 2: 40 Hz light flickering activates analgesia-associated neurons in the CeA.
a Top: TRAP2 mice were used to label CeA neurons activated by 40 Hz light flickering at 2000 lux in the CFA model. Bottom: counts of serial sections of TRAPed CeA neurons in CFA mice before and after 1 day or 6 days of light stimulation (n = 3 mice in each condition). b Representative serial sections showing TRAPed CeA neurons activated by 40 Hz light flickering at 2000 lux in CFA mice (Fos-CreERT2/TRAP2;Ai9). Scale bars, 100 μm. c Top: TRAP2 mice were used to label CeA neurons activated by 40 Hz light flickering at 2000 lux in the SNI model. Bottom: counts of serial sections of TRAPed CeA neurons in SNI mice before and after 1 day or 21 days of light stimulation (n = 3 mice in each condition). d Representative serial sections showing TRAPed CeA neurons activated by 40 Hz light flickering at 2000 lux in SNI mice (Fos-CreERT2/TRAP2;Ai9). Scale bars, 100 μm. e Left: Schematic of chemogenetic activation of TRAPed CeA neurons by 40 Hz light flickering at 2000 lux in SNI mice (Fos-CreERT2/TRAP2). Scale bars, 1 mm (top) and 100 μm (bottom). Right: Cre-dependent expression of hM3Dq in the CeA, indicated by arrows. f A single chemogenetic activation of TRAPed CeA neurons on either day 10 or day 21 significantly increased PWTs compared with the baseline in the SNI model. Error bars represent SEM. Numerical labels indicate P values from between-group comparisons. n = 6 or 7 mice in each group. g Repeatedly activating the TRAPed CeA neurons on day 1 for three consecutive days resulted in a modest increase in PWT. n = 6 or 7 mice in each group. h Left Schematic of optogenetic activation of TRAPed CeA neurons by 40 Hz light flickering at 2000 lux (Fos-CreERT2/TRAP2). Right: Cre-dependent expression of ChR2 in the CeA is indicated by arrows. Scale bar, 100 μm. i In naïve mice, optogenetic activation of TRAPed CeA neurons modestly increased the PWT compared with the baseline. Error bars represent SEM. Numerical labels indicate P values from between-group comparisons. n = 6 mice in each group. j In both the CFA and SNI models, optogenetic activation of TRAPed CeA neurons by 40 Hz light significantly increased the PWT compared with the baseline and controls. Error bars represent SEM. Numerical labels indicate P values from within-group or between-group comparisons. For behavioral tests, n = 6 mice in each condition. ns, not significant.
To determine the functional contribution of this TRAPed ensemble, we performed chemogenetic activation in SNI mice (Fig. 2e). TRAP2 mice received intra-CeA injections of either AAV-Syn-DIO-hM3Dq or the control AAV-Syn-DIO-mCherry. One week later, mice underwent SNI surgery, and beginning on SNI day 14, they received 21 consecutive days of 40 Hz light stimulation before tamoxifen administration. Two weeks later, a single chemogenetic activation of the TRAPed CeA neurons with deschloroclozapine (DCZ, 1 mg/kg) in the absence of 40 Hz light significantly reduced mechanical hyperalgesia in these SNI mice (Fig. 2e, f). Thus, although some TRAPed cells may have been pain responsive, these findings indicate that the analgesic function of 40 Hz-activated CeA neurons dominated.
We next asked whether this ensemble remained stable across the 21-d stimulation period or shifted over time. To examine temporal dynamics, we TRAPed CeA neurons at early time points (day 1 or day 10 of stimulation) and later performed chemogenetic activation (Fig. 2e). Activation of CeA neurons TRAPed on day 10 produced robust analgesia in SNI mice with a single DCZ injection, whereas activation of neurons TRAPed on day 1 did not (Fig. 2f). Repeatedly activating the day-1 TRAPed population for three consecutive days elicited a delayed analgesic trend, although this effect did not reach statistical significance (Fig. 2g). These findings suggest that multiple stimulations are required to effectively capture the 40 Hz light-responsive analgesic ensemble in the CeA.
Finally, we asked whether TRAPed 40 Hz-responsive CeA neurons in naïve mice were sufficient to confer analgesic potential. TRAP2 mice were injected in the CeA with either AAV-Syn-DIO-mCherry or AAV-Syn-DIO-ChR2. After 3 weeks, mice were divided into three groups: (1) mCherry-injected mice exposed to 2 weeks of 40 Hz flickering (control), (2) ChR2-injected mice maintained under standard ambient light (control), and (3) ChR2-injected mice exposed to 2 weeks of 40 Hz flickering (experimental). Tamoxifen was administered immediately after the light treatment (Fig. 2h). Under naïve conditions, optogenetic activation of the TRAPed CeA neurons produced only a mild, non-significant increase in the paw withdrawal threshold (Fig. 2i). However, after inducing chronic pain with either SNI or CFA, optogenetic activation of these TRAPed CeA neurons by 40 Hz light significantly reduced mechanical hypersensitivity (Fig. 2j). Together, these results demonstrate that 40 Hz light flickering engages a distinct analgesic neuronal ensemble in the CeA. This ensemble forms progressively during repeated stimulation and is sufficient to confer potent analgesic effects across pain models, supporting the therapeutic potential of 40 Hz light flickering for chronic pain relief.
The retina-CeA circuit is essential for analgesia induced by 40 Hz light flickeringTo investigate the neural circuitry underlying antinociception induced by 40 Hz light flickering, we used a rabies virus (RV)-based monosynaptic tracing strategy to map presynaptic inputs to CeA neurons activated by 40 Hz light flickering. In light-treated SNI mice, TRAPed CeA neurons were first infected with AAVs expressing the rabies glycoprotein and helper proteins (Fig. 3a). Twenty-one days later, we injected EnvA-pseudotyped SAD-∆G-DsRed RV into the CeA to selectively infect helper-expressing TRAPed CeA neurons (Fig. 3a). These double-labeled rabies-DsRed+/TVA-EGFP+ neurons served as the starter cells (Fig. 3b), which subsequently produced infectious ∆G-rabies-DsRed that propagated retrogradely to monosynaptically connected inputs. Excitingly and surprisingly, approximately a dozen retinal ganglion cells (RGCs) per retina were labeled (Fig. 3c).
Fig. 3: The retina-CeA pathway mediates analgesia induced by 40 Hz light flickering.
a Schematic of RV-based monosynaptic tracing of TRAPed CeA neurons by 40 Hz light. b Representative images in the CeA showing the starter cells. Scale bars, 100 μm. c A representative retina image showing RV-DsRed-labeled RGCs. Scale bar, 100 μm. d Left: bilateral AAV2/Retro Plus-hSyn-Cre viral injections with a representative image of the injection site in the CeA. Scale bar, 100 μm. Middle: representative whole-mount retina image showing tdTomato-labeled RGCs co-labeled with the RGC marker RBPMS. Scale bars, 1 mm (100 μm for inset). Right: dot plot quantifying the co-localization of tdTomato and RBPMS signals. n = 3 mice in each group. e Left: schematic of chemogenetic manipulation targeting CeA-projecting RGCs. Right: Cre-dependent expression of inhibitory DREADD (hM4Di) and excitatory DREADD (hM3Dq) in the retina. Scale bars, 200 μm. f In the CFA model, chronic chemogenetic activation of CeA-projecting RGCs combined with 40 Hz light flickering significantly enhanced the analgesic effect compared with light stimulation alone. Chronic chemogenetic inhibition of CeA-projecting RGCs abolished 40 Hz light-induced analgesia. Error bars represent SEM. Numerical labels indicate P values from within-group comparisons: PWT at CFA day 8 vs the baseline at CFA day 2. For behavioral tests, n = 8 mice in the hM4Di group, n = 9 mice in the mCherry group, and n = 8 mice in the hM3Dq group. ns, not significant. g Summary of the results in f. Numerical labels indicate P values from between-group comparisons. h In the SNI model, chronic chemogenetic activation of CeA-projecting RGCs combined with 40 Hz light flickering similarly enhanced the analgesic effect of 40 Hz light flickering alone, whereas chronic chemogenetic inhibition abolished the light-induced analgesia. For behavioral tests, n = 8 mice in the hM4Di group, n = 9 mice in the mCherry group, and n = 8 mice in the hM3Dq group. ns, not significant. Error bars represent SEM. Numerical labels indicate P values from within-group comparisons: PWT at SNI day 35 vs the baseline at SNI day 14. i Summary of the results in h. Error bars represent SEM. Numerical labels indicate P values from between-group comparisons.
To independently confirm the existence of a direct retina-CeA projection, we performed retrograde tracing by injecting AAV2/Retro Plus-hSyn-Cre into the CeA of Ai9 mice (Fig. 3d). This approach revealed robust labeling of RGCs, with approximately 60 fluorescently tagged cells per retina (Fig. 3d). Immunohistochemistry confirmed that over 95% of these were RBPMS-positive RGCs, supporting the existence of a direct retina-to-CeA pathway (Fig. 3d).
We performed additional retrograde tracing by injecting AAV2/Retro Plus-hSyn-Cre-EGFP into the CeA of wild-type (WT) mice (Supplementary information, Fig. S3a). Strong EGFP labeling was observed in several brain nuclei, including the anterior hypothalamic area (AHC), paraventricular thalamic nucleus (PVA), and insular cortex (GI, DI, and AIP), all of which are known regions that project to the CeA (Supplementary information, Fig. S3a). To assess the functional relevance of this retina-CeA circuit, we used chemogenetic tools to manipulate CeA-projecting RGCs. AAV2/Retro Plus-hSyn-Cre was bilaterally injected into the CeA, followed by intravitreal delivery of Cre-dependent AAVs encoding hM3Dq (activating DREADD), hM4Di (inhibitory DREADD), or mCherry (control) into the eyes (Fig. 3e). The expression of Cre-dependent hM3Dq and hM4Di in the retina was confirmed by the fluorescence signals of EGFP and mCherry, respectively (Fig. 3e). Chronic chemogenetic activation of CeA-projecting RGCs alone via intraperitoneal administration of DCZ (1 mg/kg, twice daily) for up to seven days tended to increase the paw withdrawal threshold in CFA mice compared with the control, but this effect did not reach statistical significance (Supplementary information, Fig. S3b, c). However, when combined with 40 Hz light flickering, chronic chemogenetic activation significantly enhanced analgesia in both CFA and SNI models compared with 40 Hz light flickering alone (Fig. 3f–i). More importantly, chronic chemogenetic activation combined with 40 Hz light flickering significantly shortened the duration required for light-induced analgesic effects in both pain models (Fig. 3f–i). These effects phenocopied those observed with increased light intensity. By contrast, chronic chemogenetic inhibition (DCZ, 1 mg/kg, twice daily right before light stimulation) of CeA-projecting RGCs abolished the analgesic effects of 40 Hz light stimulation (Fig. 3f–i).
To further confirm this circuit, we directly stimulated the retinorecipient CeA neurons using an anterograde labeling strategy (Fig. 4a). One week after bilateral intravitreal injection of the anterograde spreading AAV1-Cre, we injected AAV-hSyn-DIO-ChR2 or AAV-hSyn-DIO-EYFP (control) into the CeA (Fig. 4b). Acute brain slice recordings demonstrated that blue light stimulation in ChR2-expressing retinorecipient CeA neurons reliably evoked trains of action potentials (Fig. 4c, d). Furthermore, our results confirmed that neither ChR2 nor EYFP expression altered the electrophysiological properties of the recorded CeA neurons (Fig. 4e, f). Four weeks after viral injections, mice were subjected to either a CFA injection or SNI surgery. Subsequently, the injured mice underwent twice-daily 15-min optogenetic stimulation sessions. This activation significantly reduced mechanical hyperalgesia after five consecutive days of stimulation in CFA mice and nine days in SNI mice (Fig. 4g, h), demonstrating the sufficiency of the pathway in mediating analgesia. Next, we tested the necessity of the retina-CeA circuit by expressing tetanus neurotoxin (TeNT) in the retinorecipient CeA neurons. Following bilateral intravitreal injection of AAV1-Cre, mice received CeA injections of either AAV-hSyn-DIO-TeNT or AAV-hSyn-DIO-EYFP (control). Blocking the synaptic output of retinorecipient CeA neurons abolished the analgesic effects of 40 Hz light flickering in both pain models (Fig. 4i, j), demonstrating that intact synaptic transmission in this circuit is necessary for mediating antinociception.
Fig. 4: Retinorecipient CeA neurons mediate 40 Hz light flickering-induced analgesia.
a Schematic of the experimental workflow. AAV1-hSyn-Cre was injected intravitreally to transduce RGCs, followed by intra-CeA injection of Cre-dependent AAVs expressing ChR2, TeNT, or EYFP. b Representative images showing ChR2 expression in CeA neurons receiving input from RGCs. Left: scale bars, 200 μm. Right: scale bar, 100 μm. c Top: schematic of the electrophysiological recording. AAV1-hSyn-Cre was injected intravitreally to transduce RGCs, followed by intra-CeA injection of Cre-dependent AAVs expressing ChR2 or EYFP. Bottom: representative bright-field (left) and fluorescent (right) images of acute amygdala slices. Left: scale bar, 200 μm. Right: scale bars, 50 μm. d Representative traces of whole-cell current-clamp recordings obtained from CeA neurons transduced with EYFP (left) or ChR2 (right) and irradiated with a 473-nm laser. Action potentials were elicited using a 3-s depolarizing current injection that evoked a train of action potentials (APs) after the laser application in the ChR2 group. In the EYFP group, no APs were elicited after the laser irradiation. Injected current amplitudes are illustrated under the voltage records. e Evoked spikes by currents were analyzed for CeA neurons expressing EYFP and ChR2. Values are presented as mean ± SEM. f Resting membrane potentials were analyzed for CeA neurons expressing EYFP and ChR2. Values are presented as mean ± SEM. g Chronic optogenetic activation of retinorecipient CeA neurons significantly increased the PWT in CFA mice compared with the control. Error bars represent SEM. Numerical labels indicate P values from between-group comparisons. For behavioral tests, n = 6 mice in each group. h Chronic optogenetic activation of retinorecipient CeA neurons significantly increased the PWT in SNI mice compared with the control. Error bars represent SEM. Numerical labels indicate P values from between-group comparisons. For behavioral tests, n = 6 mice in each group. i Silencing the retina-CeA pathway via TeNT expression abolished the analgesic effect of 40 Hz light flickering in CFA mice. Error bars represent SEM. Numerical labels indicate P values from between-group comparisons. For behavioral tests, n = 6 mice in each group. j Silencing the retina-CeA pathway via TeNT expression abolished the analgesic effect of 40 Hz light flickering in SNI mice. Error bars represent SEM. Numerical labels indicate P values from between-group comparisons. For behavioral tests, n = 6 mice in each group.
Finally, we examined the role of intrinsically photosensitive RGCs (ipRGCs), which are known to mediate non-image-forming light responses. To selectively ablate ipRGCs, melanopsin-conjugated saporin (melanopsin-SAP) was bilaterally injected into the vitreous humor (Fig. 5a). Melanopsin-SAP effectively ablated ipRGCs by 70% (Fig. 5a). Three weeks post-injection, melanopsin-SAP-treated mice displayed no significant change in baseline paw withdrawal threshold (Fig. 5b). Importantly, the antinociceptive effects of 40 Hz light flickering remained intact in both CFA and SNI models, despite ablation of ipRGCs (Fig. 5c, d). These results indicate that ipRGCs are not essential for the analgesia induced by 40 Hz light flickering.
Fig. 5: Melanopsin-expressing RGCs are not required for 40 Hz light flickering-induced analgesia.
a Top: experimental design. Intravitreal injection of melanopsin-saporin (Mela-SAP) was used to ablate ipRGCs, followed by behavioral testing using the von Frey assay. Bottom: representative retinal whole-mount images showing melanopsin-positive cells (UF008 antibody) after Mela-SAP injection, confirming targeted ablation. Scale bars, 100 μm. For cell counting, n = 3 mice in each group, P < 0.001. b Mela-SAP-mediated ablation of ipRGCs did not alter the PWT under naïve conditions. Error bars represent SEM. Numerical labels indicate P values from between-group comparisons. For behavioral tests, n = 11 mice in each group. ns, not significant. c Experimental design for Mela-SAP ablation in the CFA and SNI models. d Mela-SAP ablation of ipRGCs did not impair 40 Hz light flickering-induced analgesia in CFA or SNI model mice. Error bars represent SEM. Numerical labels indicate P values from between-group comparisons. For behavioral tests, n = 9 mice in each group. ns, not significant.
Together, these data define a novel retina-CeA visual pathway that is both necessary and sufficient for the analgesia induced by 40 Hz flickering, acting independently of ipRGCs and relying on conventional RGCs to elicit pain relief.
Adenosine signaling in the CeA mediates the analgesia induced by 40 Hz light flickeringPrevious studies have suggested a role for adenosine in the changes in brain function induced by 40 Hz light flickering.38,39 To investigate whether adenosine might be involved in the observed analgesic effects, we used a highly sensitive and selective adenosine sensor (GRABAdo) to monitor extracellular adenosine dynamics in the CeA during light stimulation.40 Following the injection of an AAV expressing GRABAdo or a non-binding mutant of GRABAdo (GRABAdo-mut) into the CeA, as depicted in Fig. 6a, we used fiber photometry to measure fluorescence signals that reflected extracellular adenosine levels.
Fig. 6: 40 Hz light flickering increases extracellular adenosine levels in a light frequency- and intensity-dependent manner in the CeA in correlation with LFP gamma power.
a Experimental design for adenosine recording during light stimulation. Middle: a representative image showing expression of the adenosine sensor in the CeA. Scale bar, 100 μm. b Effects of light flickering at different intensities and frequencies on extracellular adenosine levels in the CeA. n = 6 mice in each group. c Quantification of light flickering-evoked adenosine signals in the CeA, with AUC values showing that 40 Hz light flickering at 2000 lux yielded the greatest increase. n = 6 mice in each group. d 40 Hz light flickering at 2000 lux elicited a similar increase in extracellular adenosine levels in the CeA in both CFA and SNI models. n = 6 mice in each group. e Ablation of ipRGCs by Mela-SAP did not affect the light flickering-induced increase in extracellular adenosine levels in the CeA. n = 6 mice in each group. f Top: HPLC assays were used to quantify total adenosine levels in the CeA. Bottom: total adenosine levels in the CeA were significantly lower in SNI mice compared with naïve controls but were restored by 40 Hz light flickering at 2000 lux. g Workflow for multichannel LFP recording in the CeA during light treatment. h Spectral power density of LFP in the CeA for control vs light treatment groups. The area enclosed by the dashed line indicates the position of 40 Hz ± 2 Hz. n = 8 mice in each group. i 40 Hz flickering at 2000 lux significantly increased gamma-band power in the CeA under light stimulation compared with the control (P < 0.001). Error bars represent SEM. n = 8 mice in each group.
Upon exposure to 40 Hz light flickering at 2000 lux, a robust and sustained increase in extracellular adenosine concentrations was observed in the CeA, with fluorescence intensity (ΔF/F) remaining elevated, up to 20% above baseline, for at least 30 min post-stimulation (Fig. 6b). We next examined the effect of different light frequencies and intensities on extracellular adenosine production in the CeA. Whereas 40 Hz light flickering at 1000 lux and 80 Hz light flickering at 2000 lux elicited moderate increases in extracellular adenosine levels in the CeA, 20 Hz light flickering and DC at 2000 lux produced marginal changes (Fig. 6b, c). These results demonstrate that adenosine release is dependent on both the frequency and intensity of light. In both the CFA and SNI models, 40 Hz light flickering at 2000 lux produced similar significant increases in extracellular adenosine levels in the CeA, comparable to those observed in naïve mice (Fig. 6d). Importantly, the increase in extracellular adenosine in the CeA was unaffected by melanopsin-SAP treatment (Fig. 6e).
To confirm these findings, we performed HPLC assays to measure the increase in endogenous adenosine levels in the CeA induced by 40 Hz light flickering. In SNI mice, total adenosine levels in the CeA were markedly reduced compared with those of naïve controls. Notably, 1 h of 40 Hz light stimulation significantly increased total adenosine levels in the CeA of SNI mice, restoring them to levels comparable to those observed in naïve mice (Fig. 6f). Moreover, electrophysiological recordings of local field potentials revealed that 40 Hz light flickering at 2000 lux entrained gamma-band oscillations in the CeA, directly coupling rhythmic visual input with local neural activity (Fig. 6g–i).
Because extracellular adenosine primarily arises from equilibrative nucleoside transporter (ENT)-mediated efflux of intracellular adenosine generated during ATP consumption,41,42 we next assessed the contribution of ENT1/2-dependent transmembrane transport to 40 Hz light-induced adenosine elevation in the CeA. Pretreatment with dipyridamole (15 mg/kg, i.p.),43 an ENT1/2 inhibitor administered 40 min before the light-flickering stimulus, completely abolished any increase in extracellular adenosine in response to 40 Hz light (Fig. 7a, b). We also examined the effects of direct dipyridamole administration in the right CeA on mouse pain behaviors (Fig. 7c). The results showed that various doses of dipyridamole negatively affected the paw withdrawal threshold of naïve mice (Fig. 7d). Administration of dipyridamole at higher doses of 1.0 μg or 4.0 μg effectively abolished the analgesic effects induced by 40 Hz light flickering in both CFA and SNI models (Fig. 7e, g). Even a lower dose of 0.2 μg dipyridamole, administered continuously over two days, significantly counteracted the analgesic effects of 40 Hz light flickering (Fig. 7f, h).
Fig. 7: Dipyridamole antagonizes 40 Hz light flickering-induced analgesia.
a Schematic illustration of the release of adenosine via ENTs and pharmacological inhibition of ENTs by dipyridamole administration. b Top: experimental design for in vivo adenosine measurement following intraperitoneal dipyridamole administration. Bottom: intraperitoneal injection of dipyridamole abolished the light flickering-induced increase in extracellular adenosine in the CeA. n = 6 mice. c Schematic showing cannula implantation in the CeA for local dipyridamole delivery and von Frey testing in naïve mice. d In naïve mice, intra-CeA dipyridamole injection induced a dose-dependent decrease in the PWT. Error bars represent SEM. Numerical labels indicate P values from between-group comparisons. For behavioral tests, n = 8 mice in each group. e Intra-CeA administration of dipyridamole at a dose of 1.0 μg or 4.0 μg effectively reversed the analgesic effects of light flickering in CFA mice. Error bars represent SEM. Numerical labels indicate P values from between-group comparisons. For behavioral tests, n = 8 mice in each group. f Repeated administration of a low dose (0.2 μg) of intra-CeA dipyridamole over 2 d also effectively reversed light flickering-induced analgesia in CFA mice, suggesting cumulative effects. Error bars represent SEM. Numerical labels indicate P values from between-group comparisons. For behavioral tests, n = 8 mice in each group. g Intra-CeA dipyridamole at a dose of 1.0 μg or 4.0 μg similarly reversed light flickering-induced analgesia in SNI mice. Error bars represent SEM. Numerical labels indicate P values from between-group comparisons. For behavioral tests, n = 8 mice in each group. h Repeated low doses (0.2 μg) of intra-CeA dipyridamole over 2 d effectively blocked the analgesic effects of light flickering in SNI mice, again indicating cumulative action. Error bars represent SEM. Numerical labels indicate P values from between-group comparisons. For behavioral tests, n = 8 mice in each group. i Schematic illustrating adenosine release via ENTs and pharmacological inhibition of ENT1 through intra-CeA administration of NBMPR. j In naïve mice, intra-CeA NBMPR administration produced a dose-dependent reduction in the PWT. Error bars represent SEM. Numerical labels indicate P values from between-group comparisons. For behavioral tests, n = 8 mice in each group. k In CFA mice, three consecutive daily intra-CeA injections of a low dose of NBMPR (2 μL of 50 μM) showed a tendency to partially attenuate the analgesic effects induced by 40 Hz light flickering. Error bars represent SEM. Numerical labels indicate P values from between-group comparisons. For behavioral tests, n = 8 mice in each group. l In SNI mice, three consecutive daily intra-CeA injections of a low dose of NBMPR (2 μL of 50 μM) showed a tendency to partially attenuate 40 Hz light flickering-induced analgesia. Error bars represent SEM. Numerical labels indicate P values from between-group comparisons. For behavioral tests, n = 8 mice in each group.
Because dipyridamole has multiple pharmacological targets in addition to ENT1/2 inhibition,44 we tested the contribution of ENT1 using the highly selective inhibitor NBMPR, which is the gold-standard antagonist for ENT145 (Fig. 7i). Prior studies have shown that microinjection of 50 μM NBMPR into the CeA at a dose of 0.5 μL reduced anxiety-like behavior,46 indicating the functional role of ENT1 in the CeA. Here, we evaluated two doses of NBMPR delivered to the right CeA of naïve mice (2 μL of 50 μM or 2 μL of 1 mM). Whereas the higher dose (2 μL of 1 mM) altered baseline behaviors, the lower dose (2 μL of 50 μM) did not affect mechanical sensitivity in naïve animals (Fig. 7j) and was therefore selected for subsequent experiments. In both CFA and SNI models, NBMPR was microinjected into the CeA 15 min before each 40 Hz light stimulation. Three consecutive NBMPR administrations showed a tendency to partially attenuate the analgesic effects of 40 Hz light flickering; however, this effect did not reach statistical significance in either model (Fig. 7k, l). Given that 40 Hz light flickering robustly increases intracellular adenosine production, ENTs are expected to function predominantly in the efflux mode under these conditions. These results are supported by our previous observations in the V1 using ENT knockout mice, in which ENT2 knockout nearly abolished the 40 Hz light-induced increase in extracellular adenosine, whereas ENT1 knockout only partially attenuated this response.38 The preferential involvement of ENT2 may be attributable to its higher transport capacity and approximately fourfold higher expression in neurons and astrocytes, which would enable more efficient elevation of extracellular adenosine during light flickering.47,48 Together, these findings suggest that both ENT1 and ENT2 may contribute to the 40 Hz light-induced elevation of extracellular adenosine in the CeA, with ENT2 likely playing a more prominent role.
To determine whether direct adenosine administration could mimic 40 Hz light-induced analgesia, we infused various doses of adenosine (0.2 μg, 1.0 μg, and 2.0 μg) into the right CeA. In naïve mice, none of these adenosine doses significantly affected paw withdrawal thresholds (Fig. 8a, b). We then applied the same doses of adenosine via cannula to the right CeA of CFA and SNI mice. Notably, higher doses of adenosine (1.0 μg and 2.0 μg) rapidly alleviated mechanical hyperalgesia in these models (Fig. 8c, e). A lower dose of adenosine at 0.2 μg did not immediately reduce mechanical hypersensitivity. However, following > 2 days of consecutive administration, 0.2 μg adenosine also significantly increased the paw withdrawal threshold in CFA and SNI mice (Fig. 8d, f). In our HPLC analysis, the total adenosine content of the CeA differed by 0.13 µg between naïve and SNI mice, and 40 Hz light stimulation increased adenosine levels in SNI mice by 0.11 µg, an amount comparable to the lower dose (0.2 µg) used in our in vivo pharmacological assays. Consistent with these measurements, our pharmacological experiments demonstrated that increasing extracellular adenosine in the CeA is sufficient to produce antinociceptive effects and that these effects are cumulatively enhanced by repeated daily administration.
Fig. 8: Intra-CeA adenosine administration all
Comments (0)