
Remember me

MICs for tobramycin and HT61 against 63 different clinical isolates of P. aeruginosa are shown in Table 1. MICs for tobramycin ranged from 0.13 µg/mL to > 2048 µg/mL. Based on a clinical breakpoint for tobramycin of 2 µg/mL [25], 38 (60%) isolates were classified as tobramycin-resistant, and 25 (40%) isolates were classified as tobramycin-sensitive. In-line with previously work all clinical isolates showed limited susceptibility to HT61, with MICs ranging between 16 and 256 µg/mL.
Table 1 Results of susceptibility testing (MICs) for tobramycin and HT61, and the synergy testing (FICIs) of combination therapies for strains 1–63Combination with HT61 Demonstrates Synergism by Increasing P. aeruginosa Sensitivity to TobramycinCombination therapy across all clinical isolates using the chequerboard assay of synergy (Table 1) revealed that 47 isolates (isolates 1–47) (74.60%) demonstrated positive interactions (FICI ≤ 1.0) between HT61 and tobramycin. Of these 47 isolates, 18 (28.57%, Isolates 1–18) demonstrated synergistic interactions. Only 16 (25.40%) isolates (isolates 48–63) failed to show any positive interactions; no strains demonstrated any evidence of antagonism as determined by a FICI > 4.0. Of the 47 isolates that demonstrated positive interactions, 34 were classified as tobramycin-resistant and 13 classified as tobramycin-sensitive. Combination treatment with HT61 and tobramycin resulted in the conversion of the sensitivity classification for 26.47% (9/34) of isolates from tobramycin-resistant to tobramycin-sensitive.
Bacterial Time-Kill Analysis Reveals Synergy Between HT61 and Tobramycin Against CF P. aeruginosa Isolates12 of the 63 isolates were selected for further analysis using bacterial time-kill assays. These isolates were selected to include those demonstrating synergy (Isolates 1, 5, 6, 9 and 13), additivity (Isolates 29, 30, 37, 39 and 43) or no interaction (Isolates 61 and 63) based on FICI values. These chosen strains also included strains which demonstrated resensitisation to tobramycin (1, 6 and 9) or remained the same (5, 13, 20, 30, 37, 39, 43, 61 and 63); and covered a range of different changes in MICs (ΔMIC) for tobramycin when used in combination (0–1621 µg/mL).
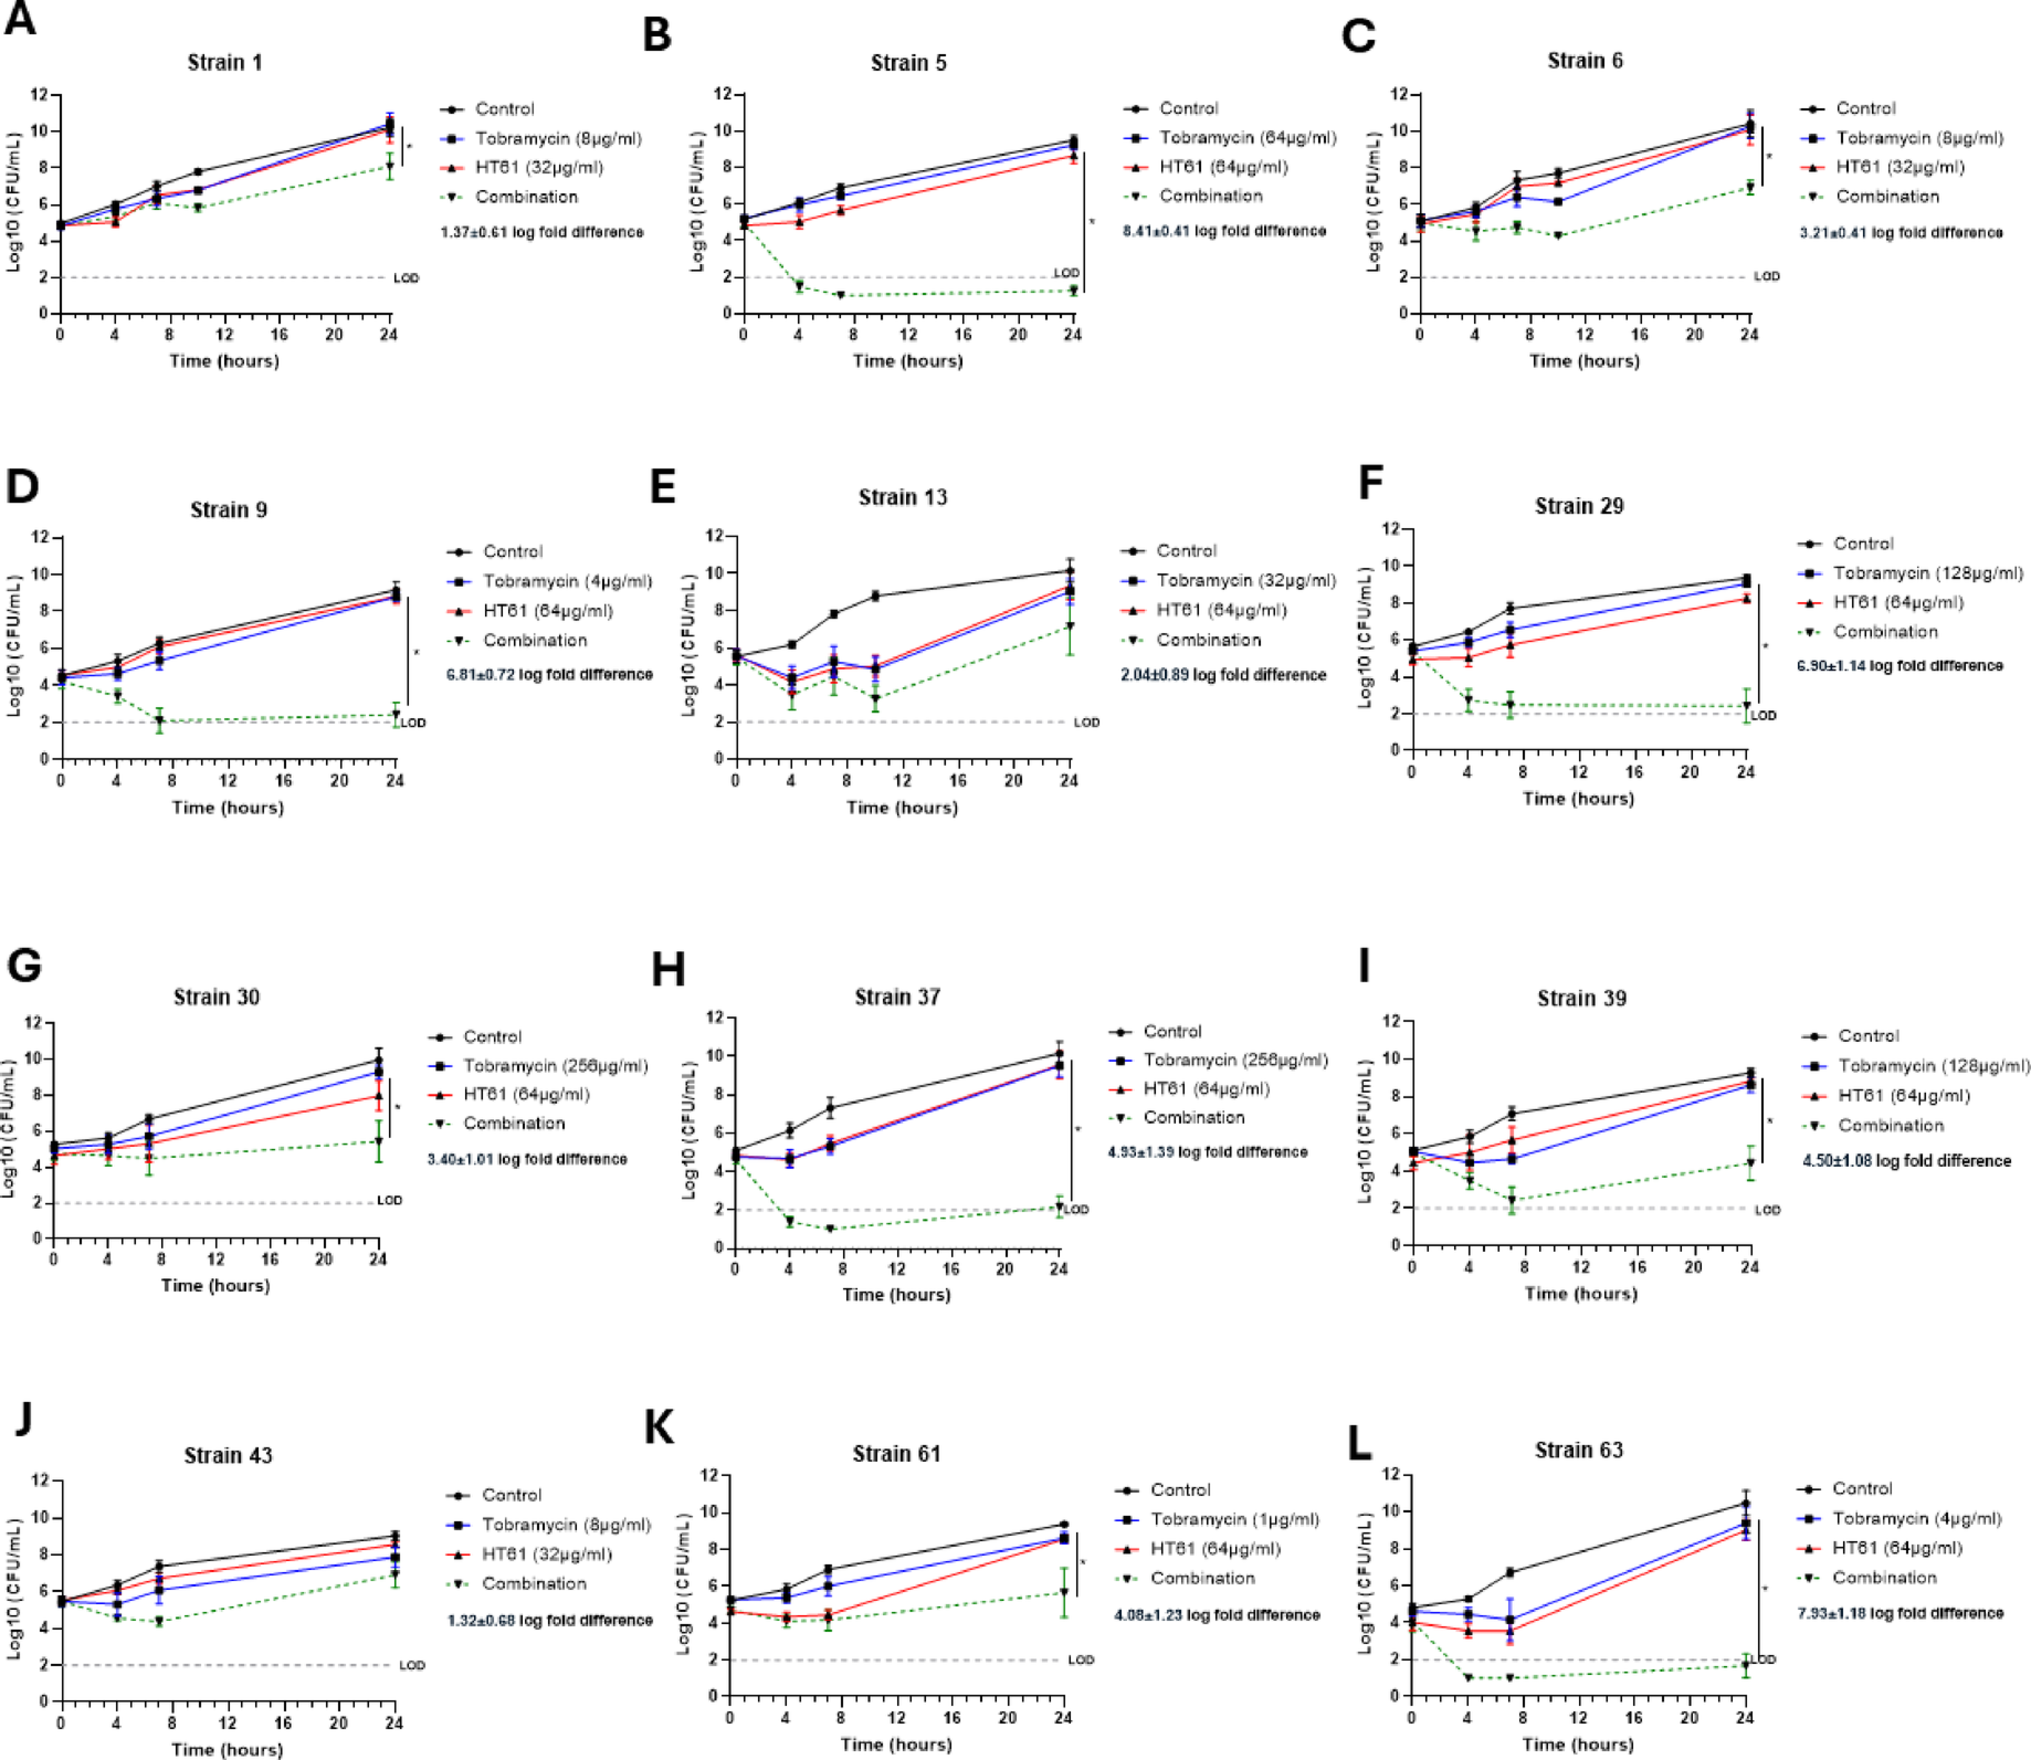
Figure 1 shows time-kill data obtained for this sample set. Preliminary titration experiments were performed for each isolate to identify sub-inhibitory concentrations of HT61 and tobramycin against each isolate. Synergy was accepted as a greater than 2 log-fold difference in bacterial count between combination and individual therapy at 24 h [22]. 3/5 isolates (Fig. 1B–D) demonstrating synergism in the chequerboard assay (FICI ≤ 0.5) also demonstrated synergy in bacterial time-kill assays with a log-order reduction of 6.64 ± 0.41 cfu/mL, 3.05 ± 0.70 cfu/mL, and 5.78 ± 0.47 cfu/mL at 24 h for isolates 5, 6, and 9, respectively. Notable differences between the activity profile of tobramycin when used in combination were observed in these isolates, with isolates 5 and 9 showing a > 3 log cfu reduction within the first 7 h with bacterial counts remaining below the assay’s limit of detection (LOD) for the remainder of the study, indicating bacterial eradication. Conversely, following combination therapy, isolate 6 demonstrated limited efficacy with only a ~ 1 log reduction observed in the first 7 h followed by bacterial regrowth. Neither isolates 1 (Fig. 1A) or 13 (Fig. 1E) reached the threshold for synergy with a log-order reduction of 2.01 ± 0.63 cfu/mL and 1.35 ± 0.88 cfu/mL, but this was within the margin of the calculated SEMs. Secondary analysis using the BLUR model of synergy [23] demonstrated statistically significant synergism (P < 0.05) for isolates 1, 5, 6 and 9 (Table 2).
Fig. 1
Bacterial time-kill assay demonstrating synergy between tobramycin and HT61 against P. aeruginosa. Bacterial time-kill curves for vehicle control (black), sub-inhibitory monotherapy of tobramycin (blue), HT61 (red) and combination (green) against the P. aeruginosa CF clinical isolates classified as synergistic (A-E) (A), 5 (B), 6 (C), 9 (D), 13 (E); isolates classified as additive: 29 (F), 30 (G), 37 (H), 39 (I), 43 (J) and those with no-interaction: 61 (K), 63 (L). Samples were collected for enumeration at 0, 4, 7 and 24 h post-treatment. Synergy was determined when combination therapy was > 2 log-fold difference compared to the lowest monotherapy at 24 h. * = P < 0.05 from analysis using the BLUR model of synergy. Data are expressed as mean ± SEM log cfu/mL, N = 4–6 per group. The limit of detection (LOD, 100 cfu/mL) is demonstrated by the grey dotted line
Table 2 Results of BLUR analysis of Synergy for tobramycin-HT61 combinations in bacterial time-kill assaysSynergy was detected in 4 out of 5 (Fig. 1F–I) isolates defined as additive by the chequerboard assay, with a log-order reduction of 5.13 ± 0.82 cfu/mL, 2.27 ± 0.32 cfu/mL, 6.36 ± 0.71 cfu/mL, and 3.84 ± 0.84 cfu/mL at 24 h for isolates 29, 30, 37, and 39, respectively. Notable differences were again observed in the killing profile of tobramycin when used in combination. Isolates 29, 37 and 39 demonstrated a ≥ 3 log-fold reduction within the first 7 h which remained below the LOD for the remainder of the assay, with the exception of 37 which demonstrated modest bacterial regrowth 24 h post treatment. Isolate 30 demonstrated stable bacterial numbers throughout the duration of the experiment with < 1 log reduction suggestive of a bacteriostatic response. BLUR analysis confirmed statistically significant synergism (P < 0.05) for isolates 29, 30, 37 and 39 (Table 2). Only strain 43 (Fig. 1J) failed to show synergy in the time-kill assay with a log-order reduction of 1.80 ± 0.77 cfu/mL observed following 24 h of treatment. However, this remained within the margin of the calculated SEMs.
Isolates 61 and 63 which showed no interaction based on FICI values demonstrated synergistic bactericidal activity with log-order reductions of 3.39 ± 0.97 and 6.13 ± 0.82 for 61 and 63, respectively (Fig. 1K, L). BLUR analysis also confirmed statistically significant synergism (P < 0.05) for both isolates (Table 2).
HT61 Significantly Enhances the Bactericidal Activity of Tobramycin in Established Biofilms of CF P. aeruginosa IsolatesSynergy was demonstrated with the combination of tobramycin and HT61 against Isolates 1, 5, 6, 9 in the chequerboard assay and against biofilms, as defined by a ≥ 4-fold reduction in modal MBEC between tobramycin alone or in combination [24] (0 vs 100 µg/mL HT61, P < 0.01). Isolates 1 and 6 (Fig. 2A and C) demonstrated a 4-fold reduction, and isolates 5 and 9 (Fig. 2B and D) demonstrated a 16-fold reduction when treated with tobramycin combined with 100 µg/mL HT61 as compared to tobramycin alone. Whilst all 5 strains demonstrated a statistically significant concentration-dependent reductions in MBEC when treated with tobramycin, the reduction in MBEC for Isolate 13 (Fig. 2E) did not meet the criteria for synergy in this biofilm assay as only a twofold reduction in modal MBEC was seen with 100 µg/mL HT61.
Fig. 2
HT61 reduces the concentration of tobramycin required to eradicate P. aeruginosa in established biofilms. Increasing concentrations of tobramycin were combined with fixed concentrations of HT61 (0, 25, 50 or 100 µg/mL) and used to challenge 24 h old established biofilms of the P. aeruginosa CF clinical isolates classified as synergistic: 1 (A), 5 (B), 6 (C), 9 (D), 13 (E); isolates classified as additive: 29 (F), 30 (G), 37 (H), 39 (I), 43 (J) and those with no-interaction: 61 (K), 63 (L). The MBEC was determined as the lowest concentration capable of eradicating visible bacteria within a biofilm following antibacterial challenge of established biofilms. Data are expressed as modal tobramycin MBEC (n = 4 per group). Synergy was accepted when a combination therapy produced fourfold or greater reduction in modal MBEC. * = P < 0.05, ** P < 0.01, *** P < 0.001 compared to vehicle control following a one-way ANOVA and Dunnett’s multiple comparison test
The combination of tobramycin and HT61 demonstrated additive interactions against Isolates 29, 30, 37, 39 and 43 based on FICI values but demonstrated synergy against biofilm cultures with 16-fold, 8-fold, 4-fold, 8-fold and 4-fold reductions (Fig. 2F–J, P < 0.05) respectively. Furthermore, a significant concentration-dependent reduction in MBEC was seen for all isolates tested, in agreement with the time-kill analyses except for isolate 43, which did not meet the threshold for synergism suggesting greater activity of the combination against biofilm resident P. aeruginosa.
The combination of tobramycin and HT61 also demonstrated synergy against biofilms of Isolates 61 and 63 (Fig. 2K, L) with fold reductions of 16 and 8, respectively, again demonstrating a significant concentration-dependent reduction in MBEC despite showing no interactions based on FICI values.
Comments (0)