DNA and RNA sample preparation
Japanese LCLs, derived from B lymphocytes, were obtained from the NIGMS Human Genetic Cell Repository at the Coriell Institute. Cells were cultured in RPMI-1640 medium supplemented with 15% fetal bovine serum and 1% penicillin–streptomycin. For stimulation experiments, LCLs were treated with 50 ng/mL recombinant human IFNα2 (BioLegend) for 6 h, while untreated cells served as controls. Approximately 1 × 10⁷ cells were collected for each extraction.
Genomic DNA was isolated using the DNeasy Blood & Tissue Kit (QIAGEN), and total RNA was extracted using the RNeasy Mini Kit (QIAGEN), following the manufacturer’s instructions. Nucleic acid concentration and purity were assessed with a NanoDrop spectrophotometer (Thermo Fisher Scientific), and RNA integrity was evaluated using an Agilent 2100 Bioanalyzer (RNA 6000 Nano Kit). Only RNA samples with RNA integrity number (RIN) > 9.0 were used for downstream analyses.
Nanopore long-read sequencing
Genomic DNA libraries from LCLs (NA18943 and NA18948) were prepared using the SQK-LSK109 ligation sequencing kit (Oxford Nanopore Technologies) and sequenced on a PromethION platform equipped with FLO-PRO001 flow cells according to the manufacturer’s guidelines. Basecalling was performed using Guppy v6.4.1 in super-accurate mode.
For long-read transcriptome sequencing, cDNA libraries from IFNα2-stimulated NA18943 were prepared using the SQK-PCB114.24 cDNA-PCR Barcoding Kit V14 (Oxford Nanopore Technologies) and sequenced on PromethION PRO114M flow cells. Basecalling was performed using Dorado v0.9.8 in super-accurate mode.
Sequencing data acquisition
RNA-seq datasets for FSHD and control samples—including LCLs (n = 18), myoblasts (n = 6), and myotubes (n = 6)—were retrieved from Gene Expression Omnibus (GEO) accession GSE153523 [5]. Breast tumor and normal tissue RNA-seq data were obtained from GEO accession GSE233242, including Luminal A (n = 29), Luminal B (n = 3), triple-negative breast cancer (TNBC, n = 9), HER2-positive tumors (n = 2), and normal tissue controls (n = 43) [6].
SWGS data from Japanese LCLs (n = 104) were obtained from the 1000 Genomes Project for DUX4C and DUX4T genotyping. RNA-seq data from a subset of these Japanese LCLs, including IFNα2-stimulated (n = 94) and non-stimulated (n = 20) samples, were retrieved from the DDBJ Sequence Read Archive (SRA; accession DRA016395) [7]. Long-read RNA-seq data generated in this study have been deposited in the DDBJ Sequence Read Archive (DRA) under BioProject accession number PRJDB39925.
Haplotype analysis of DUX4C region
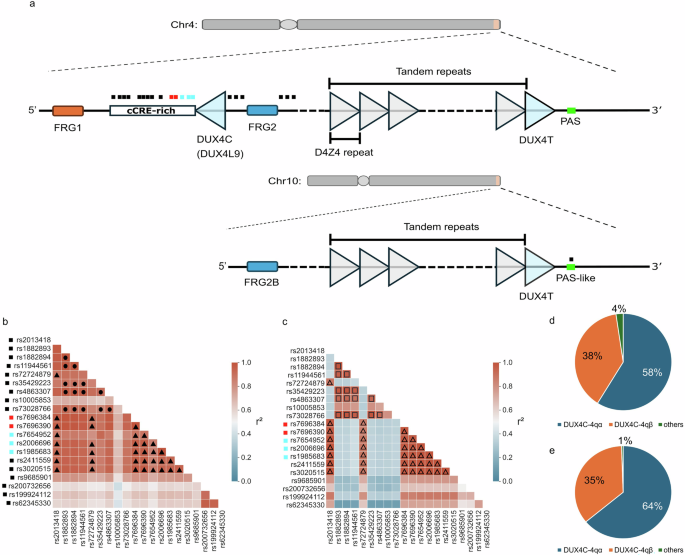
Expression quantitative trait loci (eQTL) data for DUX4L9 (ENSG00000224807.5) in LCLs were obtained from the GTEx Analysis Release V10 (dbGaP accession phs000424.v10.p2) on 08/01/2025. Variants with a normalized effect size (NES) ≥ 0.5 were selected (20 variants in total). Corresponding genotypes for these variants in the European (n = 373) and Japanese (n = 94) populations were obtained from the 1000 Genomes Project [8]. Variants with a minor allele frequency (MAF) < 0.1 were excluded. Pairwise linkage disequilibrium (LD) was calculated using PLINK v1.90b6.16 [9], and LD heatmaps were visualized in Python using Seaborn. Haplotype phasing and frequency estimation were performed using Beagle v5.5 [10].
LWGS data from NA18943 and NA18948 were basecalled using Guppy and aligned to the GRCh38 reference genome with Minimap2 v2.30 under default settings [11]. DNA methylation states were inferred using DeepMod2 v0.3.0 with the r9.4.1 model [12]. For each variant, mean methylation levels were calculated within a ± 50 bp window centered on the position.
Simulated mapping of DUX4T breakpoint sequences
Simulated short-read datasets were generated from known DUX4T haplotype breakpoint sequences (Table S2a) using Sandy v0.24 with the parameters -c 30 -m 50 -e 0.01 -t single-end. Simulated reads were aligned to the CHM13v2.0 and GRCh38 reference genomes using BWA-MEM v0.7.19 with default parameters [13]. Alignments were sorted, and low-quality reads (MAPQ < 10) were filtered using Samtools v1.22.1.
Extraction and alignment of DUX4-like genes
DUX4-like (DUX4L) sequences in the CHM13v2.0 reference genome were identified by extracting regions annotated as “DUX4” from both the genome FASTA and corresponding GFF3 files. Coding regions were compared against canonical DUX4 domains defined in the DUX4 mRNA reference (NCBI protein accession: NP_149418.2). Based on the presence or absence of key domains, DUX4L sequences were classified into three groups: (i) those containing both homeobox domains (HD1 and HD2) and the transcriptional activation domain (TAD); (ii) those retaining HD1 and HD2 but lacking a TAD; and (iii) those lacking all three domains. Multiple sequence alignment was conducted using ApE v3.1.8.1 [14].
Acquisition of complete DUX4C and DUX4T haplotype sequences
We used LWGS data selected from Japanese LCL samples, including one homozygous sample for DUX4C-4qα and DUX4T-4qB [15], as well as another homozygous sample for DUX4C-4qβ and DUX4T-4qA, to extract the complete DUX4 sequences. The DUX4C sequence within the FRG1–DUX4L9–FRG2 region (chr4:193,282,466–193,399,128) was retrieved from the CHM13v2.0 T2T genome. DUX4T haplotype sequences were obtained from the NCBI Nucleotide Database, including DUX4T-4A161 (HM190178.1), DUX4T-10A166 (HM190186.1), and DUX4T-4B163 (HM190161.1). Because DUX4T-4qB and DUX4T-10qB share identical breakpoint sequences, making them indistinguishable for genotyping, we extracted a complete DUX4T-B sequence from NA18943 (DUX4T: 4qB/4qB; 10qA/10qA), which served as the reference sequence for both 4qB and 10qB DUX4T haplotypes.
From these sequences, 200-bp regions spanning the DUX4T breakpoints and adjacent 3′ segments were extracted as mapping references [15]. LWGS data from NA18943 and NA18948 were aligned using Winnowmap2 v2.03 with a k-mer size of 20 [16]. Reads with MAPQ < 10 were removed using Samtools. Breakpoint-containing reads corresponding to DUX4T-4qA (NA18948), DUX4T-10qA (NA18948), and DUX4T-B (NA18943) were identified, and 21,680-bp regions spanning the last two D4Z4 repeats through exon 7 of the DUX4 long isoform (GenBank: NR_137167.1) were extracted. D4Z4 tandem repeat arrays (chr4:193,282,466–193,558,261 and chr10:134,615,120–134,741,148 in CHM13v2.0) were masked, and the three extracted 21,680-bp segments, together with the DUX4C sequence, were integrated into the masked genome to construct a custom reference.
To refine haplotype accuracy, LWGS reads from NA18943 and NA18948 were re-aligned to the custom reference with Winnowmap2, followed by variant calling using PEPPER-Margin-DeepVariant v0.8 with default settings [17]. Variants passing quality thresholds were incorporated to generate finalized haplotype-resolved sequences: DUX4C-4qα, DUX4C-4qβ, DUX4T-4qA, DUX4T-10qA, and DUX4T-B.
D4Ref-T2T genome construction and sequencing data alignment
Sequencing-error–corrected 15-kb haplotype sequences for DUX4C-4qα, DUX4C-4qβ, DUX4T-4qA, DUX4T-10qA, and DUX4T-B were incorporated into the CHM13v2.0 genome after masking the D4Z4 tandem repeat arrays and endogenous DUX4 loci (chr4:193,376,884–193,391,884; chr4:193,395,464–193,555,598; chr10:134,615,120–134,738,536). This produced a custom genotyping reference, designated D4Ref-T2T. To validate the completeness and accuracy of each haplotype sequence, LWGS reads from NA18943 and NA18948 were aligned to D4Ref-T2T using Winnowmap2 (k-mer size 20). Reads with MAPQ < 10 were removed using Samtools, and alignments were inspected in IGV v2.19.7 [18].
The D4Ref-T2T genome was then indexed and used as the reference for SWGS alignment. Reads were mapped using BWA-MEM implemented in Parabricks v4.3.2-1 under default settings, followed by MAPQ-based filtering (MAPQ < 10) using Samtools.
Genotyping of DUX4C and DUX4T haplotypes
Haplotype-specific motifs were defined for both genes. For DUX4C, two 6-bp sequences spanning rs7696384 and rs7696390 in the 3′ UTR were used to distinguish the DUX4C-4qα and DUX4C-4qβ haplotypes. For DUX4T, the canonical 6-bp PAS motif was used to identify DUX4T-4qA, and analogous 6-bp sequences at syntenic positions were used to genotype DUX4T-10qA and DUX4T-B.
Coverage of each haplotype-specific motif was calculated as the mean read depth across the six nucleotide positions:
$$}}}}\; }}\; }}=\frac_}}=1}^\,\,}}\,}}\; }}}_}}}}$$
Genotypes were inferred by computing the relative proportion of each haplotype-specific motif. For DUX4C:
$$}}}_44q\alpha }=\frac}}}_44}}}}}}}}}_44}}}}}+}}}_44}}}}}}$$
and for DUX4T:
$$}}}_44}=\frac}}}_44}}}}}}}_44}}}+}}}_410}}}+}}}_4}}}}$$
$$}}}_410}=\frac}}}_410}}}}}}}_44}}}+}}}_4T\_10}}}+}}}_4}}}}$$
Expected motif proportions for DUX4C genotypes are 1 for 4qα/4qα, 0.5 for 4qα/4qβ, and 0 for 4qβ/4qβ. Because experimental variation can shift observed values away from these theoretical ratios, we applied permissive thresholds: 0.75–1.0 for 4qα/4qα, 0.25–0.75 for 4qα/4qβ, and 0–0.25 for 4qβ/4qβ.
For chromosome 4 DUX4T, theoretical proportions are 0.5 for 4qA/4qA, 0.25 for 4qA/4qB, and 0 for 4qB/4qB. Practical threshold ranges were set as ≥0.375 for 4qA/4qA, 0.125–0.375 for 4qA/4qB, and 0–0.125 for 4qB/4qB. For chromosome 10 DUX4T, the same threshold scheme (≥0.375, 0.125–0.375, and 0–0.125) was used to classify 10qA/10qA, 10qA/10qB, and 10qB/10qB genotypes, respectively. Haplotype phasing, frequency estimation, and pairwise LD calculations were performed using Beagle.
Novel DUX4C isoform identification
Short-read RNA-seq data from Japanese LCLs stimulated with IFN-α2 for 6 h were aligned to the D4Ref-T2T reference genome using STAR v2.7.11b [19], with the following parameters: --outFilterMultimapNmax 10, --outFilterIntronMotifs None, --outSJfilterDistToOtherSJmin 0 0 0 0, and --twopassMode Basic.
Genome annotation was derived from the CHM13v2.0 GTF file but modified such that the DUX4L9 locus was updated to reflect DUX4C-4qα coordinates (12,742–14,000). Long-read RNA-seq data from IFNα2-stimulated NA18943 were mapped using FLAIR v2.2.0. Splice-junction correction was applied with flair correct using STAR-generated junctions (SJ.out.tab) and the modified GTF. Isoforms were reconstructed with flair collapse using the parameters --support 2, --filter comprehensive, and --no_gtf_end_adjustment, based on the same annotation [20]. Coding sequences and predicted amino acid sequences were generated with SQANTI3 v5.5.1 [21]. Candidate DUX4C isoforms were curated using the following criteria: a 5′ UTR longer than 50 bp; a FANTOM5 CAGE peak located within the 5′ UTR; an initiating methionine (M) codon; and the presence of a Kozak consensus sequence at the translation start site.
DUX4 expression, differential gene expression, and gene ontology enrichment analyses
The longer DUX4C isoform (DUX4C-v1) was added to the transcriptome reference (D4Trans-hg38), which was constructed on GENCODE Release 49 (GRCh38.p14) [22]. Short-read RNA-seq data were aligned to D4Trans-hg38 and quantified with Salmon v1.10.2 [23]. Transcript-level estimates from quant.sf files were converted to gene-level values, and all entries annotated as “DUX4” were combined to represent DUX4T expression using the comprehensive GTF annotation. Expression levels were normalized as transcripts per million (TPM), and differential expression analysis of DUX4C and DUX4T was conducted: breast tumors versus matched controls (n = 43 each), FSHD patients versus controls (n = 15 each), and IFNα2-stimulated LCLs versus unstimulated controls (n = 20 each). Statistical significance was assessed using the Mann–Whitney U test implemented in pandas and scipy.stats. Data visualization was carried out using seaborn and matplotlib.
Counts per million (CPM) for the DUX4C-v1 exon 2 region were obtained from samtools-derived coverage. Gene-level count matrices were imported from Salmon outputs using tximport in R. Differential gene expression (DEG) analysis was conducted with DESeq2 on IFNα2-stimulated LCLs, grouped into case samples (DUX4C: 4qα/4qα; DUX4T: 4qB/4qB; CPM > 1; n = 3) and control samples (DUX4C: 4qβ/4qβ; DUX4T: 4qA/4qA; CPM = 0; n = 3) [24]. Control samples were selected from the candidate samples (n = 9) at random using a custom Python script. Genes encoding immunoglobulins (IGH, IGK, and IGL) were removed before Gene Ontology (GO) enrichment. GO enrichment was performed with clusterProfiler using padj < 0.05 and log₂ fold change > 0.5 as thresholds. Enrichment results were processed and visualized with ggplot2 and dplyr, with annotations supplied by org.Hs.eg.db.
Ethics
This study was approved by the Ethics Committee of the Institute of Science, Tokyo (Approved No.: O2019-005-08).

Comments (0)