
Remember me
Cohort characteristics are depicted in Table 1.
Table 1 Cohort characteristicsMost of the patients showed signs of mild to moderate destruction 63.1% (n = 224). There was no significant difference in age between both groups SD 70 (20–92) years vs. MD 68 (26–91) years (p = 0.15). The laboratory findings preoperatively showed no significant differences. The CRP was 67.1 (3.4–412.4) mg/l in the SD group and 63 (2–471.1) mg/l in the MD group (p = 0.32). Leukocytes were 9.09 (2.39–23)109/L in the SD group vs. 9.13 (2.91–78.63)109/L in the MD group (p = 0.76). No significant difference was observed for preoperative Hb-levels SD 10.9(6.7–16) g/dl vs. MD 11.2(5.5–16.4) g/dl (p = 0.07). A significant difference between both groups was observed for the BMI (p = 0.001). It was higher in the MD group 26.8 (16–54.6) kg/m2 vs. the SD group 24.45 (15.4–48.9) kg/m2. Comorbidities showed no significant difference between both groups SD 1 (0–4) vs. MD 1(0–7) (p = 0.06). Pre-existing medical conditions were also evaluated. There was no statistically significant difference between both groups regarding diabetes mellitus (p = 0.61), oncologic disease (p = 0.06), immunosuppression (p = 0.21), chronic obstructive pulmonary disease (p = 0.69), rheumatic diseases (p = 0.5), heart failure (p = 0.99), chronic kidney disease (= 0.06), or osteoporosis (p = 0.73). The CCI was significantly higher in the SD group 4 (0–11) vs. 3 (0–12) (p = 0.001). No significant difference was shown for the affected segments SD 1(1–6) vs. MD 1(1–5) (p = 0.97). Significantly more patients underwent previous surgery in the MD group 23.66%(n = 53) vs. 13.74% (n = 18) (p = 0.02). There was no significant difference in the prevalence of previous injections (p = 0.19).
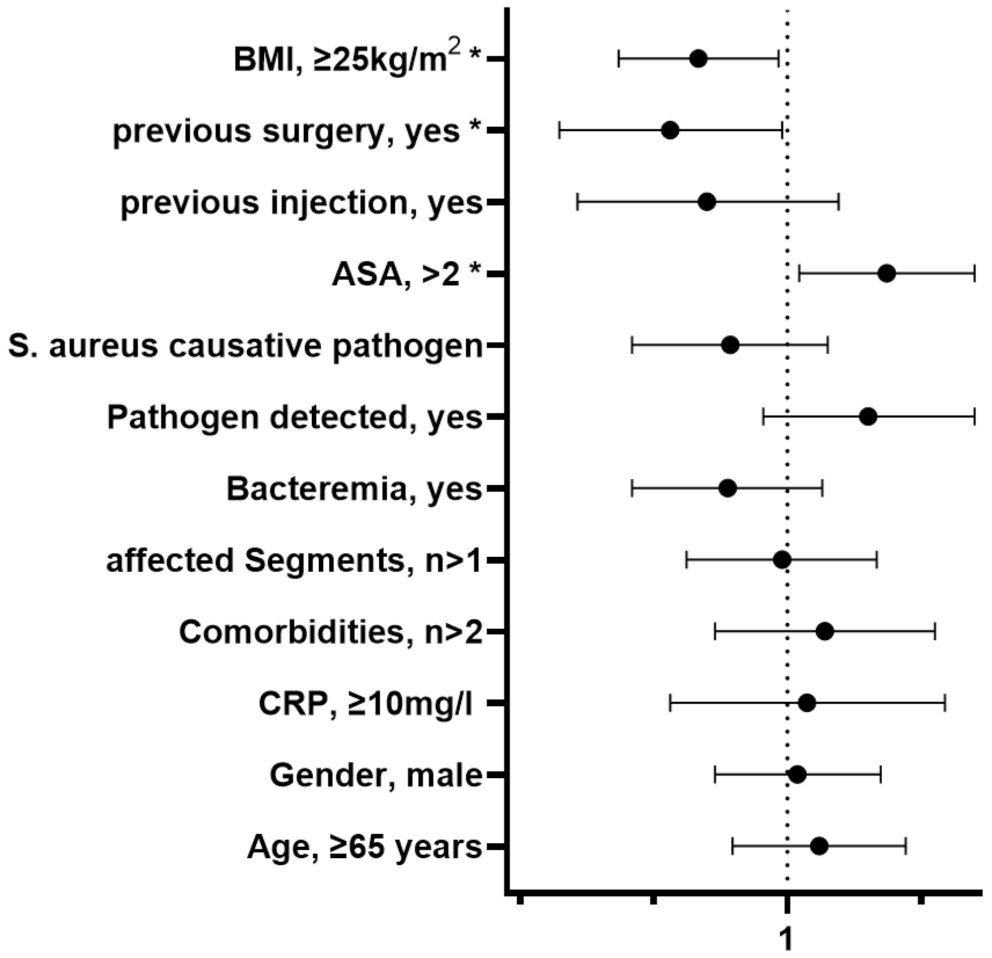
The prediction model for severe destruction with the factors age ≥ 65 years, gender (male), CRP ≥ 10 mg/L, an ASA class above two, a BMI ≥ 25 kg/m2, bacteremia, more than two comorbidities, more than one segment affected, detected pathogen, Staphylococcus aureus as pathogen, a previous injection or surgery was significant as a whole (Chi2(12) = 22.48, p = 0.032, n = 355). Model performance indicated modest explanatory power (Nagelkerke R² = 0.08). No relevant multicollinearity was detected, as all variance inflation factors (VIFs) ranged from 1.02 to 1.17.
There were three parameters significantly associated with severe destruction. An ASA score of over two (OR 1.77, 95% CI 1.07–2.93), previous surgery (OR 0.51, 95% CI 0.27–0.97) and a BMI of over 25 kg/m² (OR 0.60, 95% CI 0.38–0.95). No significant associations were observed for age over 65 years (OR 1.20, 95% CI 0.73–1.97), male gender (OR 1.06, 95% CI 0.66–1.71), CRP over 10 mg/L (OR 1.12, 95% CI 0.51–2.47), more than two comorbidities (OR 1.24, 95% CI 0.66–2.33), more than one affected spinal segment (OR 0.97, 95% CI 0.56–1.67), bacteremia (OR 0.71, 95% CI 0.41–1.22), a detected pathogen (OR 1.59, 95% CI 0.87–2.93) or Staphylococcus aureus as the causative pathogen (OR 0.72, 95% CI 0.41–1.26). The Odds-ratios are shown in Fig. 1.
Fig. 1
Odds-Ratios of the regression analysis. (BMI = Body Mass Index; American Association of Anesthesiologists risk classification, CRP = C-reactive protein)
In the SD group 28.24% (n = 37) patients had a neurological deficit, 19.85% (n = 26) had an abscess and 28.24% (n = 37) had an empyema. In the MD group 19.64% (n = 44) had a neurological deficit, 23.66% (n = 53) had an abscess and 36.16% (n = 81) had an empyema. None of these complications differed significantly between both groups (p = 0.06, p = 0.4, p = 0.13). Significantly less patients were treated operatively in the MD group 83.9% (n = 188) then in the SD group 91.6% (n = 120) (p = 0.03). The hospitalization was significantly longer for patients with severe destruction 32 (7–138) days compared to 26.5 (3–193) days (p = 0.001).
The median follow-up was 43.1 (0–4617) days. The mortality after one year was 14.5% (n = 29) in the MD group and 26.23% (n = 32) in the SD group with a significant difference between both groups (p = 0.01). Survival of both groups is shown in Fig. 2.
Fig. 2
Kaplan-Meier curve for the survival of both groups
The Log-Rank test revealed a significant difference of the survival between both groups (p = 0.001). The median survival was 142 (95%CI 125–142) months in the MD group and 72 (95%CI 47–99) months in the SD group.
Comments (0)