
Remember me
Water radiolysis is a fundamental physico-chemical process with numerous applications, including radio-sterilization (Maquille et al 2008), waste water purification (Guo et al 2008), enhancement of the microbiological safety and shelf life of food (Farkas and Mohácsi-Farkas 2011), and in radiotherapy (Chandra et al 2021).
Current research in radiotherapy focuses on developing innovative techniques such as FLASH radiotherapy (FLASH-RT) to enhance treatment outcomes and minimize radiation-induced toxicity. FLASH-RT employs ultra-high dose rate (UHDR) irradiation, typically exceeding 100 Gy·s−1, delivered in extremely short pulses (usually <200 ms). This approach has demonstrated a remarkable ability to spare normal tissue from radiation damage while maintaining equivalent tumour control probability, a phenomenon known as the FLASH effect (Favaudon et al 2014). However, the exact reason for this protective mechanism is still under debate, slowing the adoption of FLASH-RT in clinical settings. The emergence of FLASH-RT and the lack of mechanistic explanation raise questions about existing knowledge in standard radiobiology, particularly about the radiolysis of pure water at UHDR. This phenomenon may require a re-evaluation or even a rediscovery of fundamental principles in the field. Understanding these changes could be crucial for advancing both FLASH-RT and our overall grasp of radiation effects.
An initial theory proposed to account for the FLASH effect was a quick reduction in oxygen levels, but this has been tested and dismissed by several studies (Labarbe et al 2020, Boscolo et al 2021, Cao et al 2021, Jansen et al 2021, Chappuis et al 2023a). UHDR irradiations cause a short-term spike in free radicals and reactive oxygen species (ROS), potentially affecting chemical reactions. Other teams (Montay-Gruel et al 2019, Blain et al 2022, Kacem et al 2022) observed a notable drop in hydrogen peroxide (H2O2) production at UHDR compared to conventional dose rates (CDRs). This decline in H2O2 is still unexplained. Although it is assumed that radical–radical recombination might occur during UHDR, the specific reactions involved remain unknown.
In parallel, significant efforts have been made to model these phenomena from first principles. Sophisticated Monte Carlo (MC) track-structure simulations, using tools like TOPAS-nBio (Ramos-Mendez et al 2020, D-Kondo et al 2023), Geant4-DNA (Chappuis et al 2023b) and gMicroMC (Lai et al 2021), have provided invaluable insights into the ultra-fast physics and chemistry occurring in the initial nanoseconds of water radiolysis, exploring key factors like oxygen consumption and H₂O₂ yields in various media (Shin et al 2024, D-Kondo et al 2025). These ab initio models aim to build a bottom-up understanding by simulating individual particle tracks and their subsequent reactions. While these simulation studies have provided crucial insights into inter-track effects, achieving quantitative agreement with the experimentally observed decrease in H₂O₂ yield at UHDR under physioxic conditions remains an ongoing challenge. This discrepancy is largely attributed not to the simulation methodology in itself, but to the need for more refined chemical input, including specific reaction pathways and rate constants validated for the complex physioxic cellular environment. This highlights a persistent gap between first-principles simulations of early events and macroscopic experimental observations relevant to biological timescales.
The present study takes a different, complementary approach. Rather than modelling the pre-chemical and early chemical stages from scratch, a semi-empirical framework was developed. The model shortcuts the complexity of the first 100 ns by using a novel, dose-rate-dependent G-value model that is directly derived from experimental H₂O₂ measurements from the literature. By anchoring the initial chemical yields to experimental reality, this work aims to bridge the gap between simulation and experiment. The primary goal is not to re-investigate the detailed track physics, but to leverage this simplified, phenomenologically driven input to accurately propagate the homogeneous chemistry to later, biologically relevant times, thereby providing a robust platform to explore the downstream chemical consequences of UHDR irradiation.
In recent years, research groups have explored both experimental and numerical origins of the FLASH effect. On the experimental side, in vitro and in vivo studies conducted on small animals involve complex living models with many constraints and parameters to consider. This is where the advantages of numerical models come into play as they are not bound by ethical committee approvals or dependent on living materials, enabling the parallel testing of multiple hypotheses. However, these approaches are oversimplified versions of reality. Compromises are necessary, and translating their findings to experimental results remains challenging. Nonetheless, numerical models offer the opportunity to analyse and understand mechanisms that cannot be measured experimentally. In this frame, particle-induced water radiolysis simulations use two primary methods. The first employs MC codes (Watanabe and Saito 2001, Kreipl et al 2009, Karamitros et al 2014, Boscolo et al 2020, Alanazi et al 2021, Lai et al 2021, Hu et al 2022) to examine the physics of particle–water interactions and their chemical consequences. This method provides intricate details at the first moments of irradiation but is limited to brief durations, typically not extending beyond a few microseconds or tens of microseconds.
The second approach seeks to address the time range limitation, allowing computations over a relevant biochemical range (µs–s). Some methods reuse MC simulation outputs focused on very specific parts of the global chemistry (Colliaux et al 2011, Meesat et al 2012), while others employ conventional chemical reactions, utilizing ordinary differential equations (ODEs) (Labarbe et al 2020, Domnanich and Severin 2022, Tan et al 2023) to model radiolysis. An advantage of the latter is that it allows the effect of the initial oxygen content to be studied, as O2 can be modelled without assuming that it is an inexhaustible reservoir, as most MC codes do. Advanced numerical solvers can now process dozens or even hundreds of reactions, allowing them to predict concentration changes over periods up to several hours (Domnanich and Severin 2022, Tan et al 2023). However, a main limitation of these methods is the lack of spatial resolution, as the system is treated as uniform. Because they presuppose uniformity, the early moments of irradiation are not accurately represented and only the homogeneous chemical processes are considered, which typically start between 100 ns and 1 µs after irradiation.
The aim of this study is therefore to introduce and validate a unified ODE-based model that elucidates the complex chemistry of pure-water radiolysis under CDR and UHDR irradiation across various oxygen levels. The primary novelty of this work is the development of a single simulation framework capable of simultaneously predicting three cornerstone observations relevant to the FLASH effect:
1.
The experimentally observed decrease in net H₂O₂ production at UHDR under physioxic conditions.
2.
A marked decrease in H₂O₂ production at UHDR compared with CDR in physioxic (normal-tissue-like) environments.
3.
Comparable H₂O₂ production at both UHDR and CDR under hypoxic (tumour-like) conditions, consistent with the iso tumour control probability seen in FLASH experiments.
To achieve this, the temporal evolution of key species such as H₂O₂, O₂, and the primary drivers of pH dynamics, H₃O+ and OH−, are specifically tracked. Validation of the framework is demonstrated by its ability to reproduce these critical findings, which is made possible by anchoring the simulation with a novel, empirically derived, dose-rate dependent G-value coefficient (GF(DR)) This work thus provides a new tool to investigate the downstream chemical mechanisms that may support the differential biological response of the FLASH effect.
2.1. The hydrogen peroxide paradoxExisting research has yielded inconsistent findings regarding the relationship between dose rate and H₂O₂ production in pure water. Notably, simulation studies (Derksen et al 2023, Shin et al 2024, Zhang et al 2024) have contradicted experimental observations (Montay-Gruel et al 2019, Blain et al 2022, Kacem et al 2022, Sunnerberg et al 2023, Zhang et al 2024) that suggest a decrease in H₂O₂ production under UHDR conditions. Consequently, the impact of UHDR on H₂O₂ yield relative to conventional irradiation remains unclear.
A significant challenge in reconciling these findings is that experimental quantification of H₂O₂ in irradiated water requires the addition of chemical probes. This approach introduces a confounding factor: the probes and their required co-factors (e.g. enzymes) are added to the system, meaning the chemistry is no longer that of ‘pure water’. These added compounds may interact with transient radiolytic species, which could alter the chemical kinetics and temporal evolution that they are intended to measure. The two most common chemical probes used to measure the production of H2O2 are Amplex Red and Ghormley triiodide. The Amplex Red assay, in which 10-acetyl-3,7-dihydroxyphenoxazine reacts 1:1 with H2O2 in the presence of horseradish peroxidase (HRP) enzyme, produces the fluorescent compound resorufin. In the Ghormley Triiodide method H2O2 reacts with iodide ions (I−) to form triiodide ions (I3−), which are quantified via light absorbance. Given that these two assays rely on fundamentally different chemical pathways, the probe choice may be a major, and perhaps underappreciated, source of the variability in reported H₂O₂ yields.
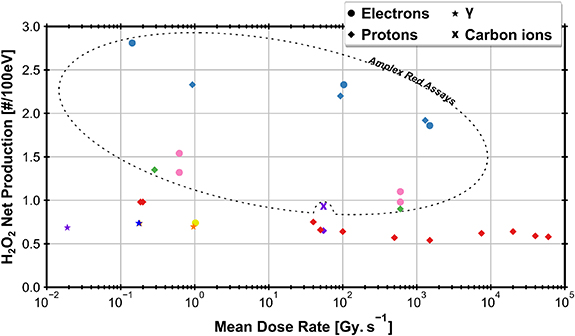
The studies of the last 50 years, focusing on H2O2 production in pure water upon irradiation have been compiled in table 1. Indications about radiation types, linear energy transfer (LET), oxygen level in water prior to irradiation as well as the H2O2 probing method used are listed. The coloured squares serve as legend for figure 1.
Figure 1. Experimental net production of H2O2 (at end of irradiation), expressed with G-values unit, in pure water reported in literature. Corresponding colours are reported in table 1.
Download figure:
Standard image High-resolution imageTable 1. Published experimental works reporting H2O2G-values in pure water.
ReferenceRadiation typeLET (keV·µm−1)H2O2 probe methodOxygen (% pO2)Kacem et al (2022) Electrons0.6Amplex Red4%Protons0.4Montay-Gruel et al (2019)
 Electrons0.6Amplex Red4%Zhang et al (2024)
 Electrons0.6Amplex UltraRed0.1% 21%Blain et al (2022)
 Protons1.17Ghormley triiodideAerated waterSehested et al (1968)
 Electrons0.4Home madeAerated waterRoth et al (2011)
 Gamma0.21Ghormley triiodideAerated waterStefanic et al (2002)
 Gamma0.21Ghormley triiodideAerated waterRafi et al (1965)
 Gamma0.21Ghormley triiodideAerated waterTrupin et al (2002)
 Gamma0.53Chemiluminescence calibrated with Ghormley triiodideDeaerated waterProtons2.5Carbon30
In figure 1, all data available in the studies reported in table 1 are translated in G values units i.e. expressed as #/100 eV ( ). All data were consolidated to utilize a unified mean dose rate (
 ) formula using the same beam structure conventions as (Tobias Bohlen et al 2024):

where Dbeam represents the total dose (Gy), Tbeam is the total beam-on time (s), #pulse denotes the number of pulses, DPP is the dose per pulse (Gy), tpulse the pulse duration (s) and Δtpulse the time duration in between two consecutive pulses.
From this figure, the two experimental protocols for quantifying H2O2 form two clusters with noticeable differences. All Amplex Red based data points have 58% to 263% higher yields than the others. The only exception is the data point corresponding to carbon ion beam at 55 Gy·s−1. However, this data point is the only one from the data set with a high LET of 30 keV·µm−1, much higher than the others (⩽2.5 keV·µm−1). At such high LET, intertrack effects, which are outside the low-LET scope of this study, are known to alter radical recombination kinetics and reduce the net H₂O₂ yield, thus explaining its deviation from the other measurements (Ramos-Mendez et al 2020). Based on this observation, the present study focused on data measured without Amplex Red and is restricted to the one of Blain et al (2022). Indeed, the latter is the only study to have experimentally measured the production of H2O2 over a broad range of mean dose rates. Moreover, despite using a cyclotron (inherently pulsed with MHz micro-structure), the authors have performed all UHDR irradiations with a single macro pulse. Finally, gamma-based data are not included as the LET used by Blain et al (2022) is one order of magnitude larger.
2.2. The simulation softwareLabarbe et al (2020) demonstrated the feasibility of integrating published G-values from MC codes to set up initial conditions that are subsequently processed by another approach using an ODE solver. The methodology applied in this paper uses published data from MC code (Boscolo et al 2020) as input for a custom Python code that solves a system of ODEs.
The time-dependent differential equations describing the evolution of n chemical species xi can be written as:

where i =1,…n;  is the production term (µM·s−1) of the species i;
  is the consumption term (µM·s−1) of the species i and Ri(t) is the radiolytic production term defined by:

where  is the G-value (#/100 eV), at 100 ns, of the species i from MC simulations (literature) for CDR;
  is the instantaneous dose rate (Gy·s−1);
  is the dimensionless dose rate dependent coefficient (‘G-factor’) introduced in this study;
  is the density (kg·l−1) of the considered medium (water in this study); D the deposited dose (Gy) during dt; e the elementary charge and NA the Avogadro’s constant.
Numerous methods are available for solving such set of differential equations. However, in the specific case of chemical kinetics, this problem is defined as a stiff system. The main issue of numerical methods for ODE’s stiff system solution is the numerical stability. Fortunately, there are efficient ODE solvers suitable for stiff problems. One of them is the LSODA solver (Petzold 1983). LSODA differs from the other integrators in that it can switch automatically between stiff and non-stiff methods. There is then no need to assess the stiffness in advance as the solver will automatically switch to the appropriate method. LSODA always starts with the non-stiff method. When stiffness is detected in the solution, the solver backtracks to switch the resolution method and adapt the time step so that quick variations of the solution can be resolved. This method is particularly well suited for the chemical kinetics of water radiolysis, as one can expect discontinuities in the chemical kinetics when beam is switched ON and OFF. This solver is made available in the Python environment via the scipy module (Virtanen et al 2020). In this work, the radiolysis model, developed with Python 11.9, wraps the LSODA solver and builds the chemical environment out of a TOML configuration file listing all reactions detailing the radiolysis (see table 2). The kinetics of the homogeneous chemistry phase related to pure water radiolysis is described by the set of the elementary reactions given in table 2.
Table 2. List of all chemical reactions included in the model. Reaction rates are mainly from (A) (Domnanich and Severin 2022), (B) are rates from (Joseph et al 2008), (C) are rates from (Labarbe et al 2020) and (D) are rates from (Buxton et al 1988). All reaction rate constants correspond to a water temperature of 25 °C.
#ReactionRate constant #ReactionRate constant 1 5.50 × 10⁹(B)38
 6.00 × 10⁹(A)2
 2.76 × 10¹⁰(A)39
 5.00 × 10⁸(A)3
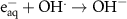 3.00 × 10¹⁰(B)40
 6.00 × 10⁸(A)4
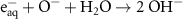 2.20 × 10¹⁰(A)41
 0.3(A)5
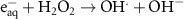 1.10 × 10¹⁰(C)42
 0.13(A)6
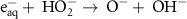 3.50 × 10⁹(A)43
 0.13(A)7
 1.90 × 10¹⁰(C)44
 1.00 × 10⁴(A)8
 1.30 × 10¹⁰(A)45
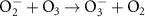 1.50 × 10⁹(A)9
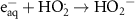 1.30 × 10¹⁰(A)46
 1.00 × 10⁹(A)10
 1.60 × 10¹⁰(A)47
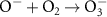 3.75 × 10⁹(A)11
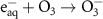 3.60 × 10¹⁰(A)48
 1.28 × 10⁸(A)12
 2.20 × 10⁷(D)49
 5.00 × 10⁸(A)13
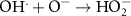 2.50 × 10¹⁰(A)50
 7.86 × 10⁸(A)14
 7.50 × 10⁹(C)51
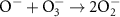 7.00 × 10⁸(A)15
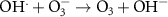 2.60 × 10⁹(A)52
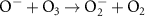 5.00 × 10⁹(A)16
 6.00 × 10⁹(A)53
 2.62 × 10³(A)17
 1.10 × 10⁸(A)54
 9.00 × 10¹⁰(A)18
 1.09 × 10¹⁰(A)55
 1.10 × 10⁵(A)19
 5.50 × 10⁹(C) Acid Base related reactions 20
 3.95 × 10⁷(A)56
 1.33 × 10¹⁰(A)21
 8.84 × 10⁹(A)
Comments (0)