
Remember me


The demographic profile of 249 patients with ALKpos mNSCLC who met our inclusion criteria is shown in Table 1. The median age of the cohort was 53 years. Fifty-eight percent (145/249) of patients were male and 42% (104/249) were female. Most of the patients (208/249, 84%) were non-smokers. At baseline, 28% (69/249) of the patients had an Eastern Cooperative Oncology Group (ECOG) performance score (PS) score of 2–4.
Table 1 Baseline characteristics the study population of the entire cohort and the sub-cohort who received treatment beyond 2nd lineDisease CharacteristicsMost of the patients had adenocarcinoma histology (220/249, 88%), and 80% were thyroid transcription factor 1 (TTF1)-positive on IHC (199/249).
PDL1 status was available for 53% (133/249) of the patients, and 36.8% (49/133) had PDL1 expression of less than 1%.
Most of the patients had extrathoracic metastases on diagnosis (203/249, 82%). Thirty-seven percent (93/249) of patients had brain metastasis at diagnosis and a further 31% (49/156) developed one during their disease course.
Genomic ProfileMolecular profiling (including ALK variant analysis) using an NGS panel was done for 66% (163/249) of the cohort. The remaining patients underwent single-gene testing. The entire NGS profile of patients with available data and selected clinical features is shown in an Oncoplot (Supplemental Fig. 2).
Treatment and OutcomesMost patients (217/249, 87%) received an ALK-directed TKI in the 1st-line and nearly half of the patients received newer-gen TKIs (2nd-gen 32% and 3rd-gen 17%). The number of patients opting for 3rd-gen TKI increased yearly (Fig. 1). At the time of data cut-off, 34% (85/249) patients were continuing their 1st-line treatment, including 40 of the 42 patients who were started on lorlatinib. Sixty-two percent (155/249) of patients had progression on 1st-line therapy and 13.6% (34/249) of patients did not take subsequent treatment. Similarly, of the patients who progressed on 2nd-line, 3rd-line, and 4th-line treatment, 35.4% (33/93), 55.1% (27/49), and 40% (6/15) did not take further treatment respectively (Supplemental Fig. 3).
Fig. 1
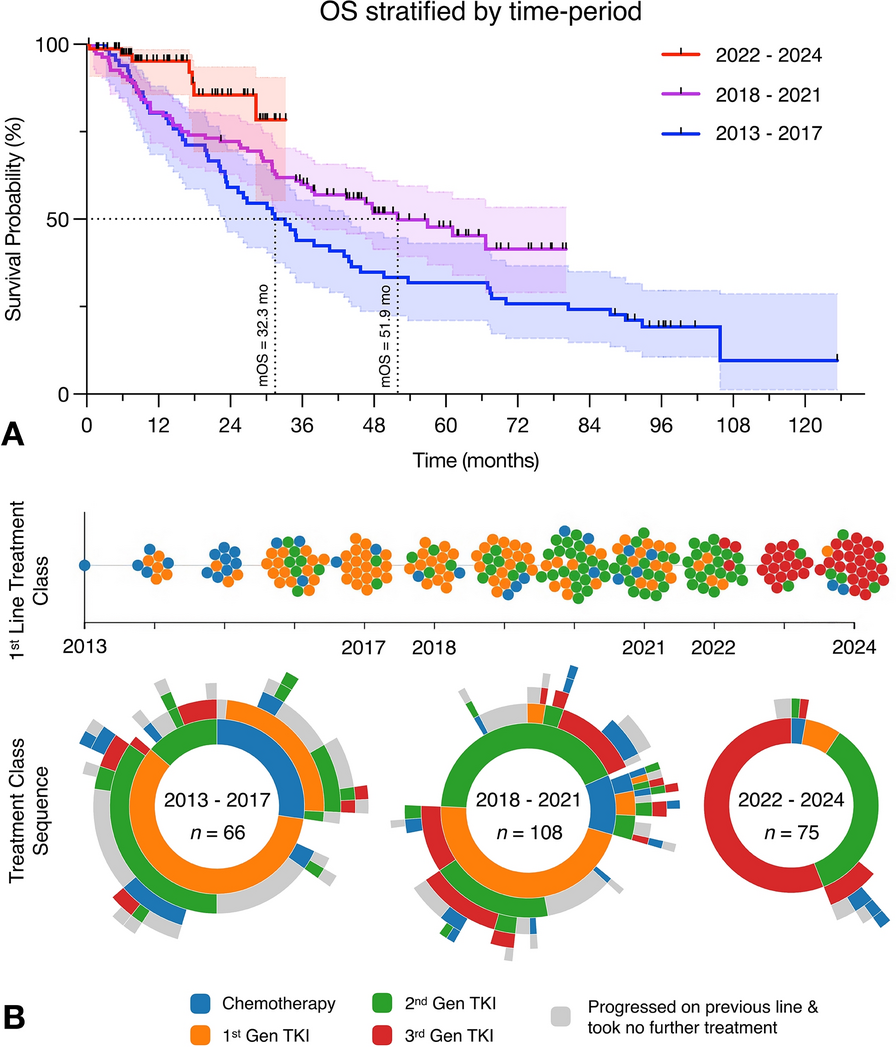
Overall survival stratified by time period and treatment trends. a Kaplan–Meier curves showing overall survival (OS) stratified by time period. b Evolution of 1st-line treatment class and treatment sequencing over time. The top section displays 1st-line treatment classes by year, with dots coloured according to treatment type. Each dot on the bee swarm plot represents an individual patient. The bottom section illustrates treatment class sequences for each time period cohort (2013–2017, 2018–2021, and 2022–2024) with sunburst plots. Lines of treatment are represented by circles with the innermost circle showing 1st-line treatment and the next circle outward showing 2nd-line treatment. TKI tyrosine kinase inhibitors
Thirteen percent (32/249) of patients received chemotherapy upfront and subsequent-line uptake was similarly low (2–8%) (Supplemental Fig. 1).
Median follow-up for the entire cohort was 48 months (IQR 26.2–74.3). Median OS was 46.6 months (95% CI 36.9–67.0) and PFS 1 was 18.2 months (95% CI 14.5–26.8). PFS 2 and PFS 1 + 2 were 9.1 months (95% CI 6.7–11.6) and 33.1 months (95% CI 28.6–41.6), respectively (Fig. 2).
Fig. 2
Kaplan–Meier survival curves illustrating the primary endpoints of the analysis. Overall survival (OS) and progression-free survival (PFS) on the 1st-line (PFS 1), 2nd-line (PFS 2), and combined 1st- and 2nd-lines of treatment (PFS 1 + 2)
Univariable AnalysisResults of selected univariable analyses are shown in Fig. 3. Detailed results are provided in Supplemental Table 1. Most of the demographic (including sex) or tumour-related features did not demonstrate a consistent effect on PFS1, PFS2, and PFS1 + 2. Patients with adenocarcinomas [vs other histology: HR (PFS2) 0.32, 95% CI 0.17–0.59, p < 0.001; HR (PFS1 + 2) 0.54, 95% CI 0.32–0.92, p = 0.024] and TTF1-positive tumours [vs TTF1-negative: HR (PFS2) 0.23, 95% CI 0.11–0.47, p < 0.001; HR (PFS1 + 2) 0.61, 95% CI 0.35–1.08, p = 0.088] experienced improved PFS2 and PFS1 + 2, while the presence of extrapulmonary metastases was detrimental [vs absent: HR (PFS2) 1.82, 95% CI 1.02–3.25, p = 0.042; HR (PFS1 + 2) 1.88, 95% CI 1.10–3.21, p = 0.020]. Patients with worse ECOG PS [2–3 vs 0–1: HR 1.75, 95% CI 1.14–2.71, p = 0.011] and higher PDL1 expression [50–100% vs < 1%, HR 2.44, 95% CI 1.08–5.54, p = 0.033] died earlier, while those with adenocarcinomas [vs other histology: HR 0.55, 95% CI 0.33–0.92, p < 0.022] and TTF1-positive tumours [vs TTF1-negative: HR 0.52, 95% CI 0.31–0.87, p = 0.033] survived longer. No significant associations with genomic profile and clinical outcomes were found in our analysis.
Fig. 3
Selected Kaplan–Meier survival analyses stratified by treatment classes and clinical characteristics. a Overall survival (OS) stratified by the class of 1st-line treatment. b Progression-free survival on 1st-line treatment (PFS 1) stratified by 1st-line treatment class. c OS stratified by thyroid transcription factor 1 (TTF1) expression. d Progression-free survival on 2nd-line treatment (PFS 2) stratified by the class of 2nd-line treatment. e OS stratified by histology. f Cumulative incidence of intracranial progression stratified by 1st-line treatment class
Influence of Sequence of TKIs (1st vs 2nd vs 3rd Generation) on OutcomesCompared to 1st-gen TKIs, newer-gen TKIs (2nd-gen and 3rd-gen) significantly improved PFS1 when given as 1st-line treatment (2nd-gen and 3rd-gen vs 1st-gen: HR 0.37, 95% CI 0.25–0.55, p < 0.001; HR 0.08, 95% CI 0.02–0.33, p < 0.001, respectively) (Fig. 3), while only 3rd-gen TKIs improved PFS2 when administered as 2nd-line treatment. Combined progression-free survival on the first two lines of treatment (PFS 1 + 2) was better when 2nd-gen and 3rd-gen TKIs were administered either in 1st-line or 2nd-line treatment, compared to 1st-gen TKIs.
Sequencing strategies also influenced PFS1 + 2. Compared to the sequence of 1st-gen TKI → 2nd-gen TKI, administering a 3rd-gen TKI after progression on either a 1st-gen or 2nd-gen TKI improved PFS1 + 2 (1st-gen → 3rd-gen and 2nd-gen → 3rd-gen vs 1st-gen → 2nd-gen: HR 0.24, 95% CI 0.09–0.69, p < 0.001; HR 0.49, 95% CI 0.25–0.93, p = 0.030, respectively). Administration of newer-gen TKIs significantly improved OS when given as 1st-line treatment (2nd-gen and 3rd-gen vs 1st-gen: HR 0.63, 95% CI 0.41–0.97, p = 0.038; HR 0.13, 95% CI 0.02–0.94, p = 0.043, respectively), while only 3rd-gen TKIs improved OS when administered as 2nd-line treatment (3rd-gen vs 1st-gen: HR 0.37, 95% CI 0.19–0.73, p = 0.004). Administering a 3rd-gen TKI after progression on 1st-gen TKI also improved OS (3rd-gen vs 1st-gen: HR 0.37, 95% CI 0.19–0.73, p = 0.004), even in those who received it after progressing on two prior lines of treatment (3rd-gen vs 1st-gen: HR 0.37, 95% CI 0.19–0.73, p = 0.004) (Supplemental Table 1).
The temporal effect of changing treatment practices also significantly improved OS (Fig. 1). Median OS of patients starting treatment between 2013 and 2017 was 32.3 months and increased to 51.9 months for the patients who started treatment between 2018 and 2021. Median OS was not reached for those patients who started treatment from 2022 onwards (when 3rd-gen TKI became available for 1st-line in our region). The median lines of delivered treatments significantly reduced when 3rd-gen TKIs were used [2022–2024 vs 2013–2017: 1 (1–1) vs 2 (1–3), p < 0.001].
Brain Metastases OutcomesNone of the patients who received 3rd-gen TKIs as 1st-line treatment developed brain metastases (Fig. 3). On multivariable logistic regression (Supplemental Table 2), the risk of developing brain metastases in the 2022–2024 period was the lowest (vs 2013–2017: OR 0.03, 95% CI 0.004–0.226, p = 0.001) and the only significant variable in the model.
Multivariable AnalysesThe presence of extrapulmonary metastases was detrimental to all outcomes (PFS1, PFS2, and PFS1 + 2: HR 1.63, 95% CI 1.01–2.62, p = 0.046; HR 2.11, 95% CI 1.14–3.93, p = 0.018; HR 2.63, 95% CI 1.49–4.65, p < 0.001, respectively), while TTF1 positive tumours improved outcomes (PFS2, PFS1 + 2: HR 0.23, 95% CI 0.11–0.49, p < 0.001; HR 0.32, 95% CI 0.17–0.60, p < 0.001, respectively) (Supplemental Fig. 4). Older age was associated with a mildly reduced risk of PFS1 (HR 0.98, 95% CI 0.96–0.99, p = 0.011); however, this effect was not consistent across other outcomes. There was no association between outcomes and sex of the patients.
As expected, the choice of treatment class significantly influenced outcomes. Newer-gen TKIs significantly improved PFS1 (2nd-gen and 3rd-gen: HR 0.31, 95% CI 0.20–0.48, p < 0.001; HR 0.08, 95% CI 0.02–0.32, p < 0.001, respectively), PFS2 (3rd-gen: HR 0.36, 95% CI 0.17–0.74, p = 0.005) and PFS1 + 2 (2nd-gen and 3rd-gen: HR 0.46, 95% CI 0.26–0.81, p = 0.008; HR 0.19, 95% CI 0.09–0.38, p < 0.001, respectively) compared to 1st-gen TKIs. As a result of the diverse treatment sequences from 1st-line → 2nd-line treatments, this variable could not be included in the Cox proportional hazards model.
Joint Frailty ModellingThere was a strong association between repeated progression events and mortality, as indicated by the significant shared frailty parameter (theta = 1.78, p < 0.001) (Fig. 4). With time, the baseline hazard for disease progression rises steadily, whereas the hazard for death gradually increases after an initial lag (Supplemental Fig. 5). The baseline risk of progression was also heterogeneous between patients (eta = 0.01, p < 0.001), as a result of non-observed covariates.
Fig. 4
Results of joint frailty modelling
Amongst the variables included in our model, the presence of extrapulmonary metastases significantly worsened progression risk (HR 2.67, 95% CI 1.54–4.64, p = 0.001), while its influence on mortality (HR 1.98, 95% CI 0.99–3.98, p = 0.054) was close to significance. Patients with worse ECOG performance (2–3 vs 0–1: HR 2.04, 95% CI 1.28–3.26, p = 0.003) had a higher risk of death.
Treatments received at any line were included as a time-varying covariate in the progression model and therefore they were not included in the survival model, a choice which was justified by the strong association between the two event processes. Alectinib (HR 0.53, 95% CI 0.33–0.84, p = 0.007) and lorlatinib (HR 0.49, 95% CI 0.31–0.77, p = 0.002) were each associated with substantially lower risk of progression compared to crizotinib. In contrast, patients who received chemotherapy in any line exhibited a higher risk of progression (HR 2.83, 95% CI 1.92–4.18, p < 0.001).
Comments (0)