
Remember me
Type 2 diabetes mellitus (T2DM) is rising globally, with a disproportionate burden in low- and middle-income countries. The 10th-edition International Diabetes Federation (IDF) Atlas estimates that approximately 589 million adults were living with diabetes in 2024 and projects an increase to about 853 million by 2050, highlighting the urgency for improved early detection and risk-stratification strategies 1. Within India, nationally representative data from the ICMR–INDIAB study indicate an overall diabetes prevalence of 11.4 %, equating to roughly 101 million people with diabetes and another 136 million with pre-diabetes—an epidemiologic landscape that demands sensitive biomarkers linked to metabolic control and complications 2.
In parallel with this epidemiologic surge, there is growing recognition that bone functions as an active endocrine organ that interfaces with systemic energy homeostasis. Recent evidence underscores a bone–energy-metabolism crosstalk, wherein osteoblast- and osteocyte-derived factors influence glucose utilization and lipid handling in peripheral tissues 3,4. This paradigm recasts skeletal biology not merely as a passive target of metabolic disease but as a regulatory hub capable of providing biomarkers for metabolic-risk assessment and informing novel therapeutic interventions in T2DM 3,4.
Among bone-derived signals, osteocalcin (OC)—particularly its undercarboxylated form (ucOC)—has emerged as a hormone with metabolic effects, enhancing pancreatic β-cell proliferation, stimulating insulin secretion, and improving insulin sensitivity in skeletal muscle and adipose tissue 5,6. Both human and experimental studies support these roles; however, the magnitude and clinical utility of osteocalcin–glycaemia associations vary across populations and cardiometabolic conditions, underscoring the need for population-specific investigations to ascertain its translational relevance, particularly in regions with a dual burden of T2DM and metabolic-bone disturbances 5,6.
Vitamin D is likewise a key endocrine regulator with wide-ranging effects on glucose and lipid metabolism. Observational studies consistently link lower serum 25-hydroxyvitamin D [25(OH)D] levels with higher insulin resistance and adverse lipid profiles 7. Meta-analytical evidence further suggests that vitamin D supplementation can lower fasting glucose, HbA1c, HOMA-IR, and fasting insulin in patients with T2DM, especially in those who are deficient or poorly controlled 8. In India, vitamin D deficiency is highly prevalent, with studies documenting > 50 % deficiency in both urban and rural cohorts, underlining its relevance to metabolic-risk evaluation 9,10,11.
Parathyroid hormone (PTH), intricately linked to calcium–phosphate balance and vitamin D status, may also contribute to energy regulation. Clinical evidence suggests that higher PTH levels are associated with worse glycaemic indices, β-cell stress, and insulin resistance 12. Yet, PTH is seldom examined alongside osteocalcin and vitamin D in relation to both glycaemic and lipid parameters—particularly in South-Asian cohorts, where the combination of diabetes, vitamin D deficiency, and dyslipidaemia is disproportionately high 2,9.
Despite the growing body of literature on individual endocrine axes, an integrative analysis that simultaneously evaluates osteocalcin, vitamin D, and PTH in the context of T2DM remains scarce. Examining their combined relationships with both glycaemic-control parameters (fasting plasma glucose, HbA1c) and lipid variables (triglycerides, LDL-C, HDL-C, and total cholesterol) is particularly relevant for Indian populations, where multiple metabolic derangements converge. By quantifying these endocrine markers concurrently, the present study aims to (i) delineate the bone–mineral–metabolic interface in T2DM, (ii) identify clinically tractable biomarkers that complement conventional indices, and (iii) generate population-specific evidence that could support early detection and enhanced risk-stratification strategies in diabetes care 1,2,3,4,5,6,7,8,9,10,11,12.
Materials and MethodsStudy Design and SettingThis cross-sectional study was conducted within the Faculty of Medicine and the Department of Medical Biochemistry, Index Medical College, Hospital and Research Centre, Indore, Madhya Pradesh, India, for a 12-month period extending from January 2023 to January 2024. Participants were recruited from the diabetes outpatient clinic, together with age- and sex-matched community or clinic controls during the same interval. Consecutive, eligible individuals with type 2 diabetes mellitus (T2DM) were approached for inclusion, and controls were enrolled to mirror the case distribution with respect to age and sex. A STROBE flow diagram (Figure 1) summarises participant screening, exclusions, and the final analytic sample 13.
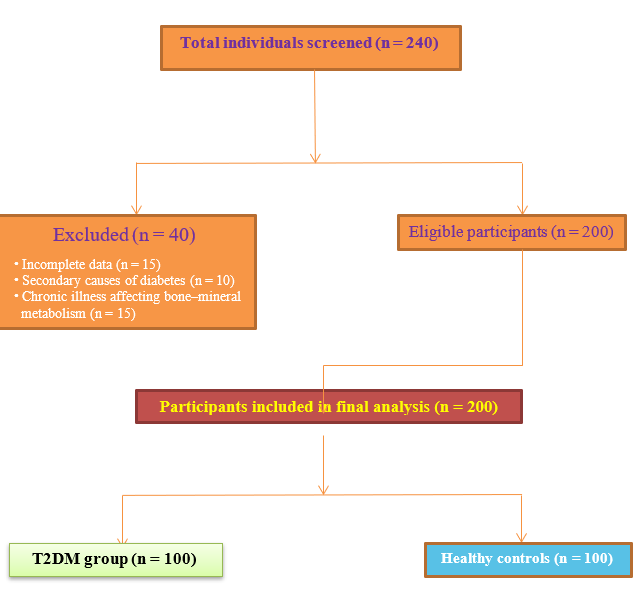 Figure 1
STROBE flow diagram showing screening, exclusion, and final inclusion of study participants.
Table 1Baseline demographic distribution of study participants
VariableT2DM Group (n=100)Control Group (n=100)Statistical Testp-valueAge ≤50 years25 (25%)25 (25%)χ²=7.6700.022*Age 51–60 years58 (58%)70 (70%) Age >60 years17 (17%)5 (5%) Mean Age (years)55.09 ± 5.3954.26 ± 4.93t=1.1350.258Gender (Male)38 (38%)38 (38%)χ²=0.0001.000Gender (Female)62 (62%)62 (62%) Table 2Comparison of glycemic parameters between study groups
ParameterT2DM Group (Mean ± SD)Control Group (Mean ± SD)Test Used95% CI of Mean Differencep-valueFBS (mg/dL)147.2 ± 72.586.0 ± 17.0t = 8.20247.9 – 74.50.000 ***PPBS (mg/dL)338.4 ± 74.4127.8 ± 19.6t = 22.34190.1 – 230.60.000 ***HbA1c (%)7.22 ± 1.405.38 ± 0.94t = 9.231.48 – 2.080.000 ***Table 3Comparison of lipid parameters between study groups
ParameterT2DM Group (Mean ± SD)Control Group (Mean ± SD)Test Used95% CI of Mean Differencep-valueTotal Cholesterol (mg/dL)311.9 ± 61.7219.4 ± 57.1t = 10.1774.5 – 110.50.000 ***Triglycerides (mg/dL)163.3 ± 36.9124.6 ± 35.0t = 7.0428.4 – 49.00.000 ***LDL-C (mg/dL)243.2 ± 63.5157.7 ± 52.3t = 9.8166.4 – 104.60.000 ***HDL-C (mg/dL)36.4 ± 9.437.0 ± 11.5t = 0.42–3.2 to 2.00.674Table 4Comparison of endocrine biomarkers between study groups
BiomarkerT2DM Group (Mean ± SD)Control Group (Mean ± SD)Test Used95% CI of Mean Differencep-valueOsteocalcin (ng/mL)4.64 ± 1.47.26 ± 2.5t = 8.14–3.22 to –1.980.000 ***Vitamin D3 (ng/mL)30.35 ± 0.436.90 ± 7.8t = 6.17–8.52 to –4.580.000 ***PTH (pg/mL)70.18 ± 32.838.4 ± 19.8t = 8.3224.8 – 38.90.000 ***Table 5Distribution of biomarker categories between study groups
BiomarkerCategoryT2DM GroupControl Groupp-valueOsteocalcin<3.7 ng/mL22 (22%)10 (10%)0.018* 3.7–10.0 ng/mL78 (78%)87 (87%) >10.0 ng/mL0 (0%)3 (3%)Vitamin D3<20 ng/mL15 (15%)0 (0%)<0.001*** 20–50 ng/mL79 (79%)93 (93%) >50 ng/mL6 (6%)7 (7%)PTH11–65 pg/mL51 (51%)87 (87%)<0.001*** >65 pg/mL49 (49%)12 (12%) Table 6Comparison of variables across osteocalcin categories in the T2DM group
VariableOsteocalcin <3.7 ng/mL (Mean±SD)Osteocalcin 3.7–10.0 ng/mL (Mean±SD)F-valuep-valueFBS (mg/dL)126.7 ± 44.0152.9 ± 78.02.2600.136PPBS (mg/dL)332.6 ± 67.0340.0 ± 76.00.1650.685HbA1c (%)7.27 ± 1.67.21 ± 1.40.0250.874Total Cholesterol (mg/dL)333.8 ± 68.0305.7 ± 58.03.6320.060Triglycerides (mg/dL)160.4 ± 26.1164.1 ± 39.00.1700.681LDL-C (mg/dL)263.3 ± 72.0237.5 ± 59.02.8670.094HDL-C (mg/dL)38.8 ± 0.035.7 ± 9.01.8470.177Vitamin D3 (ng/mL)30.3 ± 9.230.3 ± 10.80.0010.995PTH (pg/mL)64.9 ± 34.571.6 ± 32.40.7050.403Table 7Comparison of variables across vitamin D3 categories in the T2DM group
VariableVit. D3 <20 ng/mL (Mean±SD)Vit. D3 20–50 ng/mL (Mean±SD)Vit. D3 >50 ng/mL (Mean±SD)F-valuep-valueFBS (mg/dL)169.9 ± 84.0145.0 ± 72.0118.6 ± 24.01.2400.294PPBS (mg/dL)353.2 ± 85.0335.8 ± 73.0335.3 ± 68.00.3430.710HbA1c (%)9.3 ± 1.16.9 ± 1.15.3 ± 0.538.7<0.001***Total Cholesterol (mg/dL)317.6 ± 51.9314.1 ± 61.9268.3 ± 75.31.6310.201Triglycerides (mg/dL)160.9 ± 20.6165.3 ± 39.8142.5 ± 9.81.1100.334LDL-C (mg/dL)248.8 ± 53.0245.2 ± 63.0202.8 ± 78.01.3210.272HDL-C (mg/dL)37.1 ± 11.536.2 ± 8.937.3 ± 11.70.0900.914PTH (pg/mL)117.6 ± 30.864.9 ± 34.571.6 ± 32.425.3<0.001***Table 8Comparison of variables based on PTH categories in the T2DM group
VariablePTH ≤65 pg/ml (Mean±SD)PTH >65 pg/ml (Mean±SD)p-valueFBS (mg/dL)132.9±35.8162.0±95.20.044*HbA1c (%)6.25±0.718.23±1.3<0.001**Vitamin D3 (ng/ml)36.6±9.723.7±6.2<0.001**Lipid profileNSNS>0.05Osteocalcin (ng/ml)NSNS>0.05Table 9Distribution of variables according to Vitamin D3 categories in the T2DM group
Variable<20 ng/ml (Mean±SD)20–50 ng/ml (Mean±SD)>50 ng/ml (Mean±SD)p-valueHbA1c (%)9.3±1.16.9±1.15.3±0.5<0.001**PTH (pg/ml)117.6±30.871.6±32.464.9±34.5<0.001**Osteocalcin (ng/ml)NSNSNS0.781Table 10PTH distribution across osteocalcin categories in the T2DM group
Osteocalcin Category (ng/ml)Normal PTH (11–65 pg/ml)High PTH (>65 pg/ml)p-value<3.7X patients (%)Y patients (%)0.1793.7–10.0X patients (%)Y patients (%)0.179>10.0NoneNone–Table 11Correlation of glycemic and biochemical parameters in T2DM group
Variable Pairr-valuep-value FBS vs TG0.2380.017* HbA1c vs Blood urea-0.2210.027* HbA1c vs Creatinine-0.2010.045* HbA1c vs Vitamin D3-0.748<0.001** HbA1c vs PTH0.781<0.001**Table 12Correlation of glycemic and biochemical parameters in Control group
Variable Pairr-valuep-value PPBS vs Total cholesterol0.2500.012* PPBS vs TG0.1990.047* PPBS vs LDL0.2590.009* HbA1c vs Vitamin D3-0.379<0.001** HbA1c vs PTH0.847<0.001**Table 13Correlation among Vitamin D3, PTH, and Osteocalcin
GroupCorrelation Pairr-valuep-value T2DM patientsVitamin D3 vs PTH-0.701<0.001** Osteocalcin vs Vit D3NS>0.05 Osteocalcin vs PTHNS>0.05 ControlsVitamin D3 vs PTH-0.3010.002* Osteocalcin vs Vit D3NS>0.05
Comments (0)