
Remember me


Three SNPs significantly associated with plasma FBP1 (P < 5 × 10⁻⁸) and independent (r² ≤ 0.1) were initially selected as genetic instruments (Table S1). After screening for potential confounders, one SNP (rs2460137) was excluded due to its association with eGFR. During harmonization with the outcome dataset, an additional palindromic SNP was removed. The final analysis therefore utilized one SNP (rs4743962; F-statistic = 96) analyzed via the Wald ratio method, showing that genetically predicted higher FBP1 levels were associated with reduced DKD risk (OR 0.57, 95% CI 0.33–0.98; P = 0.04) (Table S1). Sensitivity analyses evaluating individual SNP effect estimates yielded consistent directions of association (Figure S1). Notably, Bayesian colocalization analysis revealed a low posterior probability for a shared causal variant between plasma FBP1 and DKD (Figure S2; Table S1). The lead SNP identified by the locuscomparer R package (rs7035381) was defined as the variant with the smallest combined p-value from both the FBP1 pQTL and DKD GWAS studies for visualization purposes, although it was not the most significant SNP in either trait individually. As illustrated in Figure S2B, the actual lead SNPs for FBP1 (rs2460137) and DKD (rs184625543) are distinct and reside within separate linkage disequilibrium blocks, further supporting the absence of colocalization. The weak colocalization signal may reflect the presence of distinct causal variants influencing FBP1 levels and DKD risk, which could contribute to a higher false-negative rate in colocalization analysis.
Despite comprehensive searches in both the GTEx and NephQTL2 databases using a liberal significance threshold (P = 1 × 10⁻⁴), we failed to identify any SNPs significantly associated with renal FBP1 expression (Supplementary Material: Tissue-specific SNPs). This precludes definitive attribution of plasma FBP1 to renal sources, suggesting potential extrarenal origins. Given that renal tubular epithelial cells are known producers of FBP1, we specifically investigated whether renal FBP1 expression alterations correlate with DKD progression. Accordingly, subsequent experiments focused on characterizing the relationship between renal tissue FBP1 expression and DKD progression.
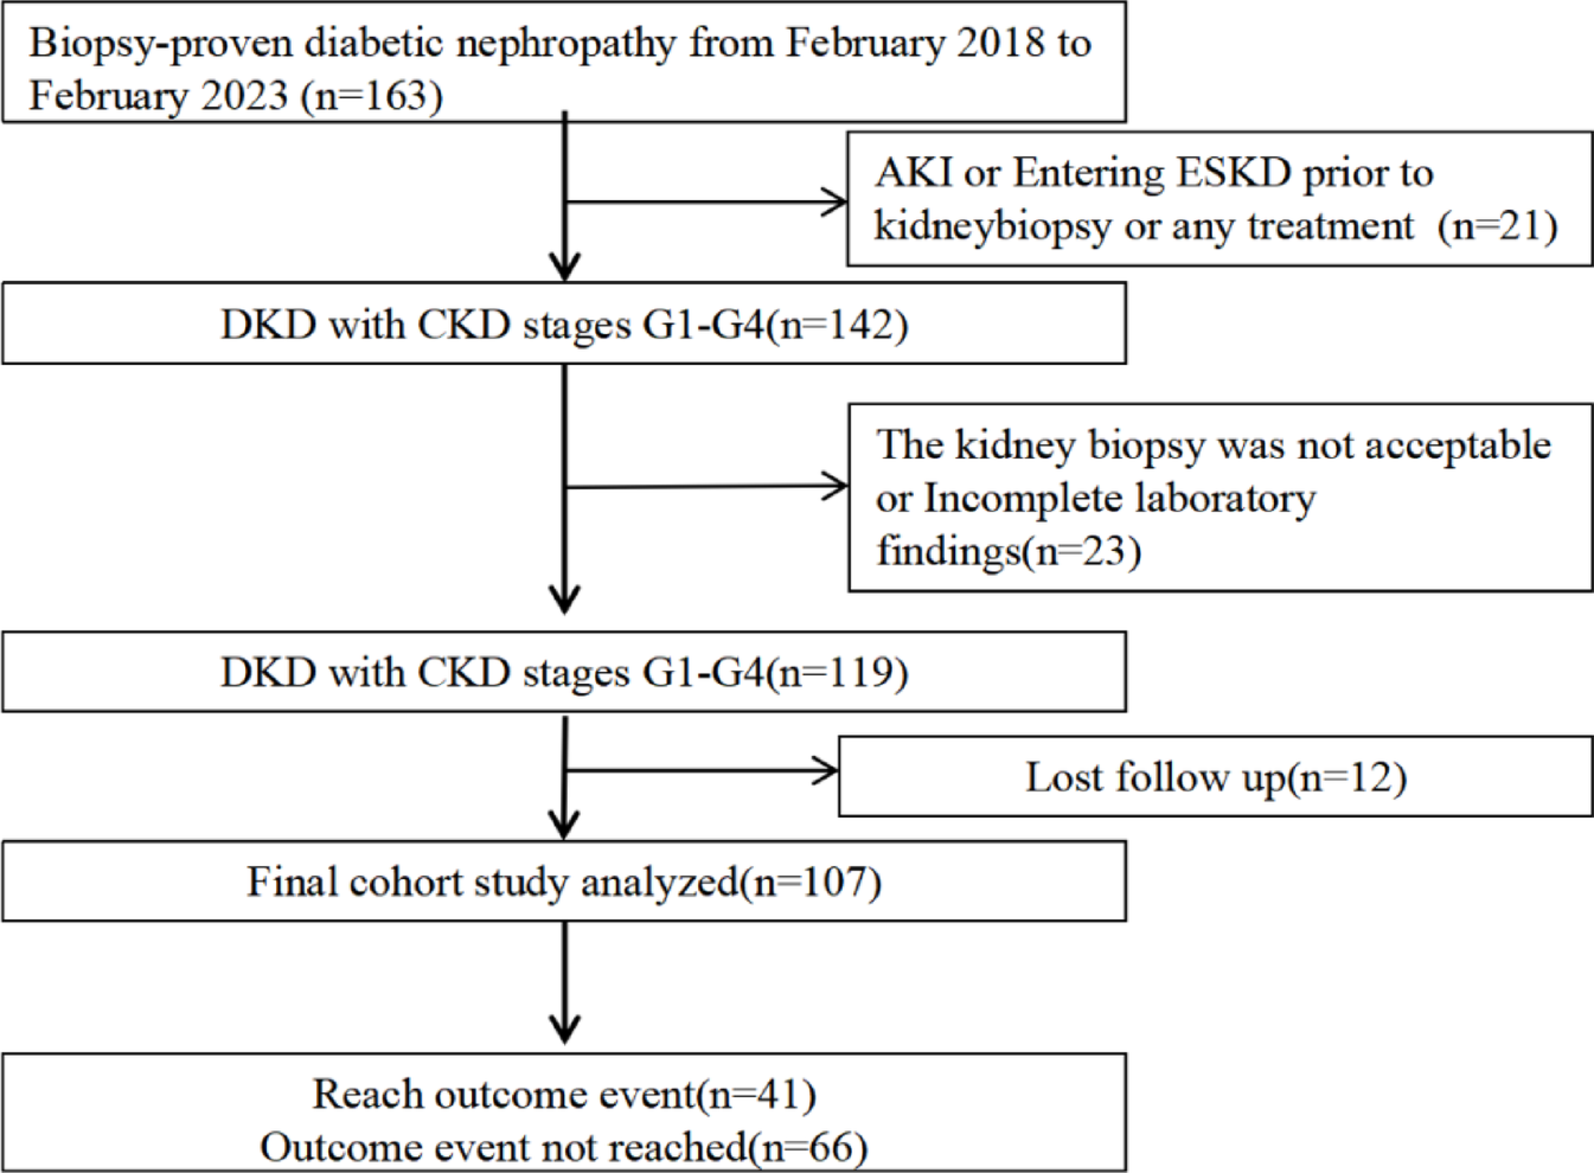
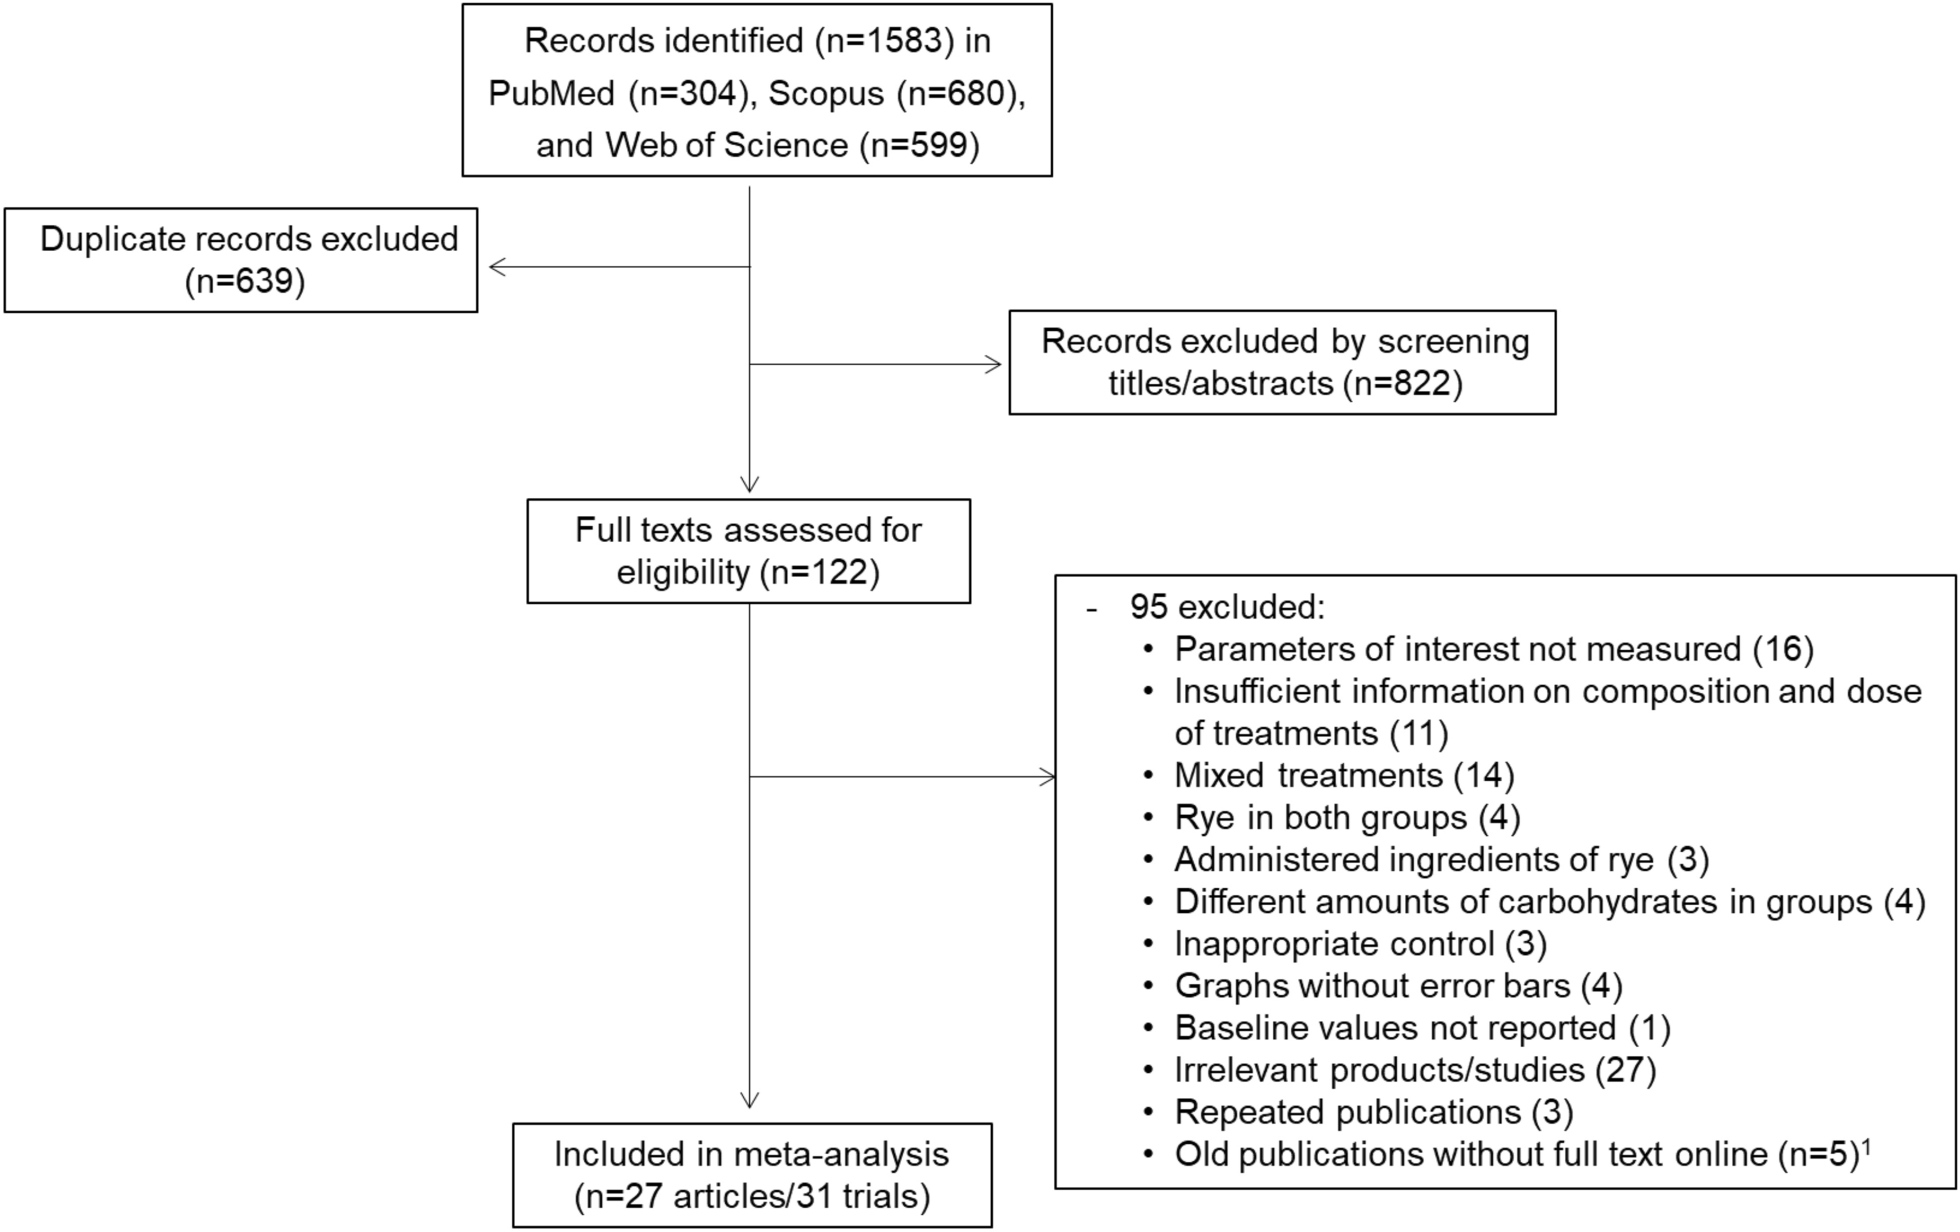
Comparative analysis of renal FBP1 expression between DKD patients and controlsA total of 107 eligible DKD patients were enrolled, including 76 (71%) males and 31 (29%) females, with a mean age of 52.26 ± 10.99 years (Fig. 1). Three participants suffered from type 1 diabetes (3%), while 104 participants had type 2 diabetes (97%). Their baseline characteristics are shown in Table 1. In comparison to the controls from paracancerous normal kidney tissues, DKD patients showed significant differences in age, Hb, FBG, albumin, TG, serum UA, BUN, SCr, and eGFR (P < 0.05). No significant differences were detected in gender, BMI, HDL-C, TC, and LDL-C between the two groups (P > 0.05).
Fig. 1
A flow chart of participants’ enrollment. DKD, diabetic kidney disease; AKI, acute kidney injury; CKD, chronic kidney disease; ESKD, end-stage kidney disease
Table 1 Baseline clinical and laboratory characteristics of enrolled DKD patients and controlsThere were 37 DKD patients in stage Ⅱ, 43 in stage Ⅲ, and 27 in stage Ⅳ (Table 1). Significant differences were detected in Hb, albumin, HDL-C, TG, serum UA, BUN, SCr, eGFR, and 24-h urine protein among DKD patients at varied stages (P < 0.05). Pathological features, including renal tubulointerstitial injury, interstitial inflammation, and vasculopathy, as well as renal FBP1 expression, were also significantly different in varied stages (P < 0.05, Table S2). Consistently, single-cell transcriptomic sequencing [19] showed that PCK1, FBP1, and G6PC were significantly up-regulated in the proximal tubules of early-stage DKD patients (Figure S3). Stratified by renal tubulointerstitial injury, interstitial inflammation, vascular hyaline degeneration, and vascular sclerosis, it is found that the expression level of FBP1 significantly decreased with the increased pathological scores (P < 0.05, Fig. 2A-D).
Fig. 2
Expression levels of renal FBP1. (A-D) Expression levels of FBP1 in DKD patients in varied pathological stages. The expression levels of FBP1 were significantly reduced in DKD patients with high interstitial fibrosis and renal tubular atrophy (IFTA) scores(A), high interstitial inflammation score(B), and the aggravation of vascular lesions (C, D). Correlation between the expression of FBP1 and eGFR in 107 DKD patients (E), or in patients with stage Ⅱ(F), stage Ⅲ(G), and stage Ⅳ(H) DKD. FBP1, Fructose-1,6-diphosphatase 1; DKD, diabetic kidney disease. *, P < 0.05; **, P < 0.01; ***, P < 0.001; ****, P < 0.0001
Renal FBP1 expression positively correlates with eGFR in DKD patientsExpression level of FBP1 in DKD kidney tissues was positively correlated with Hb (r = 0.374, P < 0.001) and eGFR (r = 0.717, P < 0.001), and negatively correlated with BUN (r=−0.565, P < 0.001), SCr (r=−0.712, P < 0.001), and 24-h urine protein (r=−0.197, P = 0.042) (Table S3). In addition, the expression level of FBP1 was positively correlated with eGFR in DKD patients in all the pathological stages, most pronounced in stage Ⅳ (r = 0.816, P < 0.001), followed by stage Ⅲ (r = 0.790, P < 0.001) and stage Ⅱ (r = 0.375, P = 0.022) (Fig. 2E-H).
Positive correlation between renal FBP1 and CPT1A expression in DKD patientsImmunohistochemical results showed that FBP1 was highly expressed in the cytoplasm of renal tubular epithelial cells. A significantly higher expression level of FBP1 was detected in stage Ⅱ DKD kidney tissues, compared with paracancerous normal kidney tissues (Fig. 3A). Besides, the expression level of FBP1 in kidney tissues significantly decreased with the worsening of the pathological grade of DKD (Fig. 3B). Immunohistochemical staining showed that CPT1A was mainly expressed in the cytoplasm of renal tubular epithelial cells, and its expression level was significantly lower in DKD kidney tissues than in paracancerous normal kidney tissues (Fig. 3A). Semi-quantitative results showed that the expression level of CPT1A significantly decreased with the pathological worsening of DKD (Fig. 3C), and positively correlated with the expression level of FBP1 (r = 0.745, P < 0.001, Fig. 3D) in DKD patients.
Fig. 3
Expressions of FBP1 and CPT1A in DKD. (A) Representative microscopic images showing positive expressions of FBP1 and CPT1A in 107 DKD patients in varied pathological stages and paracancerous normal kidney tissues from 18 renal cell carcinoma patients (Cont). (B, C) Expressions of FBP1 and CPT1A in DKD patients in varied pathological stages, and their semi-quantification analyses. (D) Correlation of FBP1 with CPT1A in DKD. PAS staining is a classic histopathological and histochemical staining technique, mainly used to detect carbohydrate-rich structures or abnormal deposits in tissues. Masson staining is a special staining technique widely used in pathology and histology, and it is particularly crucial in the assessment of fibrotic lesions. FBP1, Fructose-1,6-diphosphatase 1; CPT1A, Carnitine palmitoyl transferase 1 A; Cont, control; DKD, diabetic kidney disease. *P < 0.05; **P < 0.01; ***P < 0.001; ****P < 0.0001
Renal FBP1 serves as a kidney progression biomarker in biopsy-proven DKD (Stages II-IV)During a median follow-up period of 26 months, 41 DKD patients progressed to doubling of SCr or ESKD. Stratified according to the median of FBP1 expression (13.98%), DKD patients were divided into the FBP1 high expression group (n = 50) and the FBP1 low expression group (n = 57). We then created a Cox proportional hazard model to assess the endpoint events during DKD progression. First, we established a hypothesis that the effect of FBP1 on DKD progression was consistent with the risk ratio. Univariate Cox regression analysis showed that the pathological stage of DKD (HR 2.611, 95% CI 1.722–3.961, P < 0.001) and baseline Hb (HR 0.962, 95% CI 0.947–0.978, P < 0.001), albumin (HR 0.938, 95% CI 0.900- 0.978, P = 0.003), eGFR (HR 0.649, 95% CI 0.557–0.756, P < 0.001), 24-h urine protein (HR 4.442, 95% CI 2.209–8.931, P < 0.001), use of ACEI/ARB (HR 0.442, 95% CI 0.200- 0.974, P = 0.043), use of SGLT2 inhibitor (HR 0.451, 95% CI 0.213–0.956, P = 0.038), and FBP1 classification (HR 0.165, 95% CI (0.069–0.394, P < 0.001) were significantly correlated with DKD progression. After adjusting for pathological stage, Hb, albumin, 24-h urine protein, eGFR, use of ACEI/ARB, and use of SGLT2 inhibitor, the multivariate Cox regression analysis showed that FBP1 was a prognostic factor for preventing DKD progression (HR 0.325, 95% CI 0.107–0.986, P = 0.047, Table 2). Kaplan-Meier survival analysis revealed that the likelihood of DKD progression in the high FBP1 expression group was reduced by 67%, in comparison to the low FBP1 expression group (P < 0.001, Fig. 4A). The baseline model incorporating eGFR and 24-h urine protein showed moderate discriminative ability (C-index 0.794, 95% CI 0.728–0.860). Notably, integrating FBP1 significantly improved predictive performance (C-index 0.871, 95% CI 0.822–0.920; likelihood ratio test P = 0.011). We subsequently developed a clinical nomogram combining FBP1 expression, eGFR, and 24-h urine protein to predict 1-year and 3-year EFS in DKD (P < 0.05, Fig. 4B). The nomogram demonstrated that lower eGFR, higher proteinuria, and reduced FBP1 expression collectively predicted worse renal outcomes.
Table 2 Univariate and multivariate Cox regression identifying the correlation of FBP1 with DKD progressionFig. 4
Association of renal FBP1 and DKD progression. (A) Kaplan–Meier curves showed EFS of DKD patients expressing high and low FBP1 (P < 0.001). Relative FBP1 expression ≥ 13.98% was defined as the FBP1 high group, while < 13.98% was defined as the FBP1 low group. (B) A nomogram predicting 1-year and 3-year EFS of DKD. FBP1 classification, 0 was defined as the FBP1 low group, and 1 was defined as the FBP1 high group; 24-h urine protein, 0 was defined as 24-h urine protein < 3.5 g, and 1 was defined as 24-h urine protein ≥ 3.5 g. For a given patient, locate their values for FBP1 classification and 24-hour urine protein on the corresponding axis. Draw a vertical line upward to the “Points” axis at the top to assign a score for each variable. Sum the points from all variables. Locate the total score on the “Total Points” axis, then draw a vertical line down to the 1-year and 3-year EFS probability axes to estimate survival likelihood. FBP1, Fructose-1,6-diphosphatase 1; DKD, diabetic kidney disease; EFS, event-free survival
Comments (0)