
Remember me


The study involved 625 diabetic participants, including 282 with DPN and 343 without. Clinical and laboratory data were presented in Table 1. The DPN group was characterized by older age, lower BMI, and a longer duration of diabetes. This group also had a higher percentage of male gender and smoking habit. Clinically, they exhibited poorer glycemic control (higher HbA1c and FBG), lower serum albumin, and reduced liver enzymes (ALT and AST). Renal function in the DPN group appeared more compromised, with increased Scr, microalbumin, UACR, and a decrease in eGFR. Their lipid profiles were also distinct, with lower TG, TC, and LDL-C. Additionally, DPN patients exhibited higher D-dimer and NLR, along with lower fasting insulin and C-peptide levels. Furthermore, a lower PNI in the DPN group suggested a potential link between nutritional status and the development of DPN.
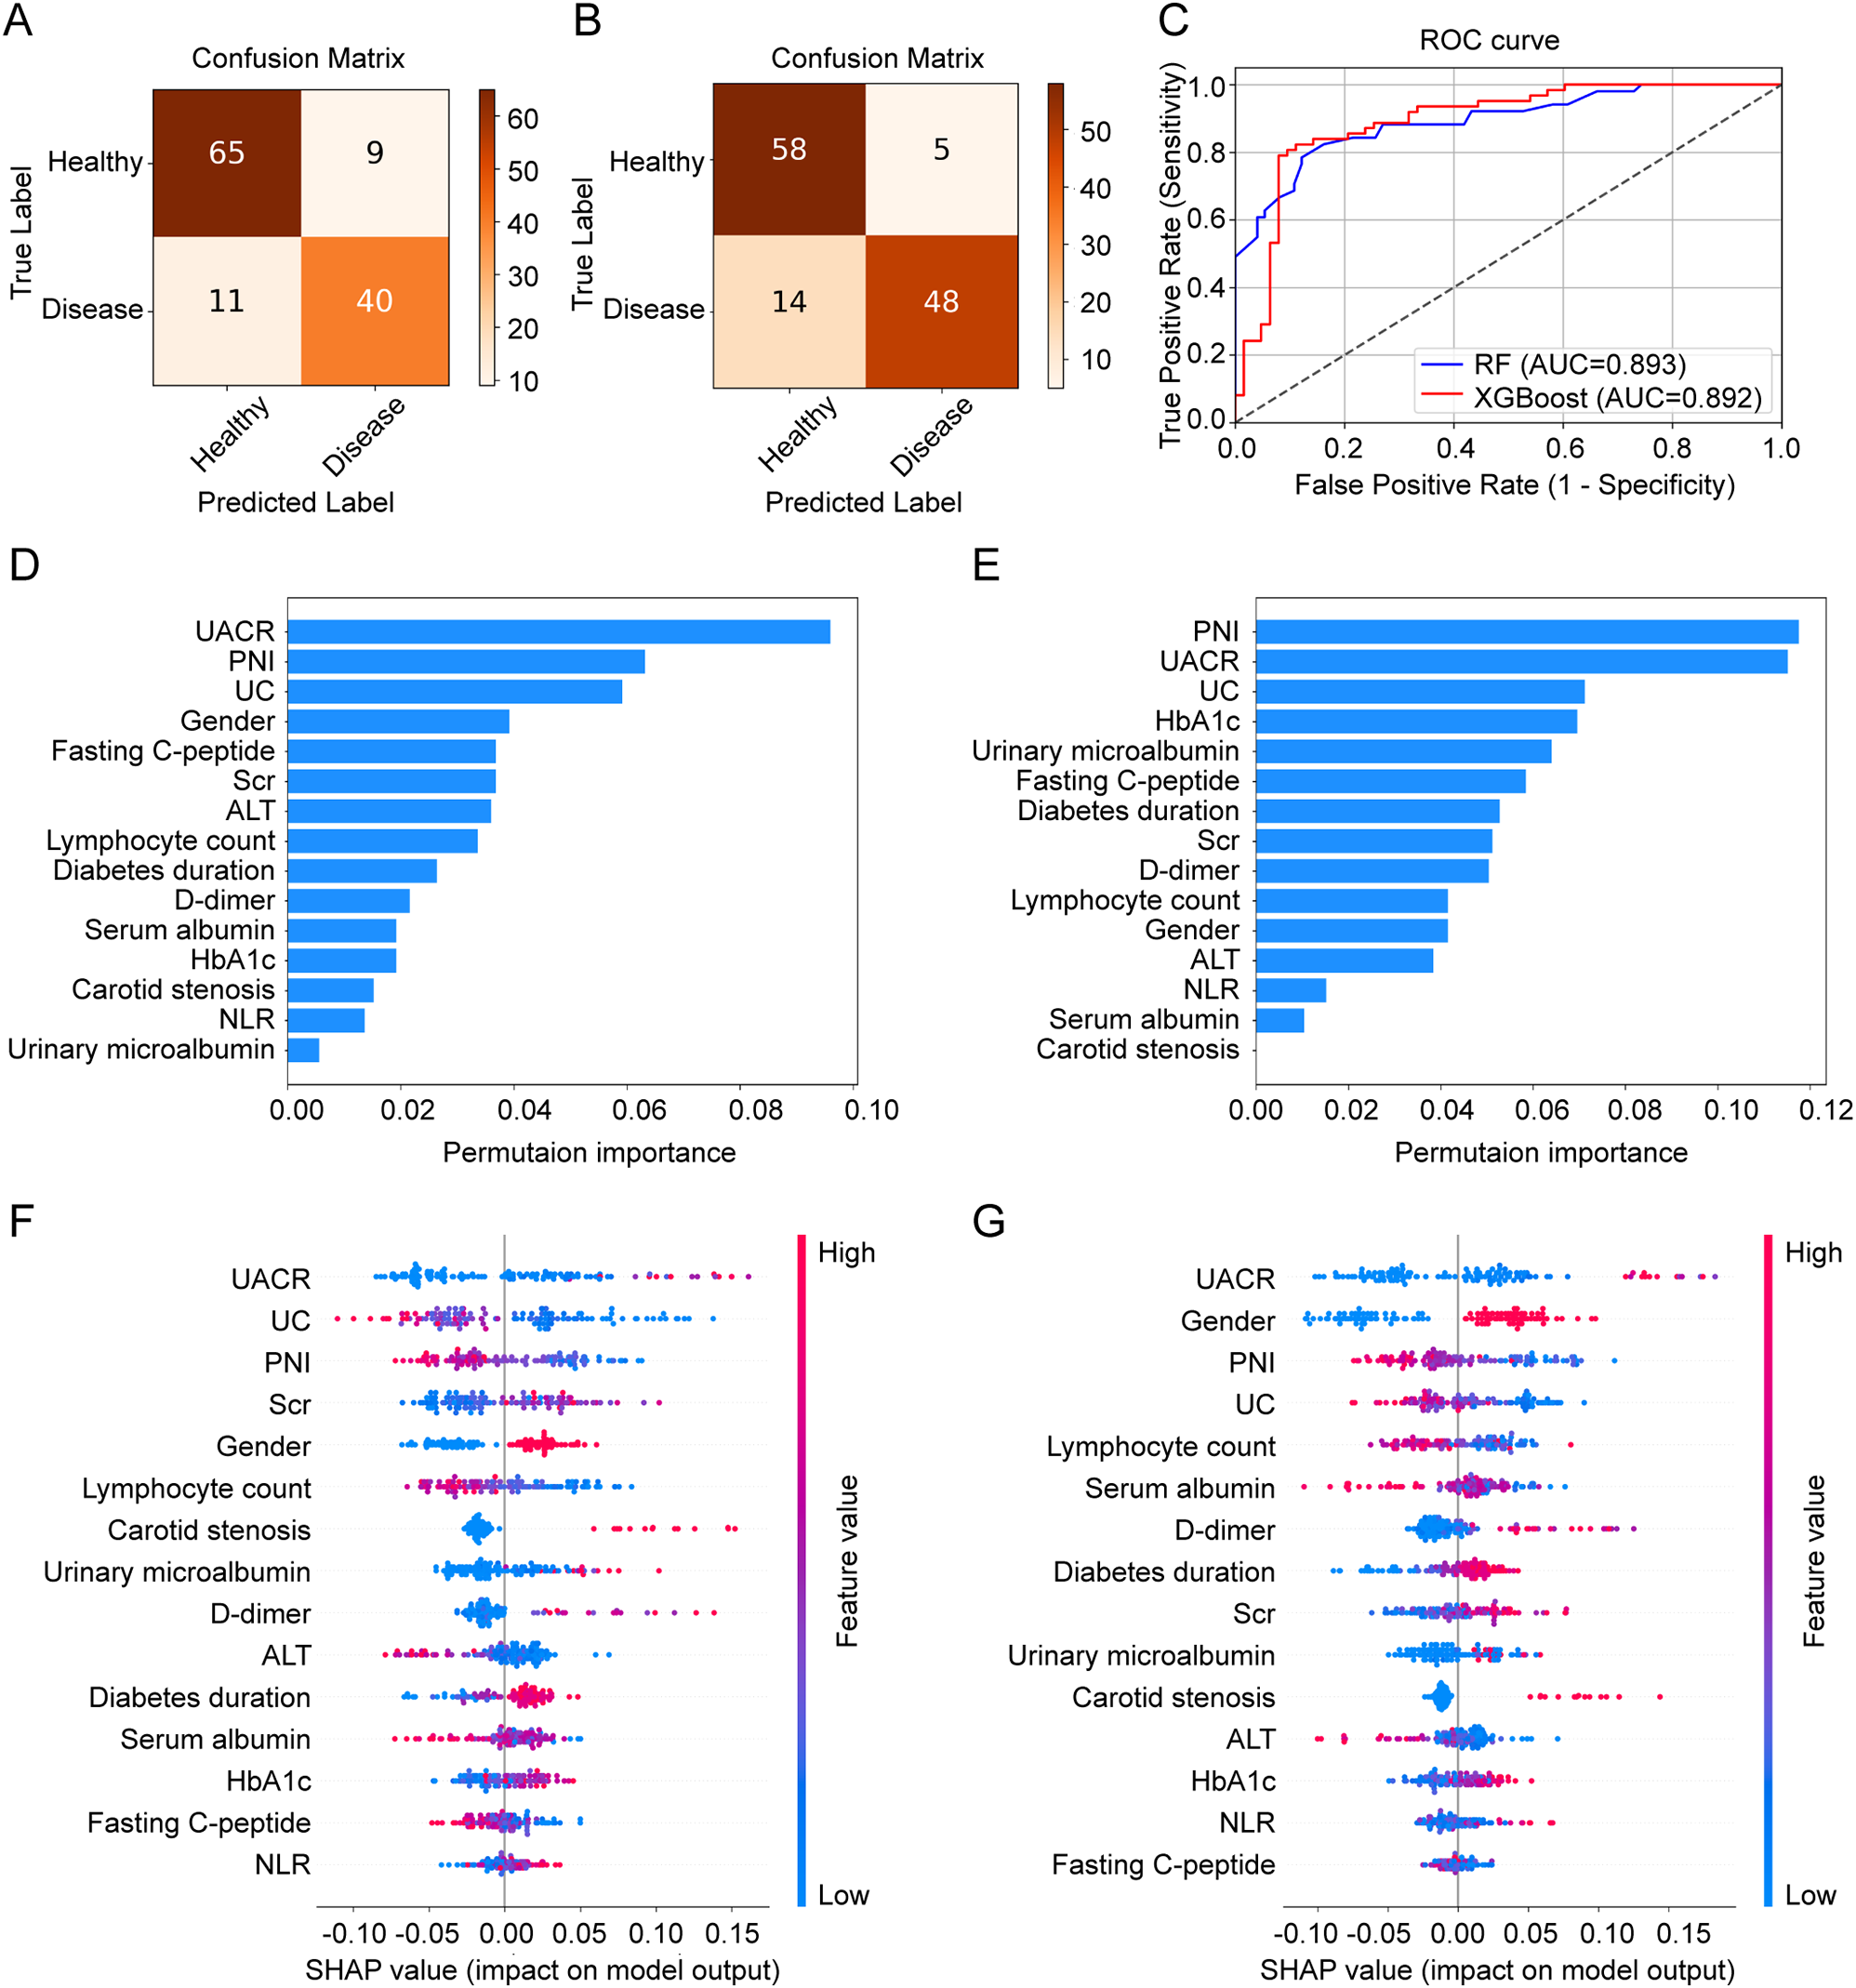
Table 1 Clinical features of patients with or without DPNPerformance and interpretation of ML modelsA total of 15 features were selected for model construction, as detailed in Supplementary Table S2. The diagnostic performance of both models was shown in Fig. 1A-C. The RF model achieved an AUC of 0.893, with a recall of 78.4%, specificity of 87.8%, accuracy of 84.0%, precision of 81.6%, and an F1 score of 80.0%. In comparison, the XGBoost model demonstrated a similar AUC of 0.892 but with a slightly lower recall of 77.4%. However, the XGBoost model outperformed the RF model in specificity (92.1%), accuracy (84.8%), precision (90.6%), and F1 score (83.5%).
Fig. 1
Comparative performance and feature importance analysis of ML models for predicting DPN. A, Confusion matrix for the RF model. B, Confusion matrix for the XGBoost model. C, ROC curve for both RF and XGBoost models in detecting DPN. D and E, Feature importance analysis using permutation importance for RF and XGBoost models. F and G, Feature importance analysis using SHAP for RF and XGBoost models. ML, machine learning; DPN, diabetic peripheral neuropathy; RF, random forest; ROC, receiver operating characteristic; SHAP, SHapley Additive exPlanations
To evaluate the importance of each feature in both models, we first applied permutation importance to assess their individual contributions. In the RF model, PNI ranked second (Fig. 1D), while in the XGBoost model, it ranked first (Fig. 1E), underscoring its strong association with the prevalence of DPN. Next, we employed SHAP analysis to explore the directionality of this relationship. As illustrated in Fig. 1F-G, PNI was identified as the third most influential feature in both RF and XGBoost models. The SHAP value distributions for PNI revealed that higher PNI values corresponded to more negative SHAP values, suggesting that an increase in PNI was associated with a decreased risk of DPN. To further visualize this relationship, we used partial dependence plots, which confirmed the negative association, showing that as PNI increased, the risk of DPN decreased in both models (Fig. 2).
Fig. 2
Partial dependence plots for PNI in the RF and XGBoost models. A, RF model. B, XGBoost model. PNI, prognostic nutritional index; RF, random forest
Association between PNI quartiles and the risk of DPNPatients were divided into four groups according to their PNI quartiles: Q1 (≤ 44.80), Q2 (44.81–48.05), Q3 (48.06–51.48), and Q4 (≥ 51.49). The study showed a clear decline in the prevalence of DPN with increasing PNI levels (Fig. S1). The prevalence of DPN, from the lowest PNI quartile (Q1) to the highest quartile (Q4), were 65.2%, 44.9%, 41.3%, and 28.8%, respectively (P < 0.001). This inverse relationship was reinforced by logistic regression analysis (Table 2). In the unadjusted model (Model 1), each standard deviation decrease in PNI was associated with an 81.1% increase in the risk of DPN (OR: 1.811, 95%CI: 1.506–2.716, P < 0.001). This significant association persisted even after adjusting for multiple factors in the fully adjusted model (Model 3), where the OR was 1.491 (95%CI: 1.187–1.873, P = 0.001). Notably, in Model 3, the risk of DPN was 2.271 times higher in the Q1 group compared to the Q4 baseline group (P < 0.001), revealing the potential role of PNI as a marker for DPN risk.
Table 2 DPN risks in different PNI quartilesRelationship between PNI and clinical featuresSpearman’s correlation analysis showed significant associations between PNI and various factors (Table 3). Positive correlations with PNI, ranked by strength, included TC, TG, LDL, urinary creatinine, BMI, ALT, fasting C-peptide, SUA, eGFR, fasting insulin, neutrophil count, and AST. Negative correlations were observed with NLR, D-dimer, age, UACR, and diabetic duration. After adjusting for age, gender, and diabetic duration, these correlations remained significant. Positive correlations were noted for TC (r = 0.138, P < 0.001), LDL (r = 0.137, P = 0.006), ALT (r = 0.131, P = 0.008), and SUA (r = 0.110, P = 0.027). Negative correlations continued to be significant with NLR (r=-0.390, P < 0.001), UACR (r=-0.261, P < 0.001), and D-dimer (r=-0.243, P < 0.001).
Table 3 Correlation between PNI and clinical features in patients with type 2 diabetesChanges in peripheral nerve conduction velocities and action potentials across PNI quartilesA comparative analysis of peripheral nerve function across PNI quartiles in patients with T2D was presented in Fig. 3. Compared to the highest PNI quartile (Q4), significant reductions in SNCV, MNCV, SNAP, and MNAP were observed across all tested nerves in the lowest quartile (Q1). Notably, MNCV in Q1 was significantly lower than in the middle quartiles (Q2 and Q3) for all tested nerves. Furthermore, both SNAP and MNAP of the ulnar nerve, as well as MNAP of the common peroneal nerve, showed significant declines in the mid-quartiles (Q2 and Q3) compared to Q4. These findings suggested that lower PNI levels were associated with more severe peripheral nerve dysfunction, with the most pronounced impairment observed in the lowest quartile (Q1).
Fig. 3
Comparative analysis of EMG parameters across PNI quartile groups. A, SNCV in diabetic patients. B, MNCV in diabetic patients. C, SNAP in diabetic patients. D, MNAP in diabetic patients. EMG, electromyography; PNI, prognostic nutritional index; SNCV, sensory nerve conduction velocity; MNCV, motor nerve conduction velocity; SNAP, sensory nerve action potential; MNAP, motor nerve action potential. Dark red: Q4; Light blue: Q3; Yellow: Q2; Dark blue: Q1. *P < 0.05, **P < 0.01, ***P < 0.001, vs. Q4; #P < 0.05, ##P < 0.01, vs. Q3; §P < 0.05, §§P < 0.01, §§§P < 0.001, vs. Q2
Comments (0)