
Remember me



A total of 22 pairs of Ti discs (10 mm in diameter, 78.54 mm2 surface area, and 2 mm thick) and a pair of Ti implants (4 mm in diameter, 9 mm in length) [DCT4009 DC Unroughened (machined—M) and DCT4009 DC Roughened—R)], manufactured by Southern Implants (Pty Ltd., Irene, South Africa), were utilized in this study. The biofilm growth side of the discs was machined (M) on 22 discs and roughened using alumina grit blasting (AB) on the other 22 discs. The remaining surfaces of the discs were polished to minimize bacterial adhesion.
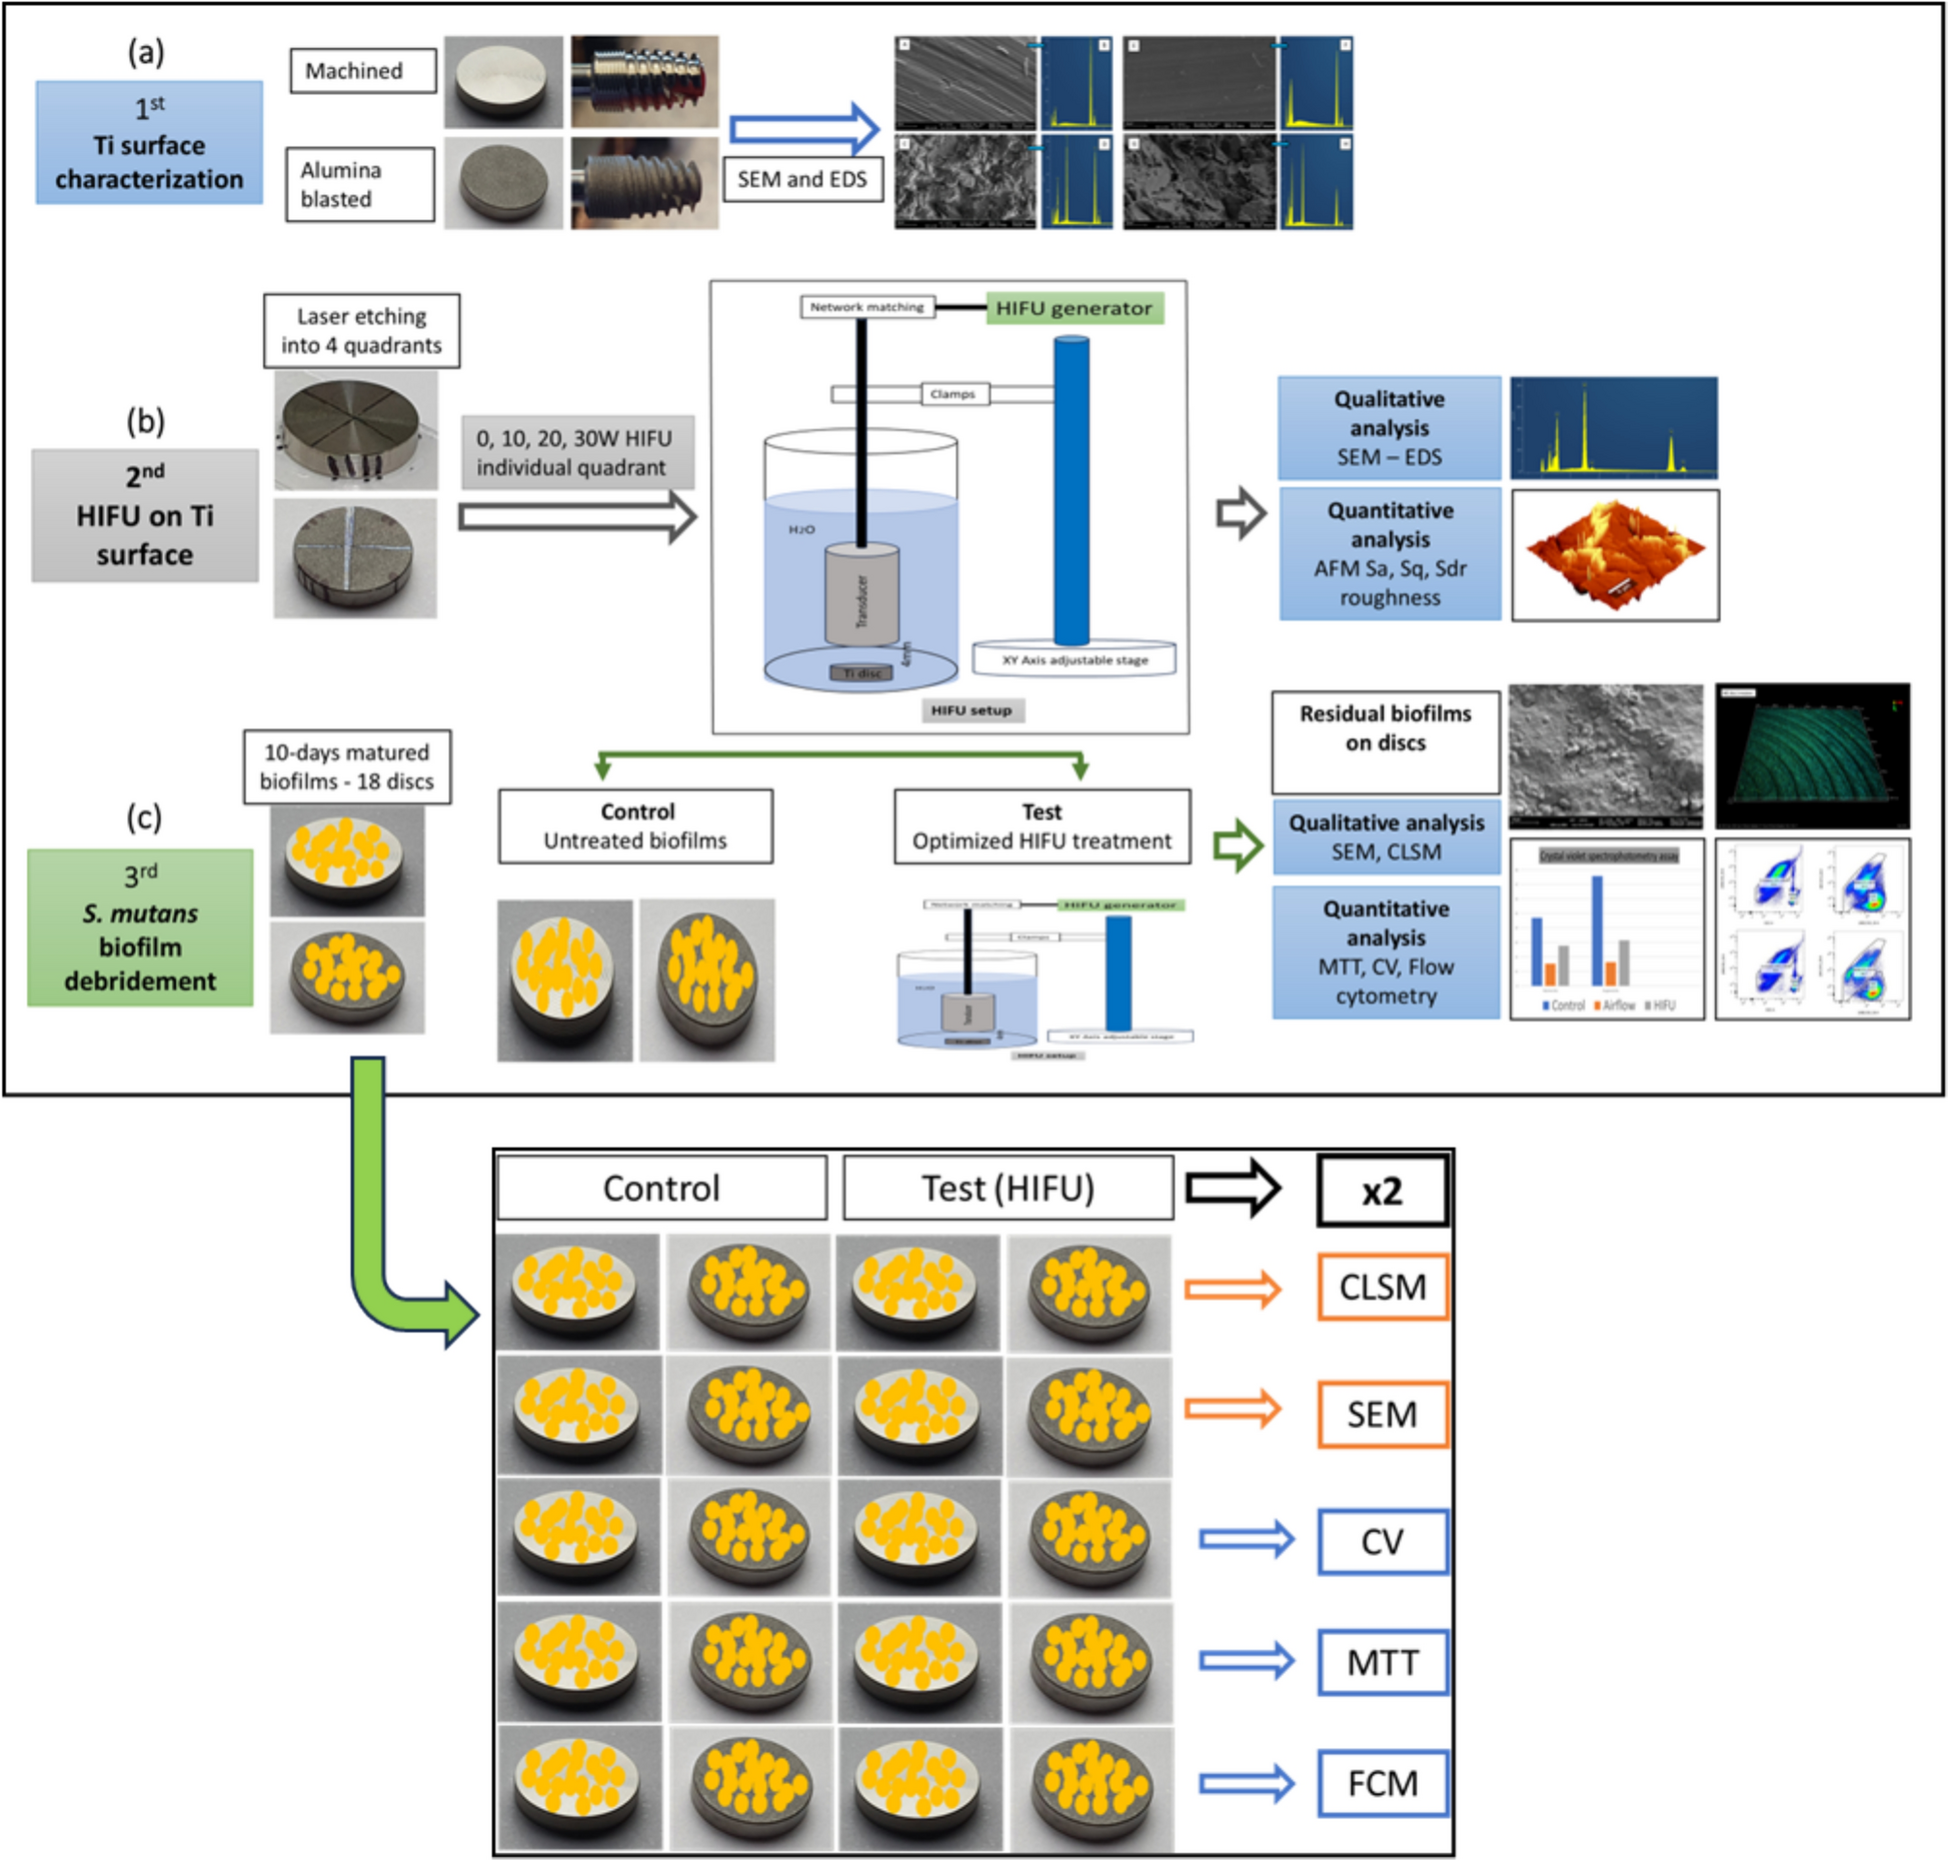
Two sets of discs and one set of implants were utilized for surface characterization and assessing HIFU effects on microscopic topography and chemical composition, while the remaining 20 sets were used for HIFU biofilm debridement investigation. The methodology is illustrated in Fig. 1.
Fig. 1
Above: the study design includes: a characterization of the Ti test surfaces through qualitative analysis using SEM and EDS, along with quantitative surface roughness assessment via AFM; b evaluation of the effects of different HIFU intensities on substrate surface roughness and chemical composition; and c investigation of the debridement effects of HIFU on S. mutans biofilms grown on Ti substrates. Below: number and grouping of the samples in the HIFU biofilm debridement stage
Study designThe study workflow is visually summarized in Fig. 1, depicting three interconnected investigative stages. The first stage involved the surface characterization of Ti discs using three atomic force microscopy (AFM) roughness parameters: Sa (arithmetic mean height), Sq (root mean square height), and Sdr (developed interfacial area ratio). Additionally, scanning electron microscopy (SEM) and Energy Dispersive X-Ray Spectroscopy (EDS) were employed to analyze the microscopic topography and chemical composition, with results compared to those of commercial Ti implants from the same manufacturer.
The second stage focused on optimizing HIFU by assessing the effects of varying HIFU intensities on Ti surface roughness and chemistry. Lastly, the third stage examined the debridement of S. mutans biofilms attached to the Ti surface.
For biofilm characterization, two qualitative imaging techniques—dual fluorescence/reflection confocal laser scanning microscopy (FR-CLSM) and SEM—were used to visualize the biofilm topography on Ti surfaces. Additionally, three quantitative methods—crystal violet (CV), MTT, and flow cytometry (FCM)—were employed to assess different biofilm properties. Specifically, the CV assay quantified biomass, the MTT assay measured metabolic activity, and FCM determined the number of bacteria remaining on Ti surfaces after treatment. The results were compared to control samples, where biofilms were left untreated.
HIFU setupA HIFU transducer (XDR094 S/N:19, Sonic Concept, USA) of 15.5 mm in diameter was connected to a TPO-200-09 HIFU generator (Sonic Concept, USA) through a XDR094-019 matching network. The mechanical index of the HIFU output was calculated to ensure it remained within the therapeutic range using the equation \(MI \, = \, P_ /\sqrt \). The transducer was operated at a frequency of 254 kHz, pulse mode (3 ms burst length/6 ms cycle), duration of 2 min, and with varying output power of 10W, 20W, and 30W, respectively. The test Ti surfaces were positioned in a 25 mL beaker filled with distilled water, and the transducer was positioned at 4 mm (focal length). Temperature change occurring during HIFU application on the Ti surface was measured using a thermocouple (Lutron BMT-4208SD, Taiwan).
Ti surface characterization with and without HIFU exposureThe Ti surfaces were marked into 4 quadrants using laser etching (Er, Cr: YSGG MD biolase, Cromwell Irvine, CA, US). Only quadrants 2, 3, and 4 were subjected to HIFU parameters while quadrant 1 was used as a control. The unexposed quadrants were covered with Polyvinyl Siloxane impression material (3 M ESPE Imprint™ light) to avoid overlap of HIFU exposure.
The microscopic roughness, topography, and surface chemistry of each quadrant were characterized following the protocols detailed in Sect. "Study design".
The surface roughness and topography of the Ti disc (n = 1 pair) were analysed using AFM (WITec alpha 300RA +—Germany). AFM was performed at high resolution in tapping mode using a silicon cantilever coated with aluminium. An area of 20 µm × 20 µm [40] was scanned with a resolution of 512 lines and a speed of 2 s. Data was collected and analysed using Project5 5.2 (WITec Suite FIVE software—Germany). The background–subtraction Sa, Sq, and Sdr nanoscopic roughness data from discrepancy–free scans were extracted from topography mode for data analysis [47].
SEM–EDS was utilized to examine the microscopic topography and chemical composition. The selected Ti disc pair and a pair of Ti dental implants were mounted on aluminum stubs using Cu tape and coated with a ~ 20 nm carbon layer (Polaron SC7640, Quorum Technologies Ltd, UK).
For each sample, 10 random sites were selected for analysis. SEM images were captured at magnifications of 500 × and 5000 ×, followed by EDS data acquisition at 20 kV with a 60 µm aperture using a secondary electron detector. The EDS data was then analyzed using AZtec® 5.1 software (OXFORD Instruments, UK).
HIFU biofilm debridement effectsBiofilm formationThis protocol was modified from Lemos et al. [48] and ATCC bacteriology culture guide.
S. mutans (ATCC 700610) were grown overnight in Brain–Heart Infusion broth (BHI) (Sigma-Aldrich, Australia) supplemented with 1% sucrose (Sigma-Aldrich, Australia) at 37 °C for 24 h and adjusted to a concentration of 5 × 10⁶ colony-forming units (CFU) per mL (optical density at 600 nm = 0.5) (McFarland Densitometer–Fisher Biotec Australia).
10 pairs of M and R Ti disc were placed individually in a 24 well plate (× 2) with 2 mL of adjusted bacterial suspension and incubated at 37 °C for 10 days in an orbital shaker at 50 rpm, the medium was replenished every 2 days. On day 10, Ti discs were washed gently in 2 mL of phosphate-buffered saline (PBS) to remove loose bacteria and placed in 2 mL of PBS until treatment.
Biofilm debridement protocolBased on the results obtained from the second stage (2.2. section), the HIFU parameters were optimised to be further operated at the following conditions: 254 kHz frequency, pulsed mode (3 ms/6 ms), 2 min at 20 W. The discs were divided randomly into four experimental groups: Control (M surface), Control (AB surface), Test (M surface), and Test (AB surface) with five discs each (n = 5 each) (Fig. 1).
For HIFU treatment (n = 5 × 2), the discs containing biofilms from the test groups were placed in 25 mL glass beakers filled with 10 mL of PBS. The HIFU transducer was hovered over the biofilm surface at 4 mm and operated at the above-mentioned parameters. After each application, the transducer was kept in 70% Ethanol for 10 min for disinfection followed by dipping twice in PBS for 2 min each to remove the alcohol.
The control samples (n = 5 × 2) were not exposed to HIFU.
The treated discs were gently dipped 4 times in 2 mL of PBS to remove debris and placed in 2 mL of fresh PBS. The number of each experimental group was selected randomly into two analysing subgroups for qualitative (n = 2 pairs) and quantitative (n = 3 pairs) analyses. The experiment was then repeated once, resulting in a total sample of 20 pairs. The number and grouping of the sample are summarized in Fig. 1.
Biofilm characterization protocolQualitative characterizationConfocal laser scanning microscopy (CLSM)Four Ti discs, one from each of the four experimental groups (n = 2 pairs of M and AB), were stained with LIVE/DEAD™ BacLight™ following the manufacturer’s instructions. The images of the stained biofilms were visualised using CLSM. A dual fluorescent/reflection CLSM Z stacks from random sites of each disc were taken at 10x (NA 0.45, 1024-pixel size) with the laser wavelength 488/561 nm for fluorescent and 405 nm wavelength for reflection using Nikon A1 Si Confocal Microscopy (Nikon Instruments Inc, NY, USA). The reflected light was collected between 405 and 750 nm wavelength range.
Scanning electron microscopy (SEM)After fixing the biofilms with 4% paraformaldehyde, four Ti discs, one from each of the four experimental groups (n = 2 pairs of M and AB), were affixed onto aluminium stubs using Cu tape and carbon coated (~ 20 nm) (Polaron SC7640, Quorum Technologies Ltd, UK). A total of 10 sites were randomly selected for examination from each disc, and the SEM images were captured at a magnification of 5000 × at 5 kV, 30 µm aperture using a secondary electron detector.
Quantitative characterizationTo release the biofilms from the attached Ti surfaces, the samples (n = 6 pairs) were each placed in 5 mL flat-bottom tubes filled with 2 mL of PBS and placed in an ultrasonic bath (L&R SweepZone Technology, NJ, USA) for 10 min. The tubes were then shaken using a vortex mixer for 2 s, the 2 mL suspension was extracted for CV, MTT, and FCM assays.
Crystal violet assay (CV)The Ti discs from each group (n = 2 pairs), after treatment, were assessed using the CV assay, following a method previously described with minor adjustments [49]. 100 µL of suspension was pipetted onto 96 well plates, and 100 µL of 0.1% aqueous crystal violet solution (CV; Sigma-Aldrich, Australia) was added into each well and incubated for 15 min. Afterward, the CV solution was gently aspirated, and the specimens were washed three times with distilled water. The biofilm was then solubilised with 30% acetic acid, and the CV was quantified by measuring the absorbance at 590 nm using a microtiter plate reader (Sunrise ™, Tecan, Switzerland).
MTT assayTo further investigate the metabolic activity of the viable bacteria, (3-[4,5-dimethylthiazol-2-yl]-2,5 diphenyl tetrazolium bromide) MTT assay was performed using bromide kit (0.5 mg/mL MTT solution) (Sigma-Aldrich, Australia), in accordance with the manufacturer’s instructions. 100 µL of the bacterial suspension obtained after ultrasonication was then pipetted in triplicates into a 96-well plate in a volume of 100 µL. Then, 10 µL of MTT reagent were added to each well, and the plate was covered and incubated at 37 °C for 4 h. Following incubation, the reagent was aspirated, and 100 µL of the solubilizing solution was added, and subjected to incubation overnight at 37 °C. The absorbance at 600 nm was measured using a spectrophotometer (SunriseTM, Tecan, Switzerland).
Flow cytometry analysis (FCM)For bacterial counts using FCM, 1 mL suspension was centrifuged at 4000 rpm for 10 min, the supernatant was removed, and 2 mL of 0.9% sodium chloride was added to the tube. After vortex mixing, 100 µL of this bacterial suspension was extracted for staining with SYTO9 and propidium iodide from LIVE/DEAD™ BacLight™ Bacterial Viability and Counting Kit (Thermo Fisher Scientific) following manufacturer’s instructions (100 µL bacterial suspension + 1.5 µL propidium iodide + 1.5 µL SYTO9 + 10 µL microspheres + 887 µL sodium chloride 9%) producing 1000 µL of stained bacterial suspension for measurement [47].
Four single-color controls were prepared, and the results from these control samples were used for voltage calibration and gating. An LSR Fortessa cytometer and BD FACSDiva™ software (BD Biosciences) were used with laser wavelengths of 488 nm and 561 nm. The fluorescence signals were collected in three channels with the filters of 610 nm (for 561 nm laser), 530 nm, and 695 nm (for 488 nm laser). Forward scatter, side scatter, and fluorescence data were collected for 5 min using a medium flow with logarithmic signal amplification, and the files were saved in FCS (flow cytometry standard) format and analysed using FlowJo v10 (BD Biosciences) software. The sample quality was controlled using the inspect function of the software, the FSC versus time plot, and the number of beads (106 in each 1 mL sample). The four single-color controls were used for gating, which differentiated three populations of SYTO9 stained (live), PI stained (dead), and total bacteria. The total bacterial counts and the percentage of live versus dead bacteria were collected as data for statistical analysis [47].
Statistical analysisData were presented as mean ± standard deviation and analysed using ANOVA followed by T tests (Microsoft Excel and R statistical software). Statistical significance was measured at p < 0.05.
Comments (0)