
Remember me
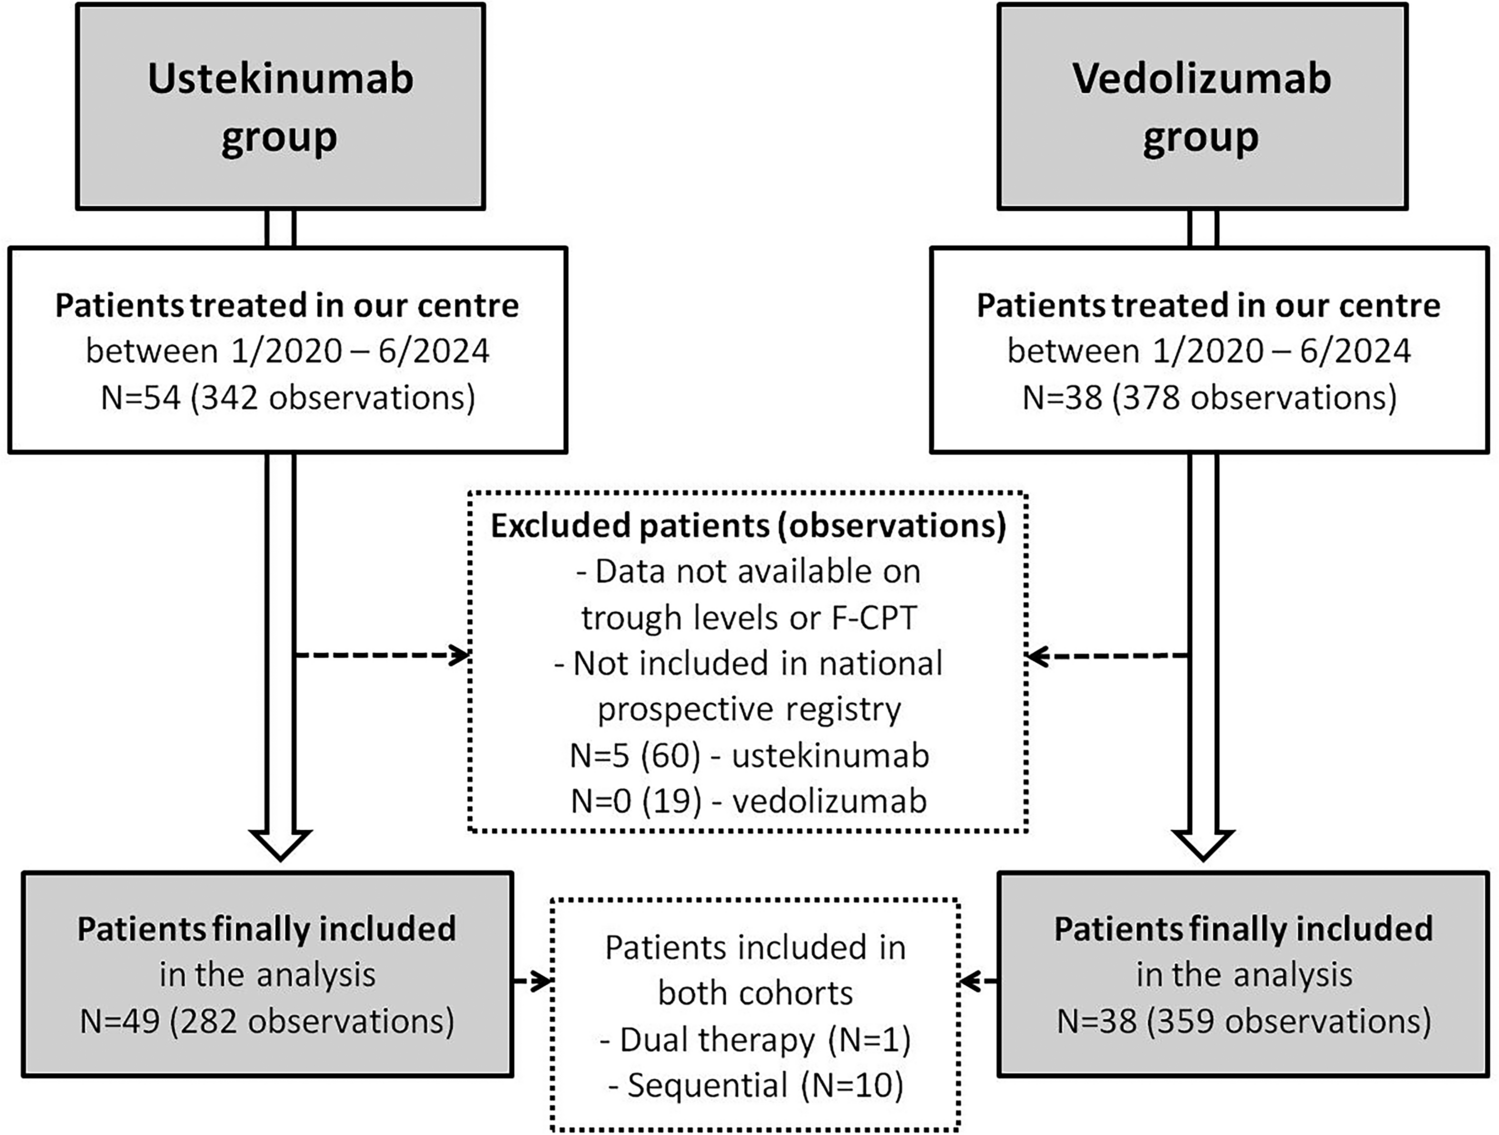
During the study period, a total of 54 patients received at least one dose of USTE, and 38 patients received at least one dose of VEDO at our IBD centre. After excluding patients who did not fulfil the inclusion criteria, we included 282 observations from 49 patients in the USTE group (5 median observations per patient (IQR 2–8); all anti-TNF-experienced) and 359 observations from 38 patients in the VEDO group (6 median observations per patient (IQR 2–14); 5 anti-TNF-naive). Ten patients are represented in both cohorts (initially receiving one of the study drugs and subsequently swapping to the other study drug). One patient received dual therapy (USTE + VEDO), and five patients initially started on IV VEDO and then switched to SC VEDO (Flowchart 1, Fig. 1). Basic characteristics of the study subjects and respective observations are reported in Tables 1 and 2.
Fig. 1
Flowchart of patients included in the study
Table 1 Characteristics of USTE and VEDO study groupsTable 2 Characteristics of USTE and VEDO observationsIn the POCC, we included 815 observations from 197 patients treated with ADA (4 median observations per patient (IQR 2–6) and 2197 observations from 231 patients treated with IFX (7 median observations per patient (IQR 2–16). Basic characteristics of these patients are listed in Supplementary Table 1.
3.2 USTE TLs and F-CPT3.2.1 Analysis of All ObservationsIn a linear mixed model including all observations (N = 282), USTE TLs were not associated with logF-CPT levels (β −0.0133, 95% CI −0.0301–0.0033, p = 0.117). Neither induction phase, undetectable TLs, nor type of IBD (CD, UC, IBD-U) were associated with logF-CPT.
3.2.2 Analysis of Maintenance Observations OnlyWhen considering only measurements taken during the maintenance period (N = 249) of the treatment, the relationship between USTE TLs and logF-CPT remained non-significant in the linear mixed model (β −0.0132, 95% CI −0.0304–0.0038, p = 0.13; Fig. 2a). However, in the categorical model, higher USTE maintenance TLs were significantly associated with F-CPT < 250 ug/g (odds ratio (OR) 1.024, 95% CI 1.022–1.026, p < 0.001) but not with F-CPT < 100 ug/g (OR 1.036, 95% CI 0.979–1.096, p = 0.219). Undetectable TLs of USTE were not associated with higher logF-CPT (β −0.0665, 95% CI −0.9054–0.7793, p = 0.877). Antibodies to USTE were not analysed owing to the low number of positive observations (five observations in four patients, all turned negative during subsequent measurements).
Fig. 2
Relationship between USTE and F-CPT in the maintenance phase. a Relationship between USTE maintenance TLs and logF-CPT levels in the linear mixed model (β −0.0132, 95% CI −0.0304–0.0038, p = 0.13). b Relationship between length of USTE maintenance treatment (expressed in years) and logF-CPT levels in the linear mixed model (β −0.0010, 95% CI −0.0015 to −0.0006, p < 0.001). F-CPT faecal calprotectin; TLs trough levels; USTE ustekinumab
To analyse potential confounders, other factors were explored. First, we added time from the first USTE dose (length of treatment (LOT), expressed in days) into the model. When USTE TLs and LOT were adjusted for, only LOT was independently associated with lower F-CPT levels in both the linear (β −0.0010, 95% CI −0.0015 to −0.0006, p < 0.001; Fig. 2b) and categorical (OR 1.002, 95% CI 1–1.004, p = 0.004) models.
When we also added the age of the patient at the first USTE dose (tested in all maintenance observations, N = 249; final model, Table 3) and treatment intensification (higher dose and/or shorter interval; tested in observations where all these data were available, N =145; Supplementary Table 2a) into the model as independent factors, only the LOT remained strongly associated with lower logF-CPT (β −0.0010, 95% CI −0.0015 to −0.0006, p < 0.0001 and β −0.0010, 95% CI −0.0018 to −0.0003, p = 0.007, respectively). In other words, each additional week of USTE treatment duration was associated with a decrease of F-CPT levels by 5.6 ug/g (95% CI −10.8 to −0.7, p = 0.03; Supplementary Table 2b).
Table 3 Final mixed model including USTE TLs, length of treatment and age of the patient at the first USTE dose3.3 VEDO TLs and F-CPT3.3.1 Analysis of All ObservationsIn a linear mixed model including all observations (N = 359), VEDO TLs were associated with logF-CPT levels (β −0.0158, 95% CI −0.0267 to −0.0046, p = 0.005). Neither induction phase, undetectable TLs, nor type of IBD (CD, UC, IBD-U) were associated with logF-CPT.
3.3.2 Analysis of Maintenance Observations OnlyWhen considering only measurements taken during the maintenance period (N = 274) of the treatment, the relationship between VEDO TLs and logF-CPT remained significant in the linear mixed model (β −0.0173, 95% CI −0.0292 to −0.0053, p = 0.005; Fig. 3a) as well as in the categorical model with a cut-off of F-CPT < 250 ug/g (OR 1.03, 95% CI 1.005–1.057, p = 0.026) and with F-CPT < 100 ug/g (OR 1.03, 95% CI 1.005–1.057, p = 0.026). It was impossible to evaluate undetectable TLs of VEDO as no undetectable TLs were identified among our observations. Antibodies to VEDO were not analysed owing to the low number of positive observations (16 observations in 11 patients, all turned negative during subsequent measurements).
Fig. 3
Relationship between VEDO and F-CPT in the maintenance phase. a Relationship between VEDO maintenance TLs and logF-CPT levels in the linear mixed model (β −0.0173, 95% CI −0.0292 to −0.0053, p = 0.005). b Relationship between length of VEDO maintenance treatment (expressed in years) and logF-CPT levels (β −0.0005, 95% CI −0.001–0, p = 0.066). F-CPT faecal calprotectin; TLs trough levels; VEDO vedolizumab
To analyse potential confounders, other factors were explored. First, we added LOT (expressed in days) into the model. When VEDO TLs and LOT were adjusted for, LOT was not independently associated with lower F-CPT levels in either linear (β −0.0005, 95% CI −0.001−0, p = 0.066; Fig. 3b) or categorical (OR 1.001, 95% CI 0.999–1.003, p = 0.205) models.
When we also added the age of the patient at the first VEDO dose (tested in all maintenance observations, N = 274; final model, Table 4) and treatment intensification into the model as independent factors (tested in observations where all these data were available, N =209; Supplementary Table 2c), only VEDO TLs remained significantly associated with lower logF-CPT (β −0.0156, 95% CI −0.0276 to −0.0033, p = 0.01 and β −0.0176, 95% CI −0.0307 to −0.0043, p = 0.01, respectively).
Table 4 Final mixed model including VEDO TLs, length of treatment and age of the patient at the first VEDO doseTo analyse whether there is an optimal VEDO TL that predicts F-CPT < 250 ug/g during the maintenance phase, a receiver operating characteristic (ROC) curve was constructed. A VEDO TL of 15.1 μg/mL appeared to have the best combination of sensitivity (0.82) and specificity (0.32). However, the overall predictive value was very poor (AUC 0.56, 95% CI 0.49–0.63; Supplementary Fig. 1a). Optimal VEDO TL predicting F-CPT < 100 ug/g during the maintenance phase was 22.1 μg/mL (sensitivity, 0.62; specificity, 0.51; AUC, 0.57; 95% CI 0.51–0.64; Supplementary Fig. 1b). Quartile analysis of VEDO TLs revealed no clear linear relationship with logF-CPT levels, and values across all quartiles greatly overlapped (Supplementary Fig. 2).
3.4 Disease Location and Immunomodulatory TreatmentAs USTE was mainly used in CD and VEDO in patients with UC, we provide analysis limited to these phenotypes for respective treatments (owing to low number of observations in the other groups). For USTE, we evaluated L1 CD phenotype versus other locations and presence versus absence of perianal disease. Neither of these factors when added to the linear mixed model reached statistical significance. For VEDO we added analysis of the disease extension, where E1/E2 versus E3/E4 reached borderline significance when added to the linear mixed model being positively associated with higher F-CPT (β 1.915, 95% CI 0.1696–3.6621, p = 0.045). Immunomodulatory treatment did not show any significant association when added to the linear mixed model either for USTE or VEDO. Adding disease location or immunomodulatory treatment into the models did not change any previously identified relationships of USTE/VEDO TLs and log F-CPT mentioned above.
3.5 ADA and IFX—The POCCTo validate our conceptual framework and analytical methods for assessing the USTE and VEDO cohorts, we applied the same models to our cohort of patients treated with ADA and IFX. There was a strong association between ADA TLs and logF-CPT when tested in all observations (N = 815, β −0.0675, 95% CI −0.0975 to −0.0376, p < 0.0001); maintenance observations only (N = 410, β −0.0908, 95% CI −0.1346 to −0.0471, p < 0.0001; Supplementary Fig. 3a); and also in the categorical model with a cut-off for F-CPT < 250 ug/g (N = 410, OR 1.16, 95% CI 1.064–1.256, p = 0.001). The same association was found for IFX (N = 2197, β −0.0556, 95% CI −0.0701 to −0.0411, p < 0.0001; N = 1309, β −0.0805, 95% CI −0.0998 to −0.0612, p < 0.0001, Supplementary Fig. 4a; and N = 1309, OR 1.131, 95% CI 1.087−1.176, p < 0.001, respectively). The strong association remained in mixed models including LOT and age at the first drug dose (Supplementary Table 2d and 2e). Association of LOT and logF-CPT in the ADA and IFX cohort is shown in Supplementary Figs. 3b and 4b, respectively.
Comments (0)