
Remember me
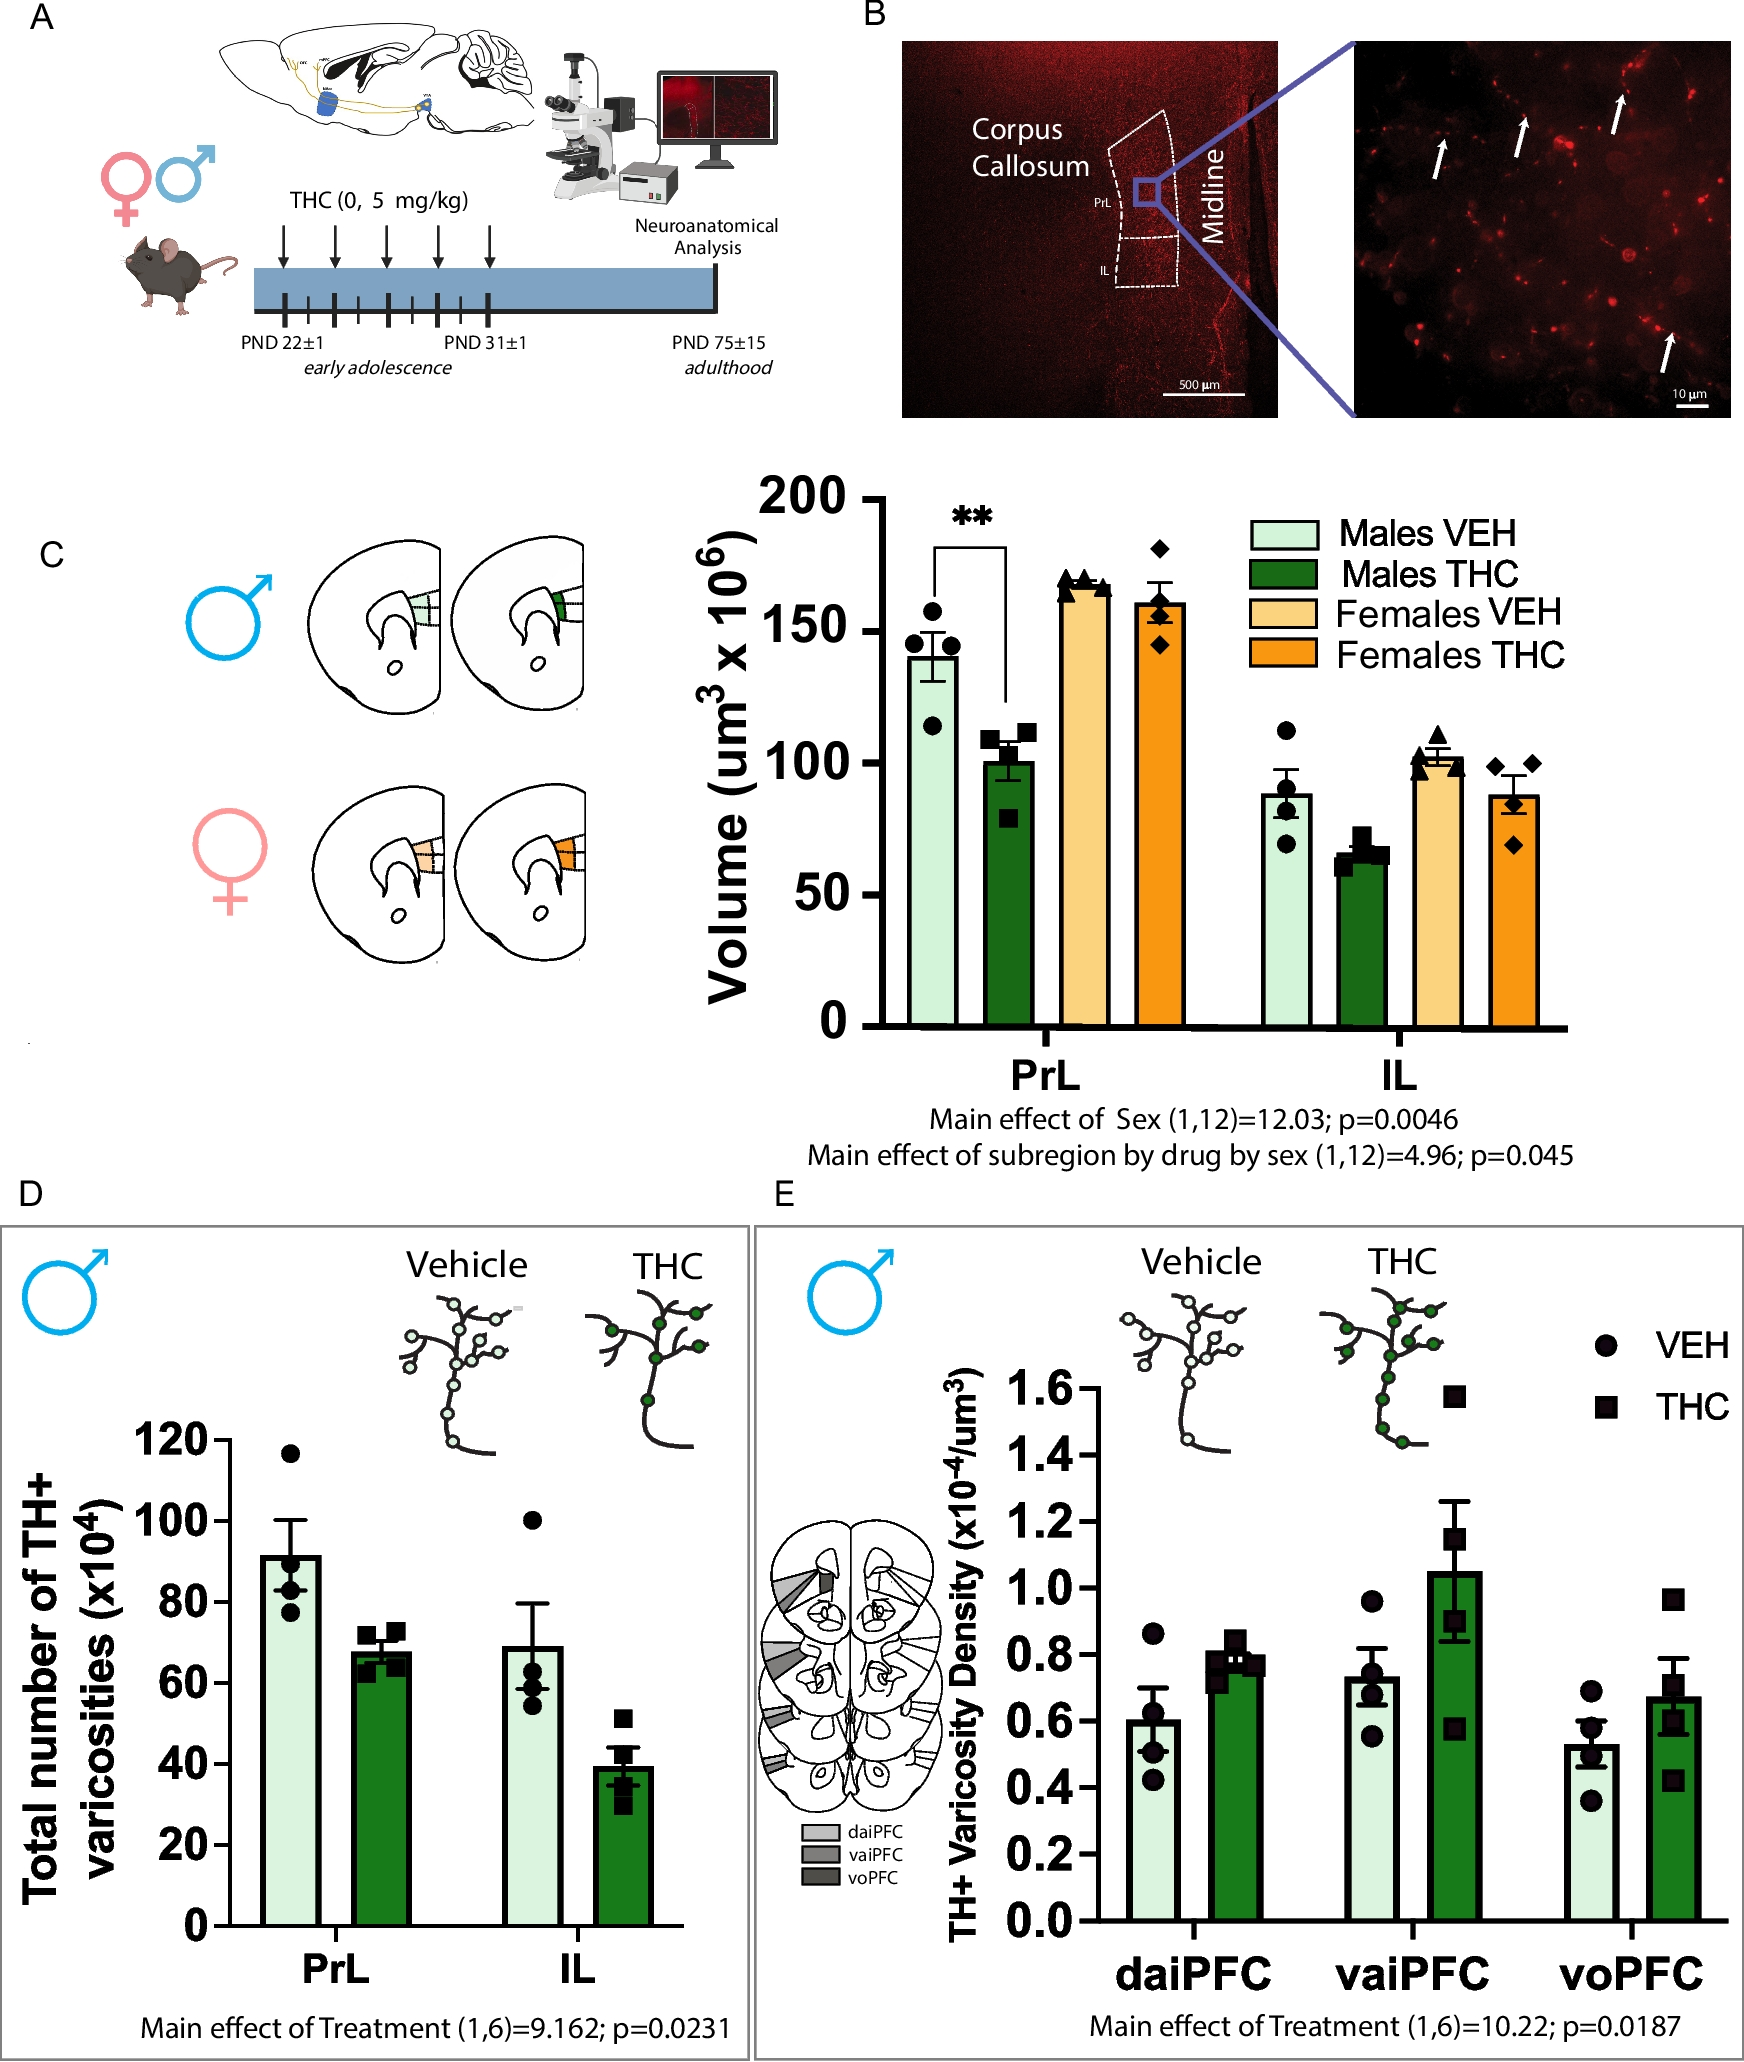
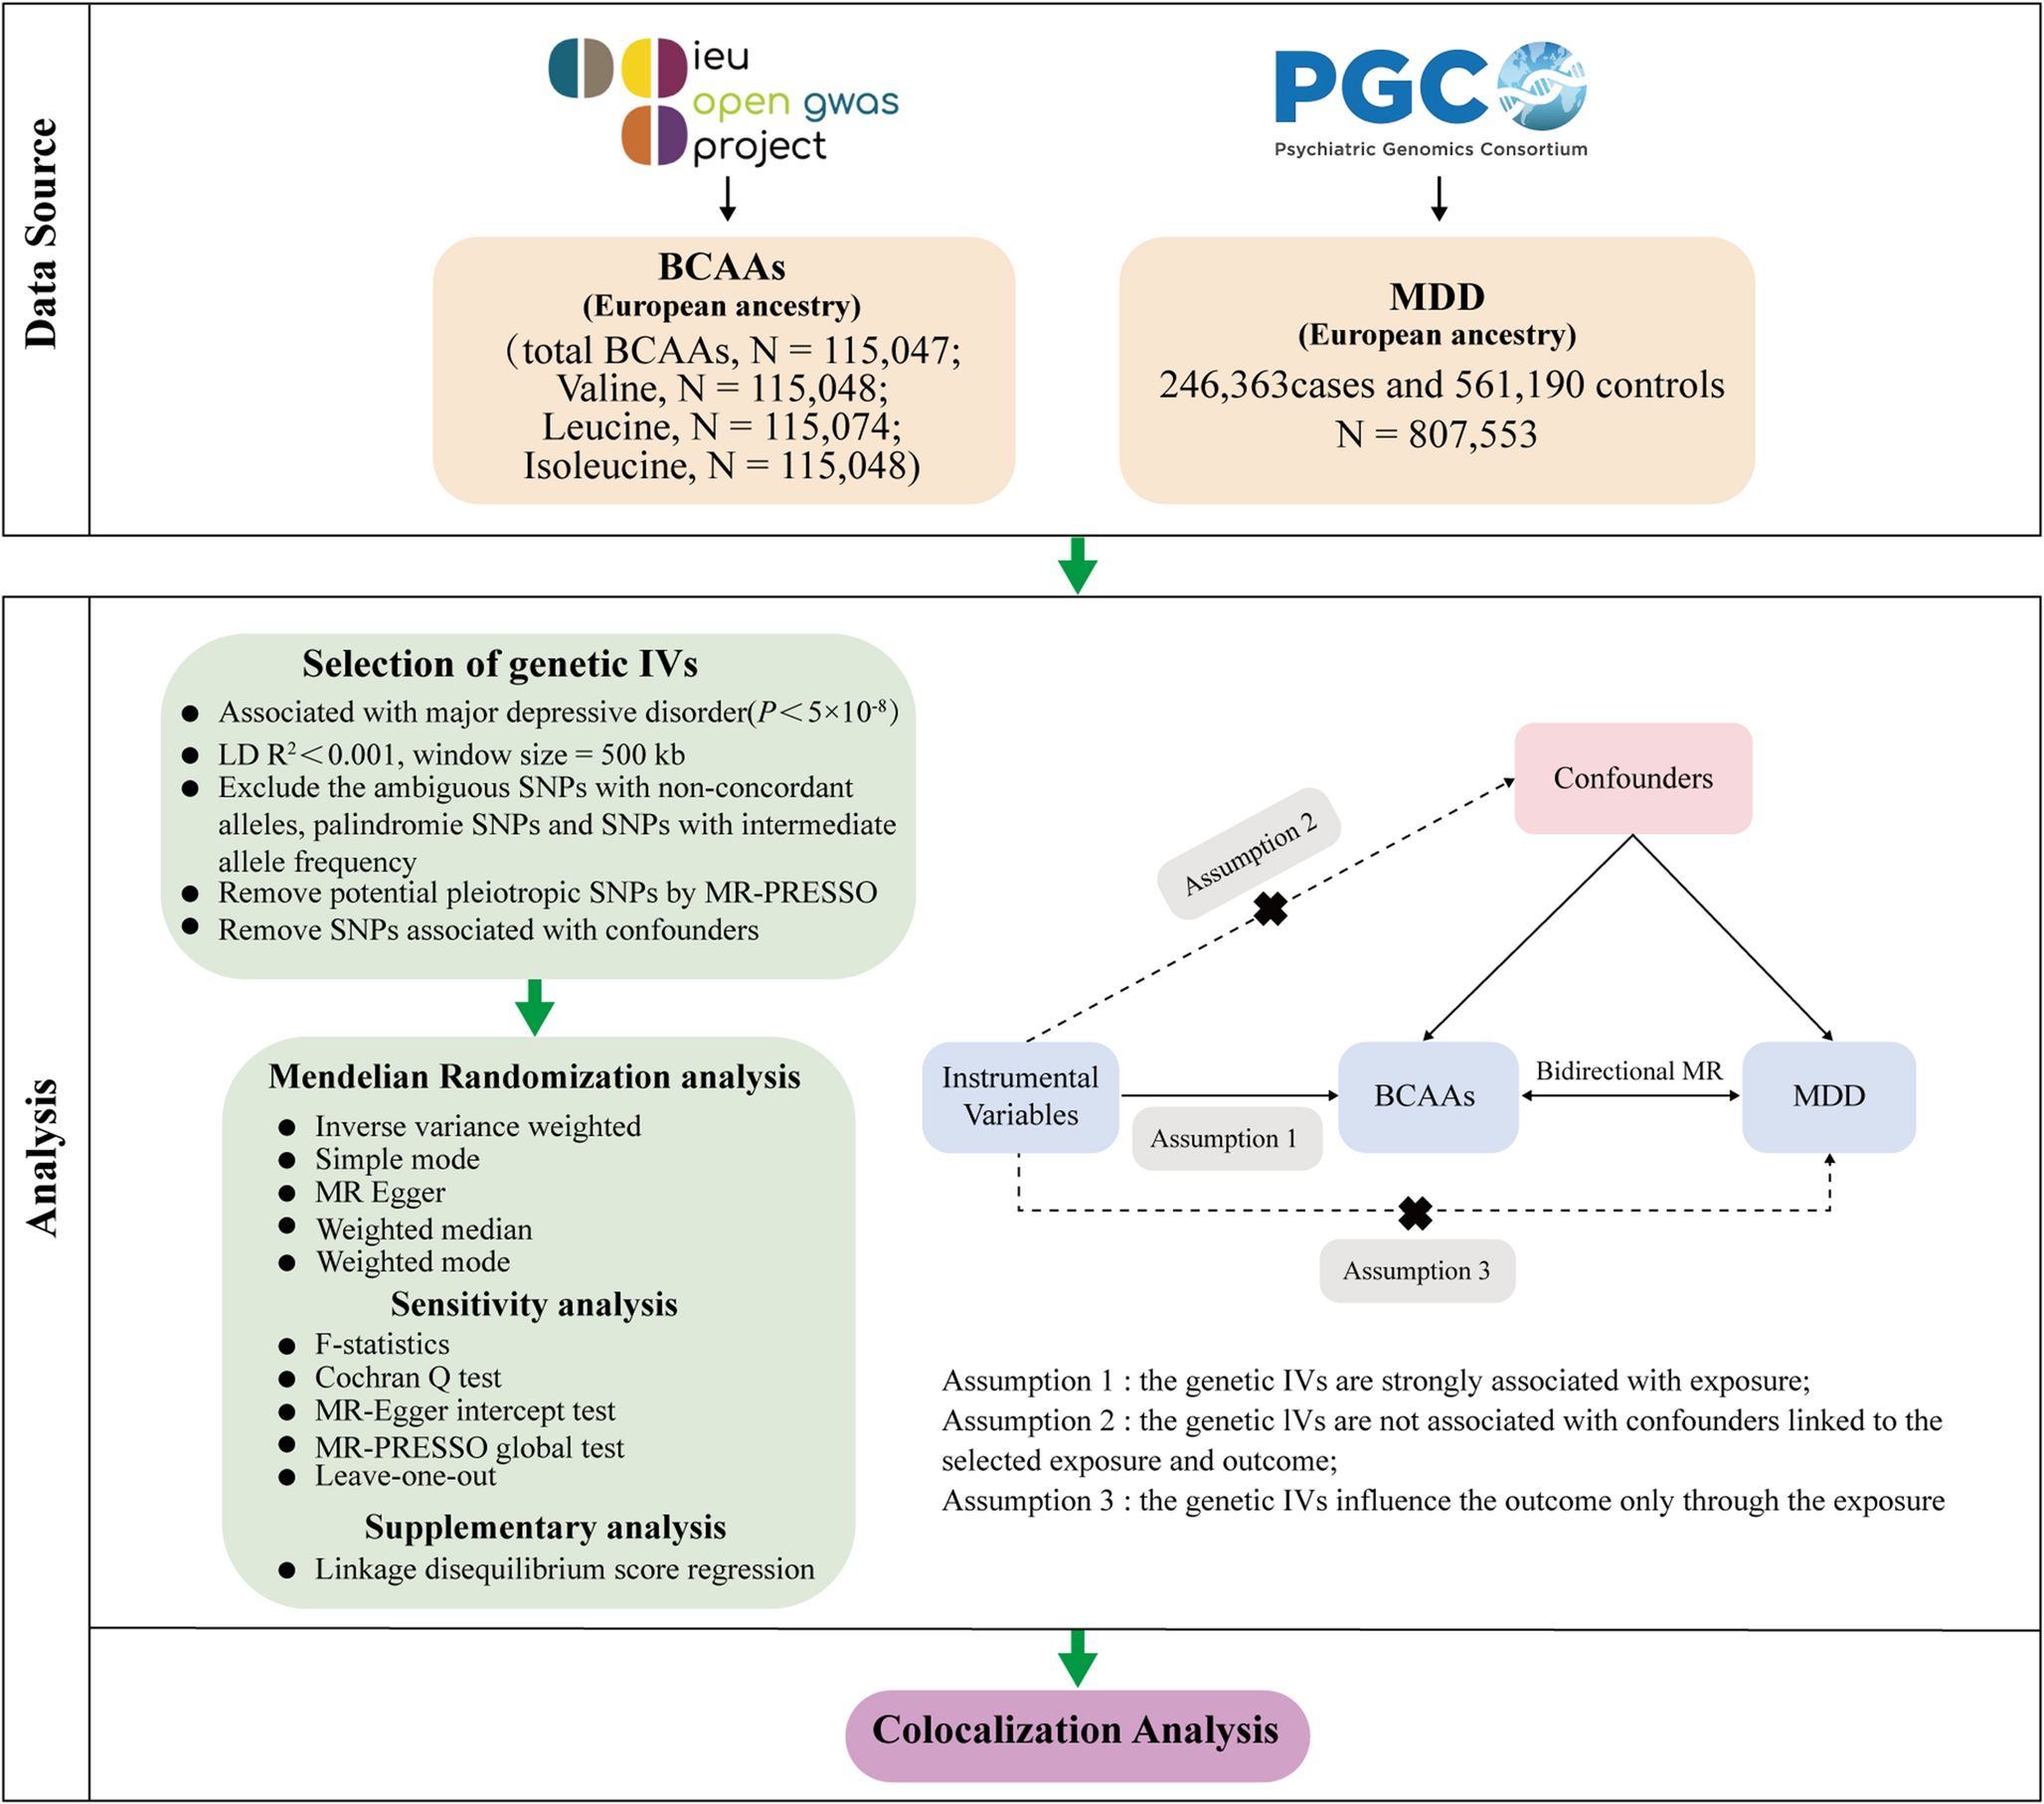
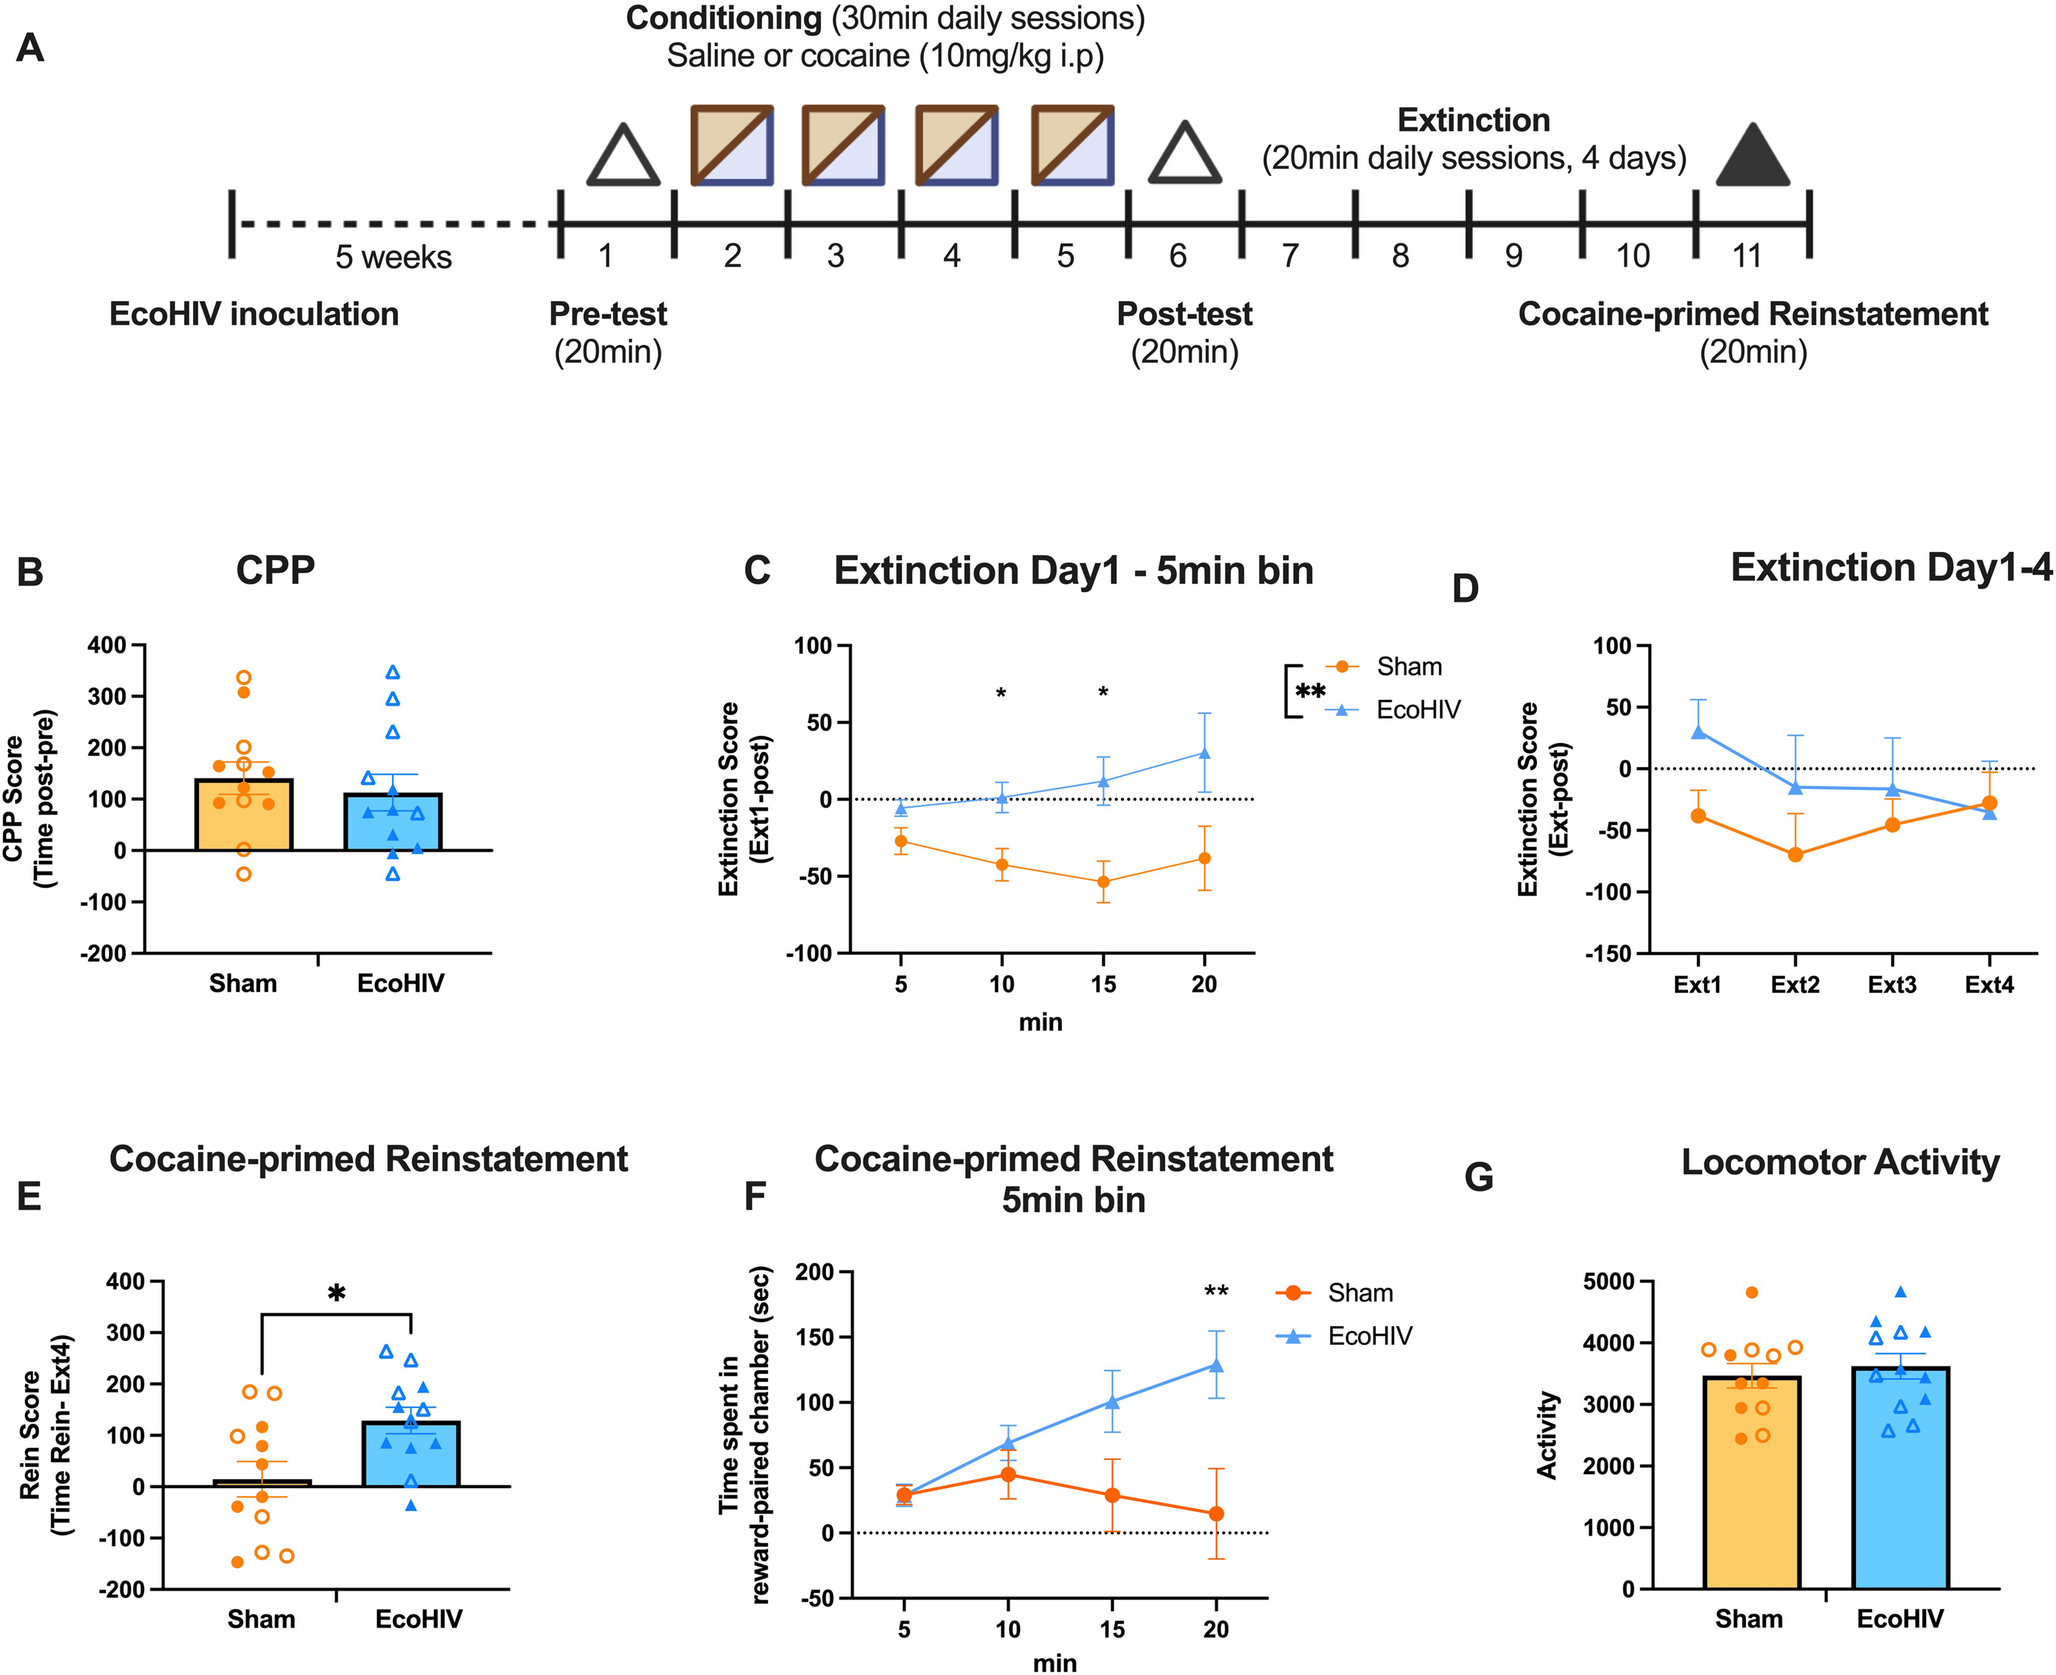
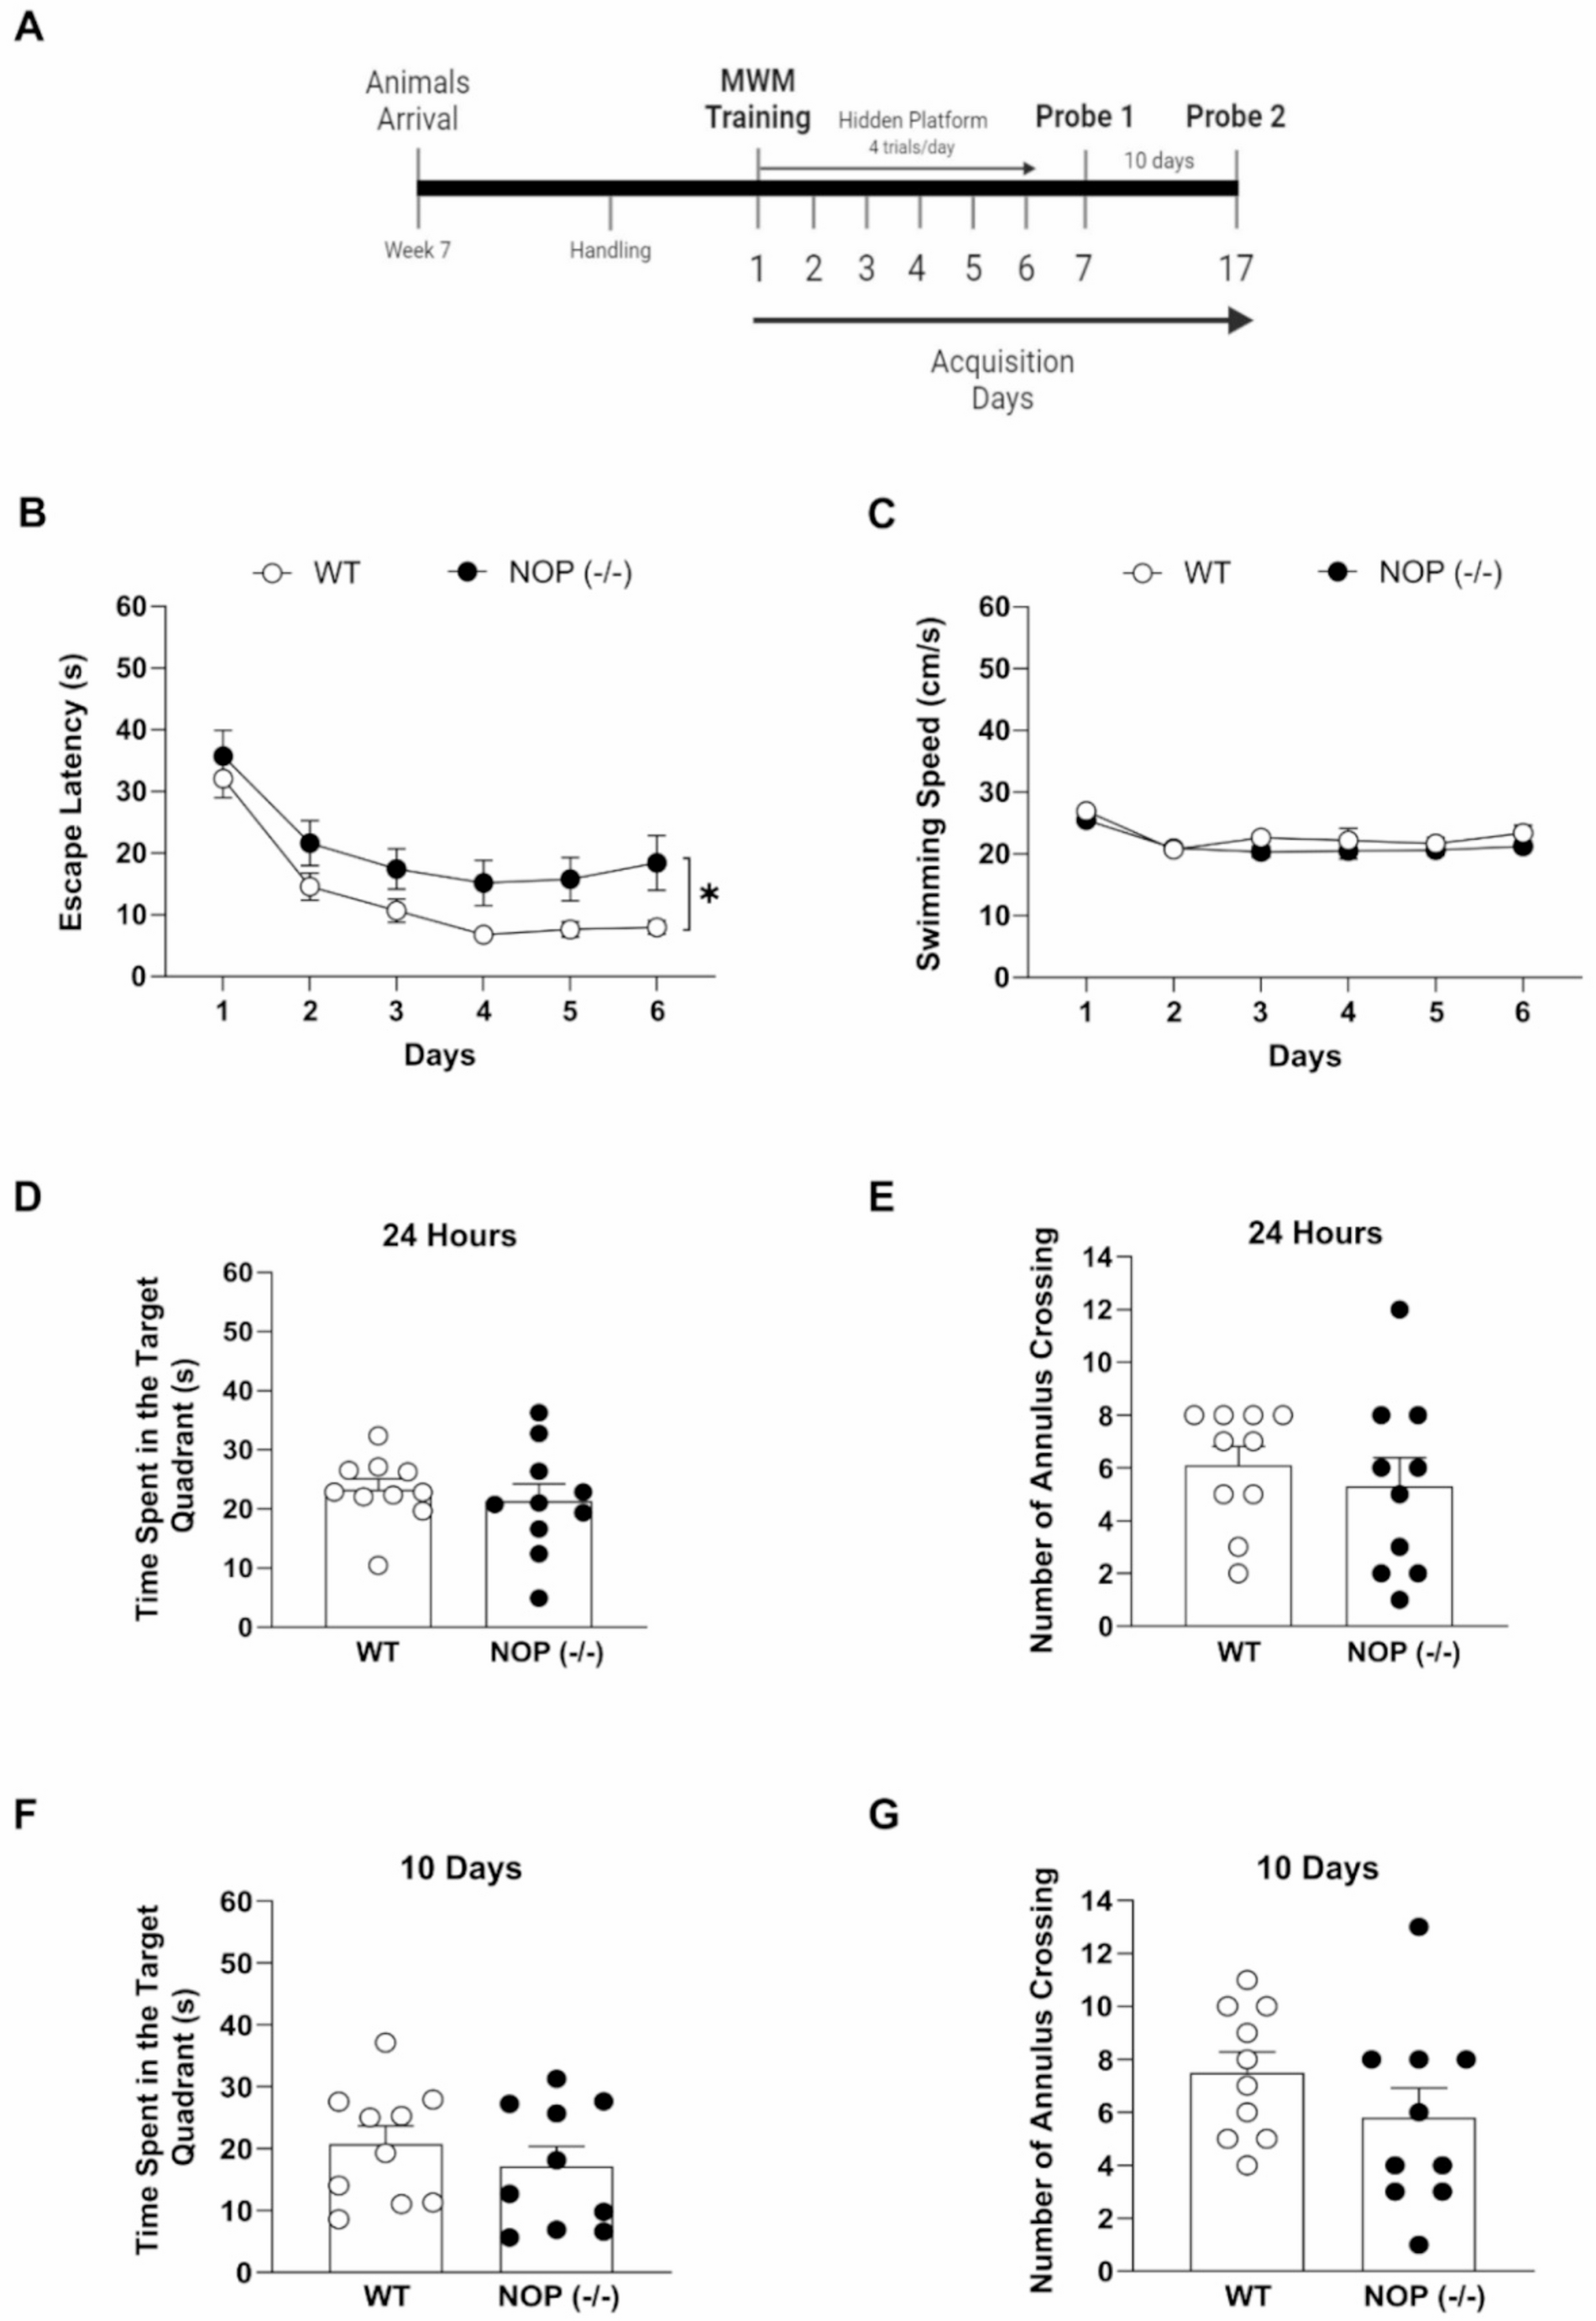
The experimental sample was composed of 20 healthy volunteers (age 18–65 years), native Italian language speakers (man = 11). Sample size was estimated with an a-priori analysis using G*Power 3.1 software (ANOVA: Repeated measures, within factors, α value: 0.05, power level 1-β: 0.80, effect size Cohen’s f: 0.3). The following exclusion criteria were applied: i), history of epilepsy or first-degree family members with epilepsy; ii), history of severe cardiovascular or chronic disease; iii), pregnancy; iv), presence of cardiac pacemaker or other metallic devices in the body; v), ongoing therapy with heart rate-altering drugs or with psychiatric drugs; vi), intake of psychoactive substances.
Instrument and softwareVR toolsWe used the HTC-Vive VR device, consisting of a Head Mounted Display (HMD), two controllers for interacting with the virtual environment, and two external infrared sensors.
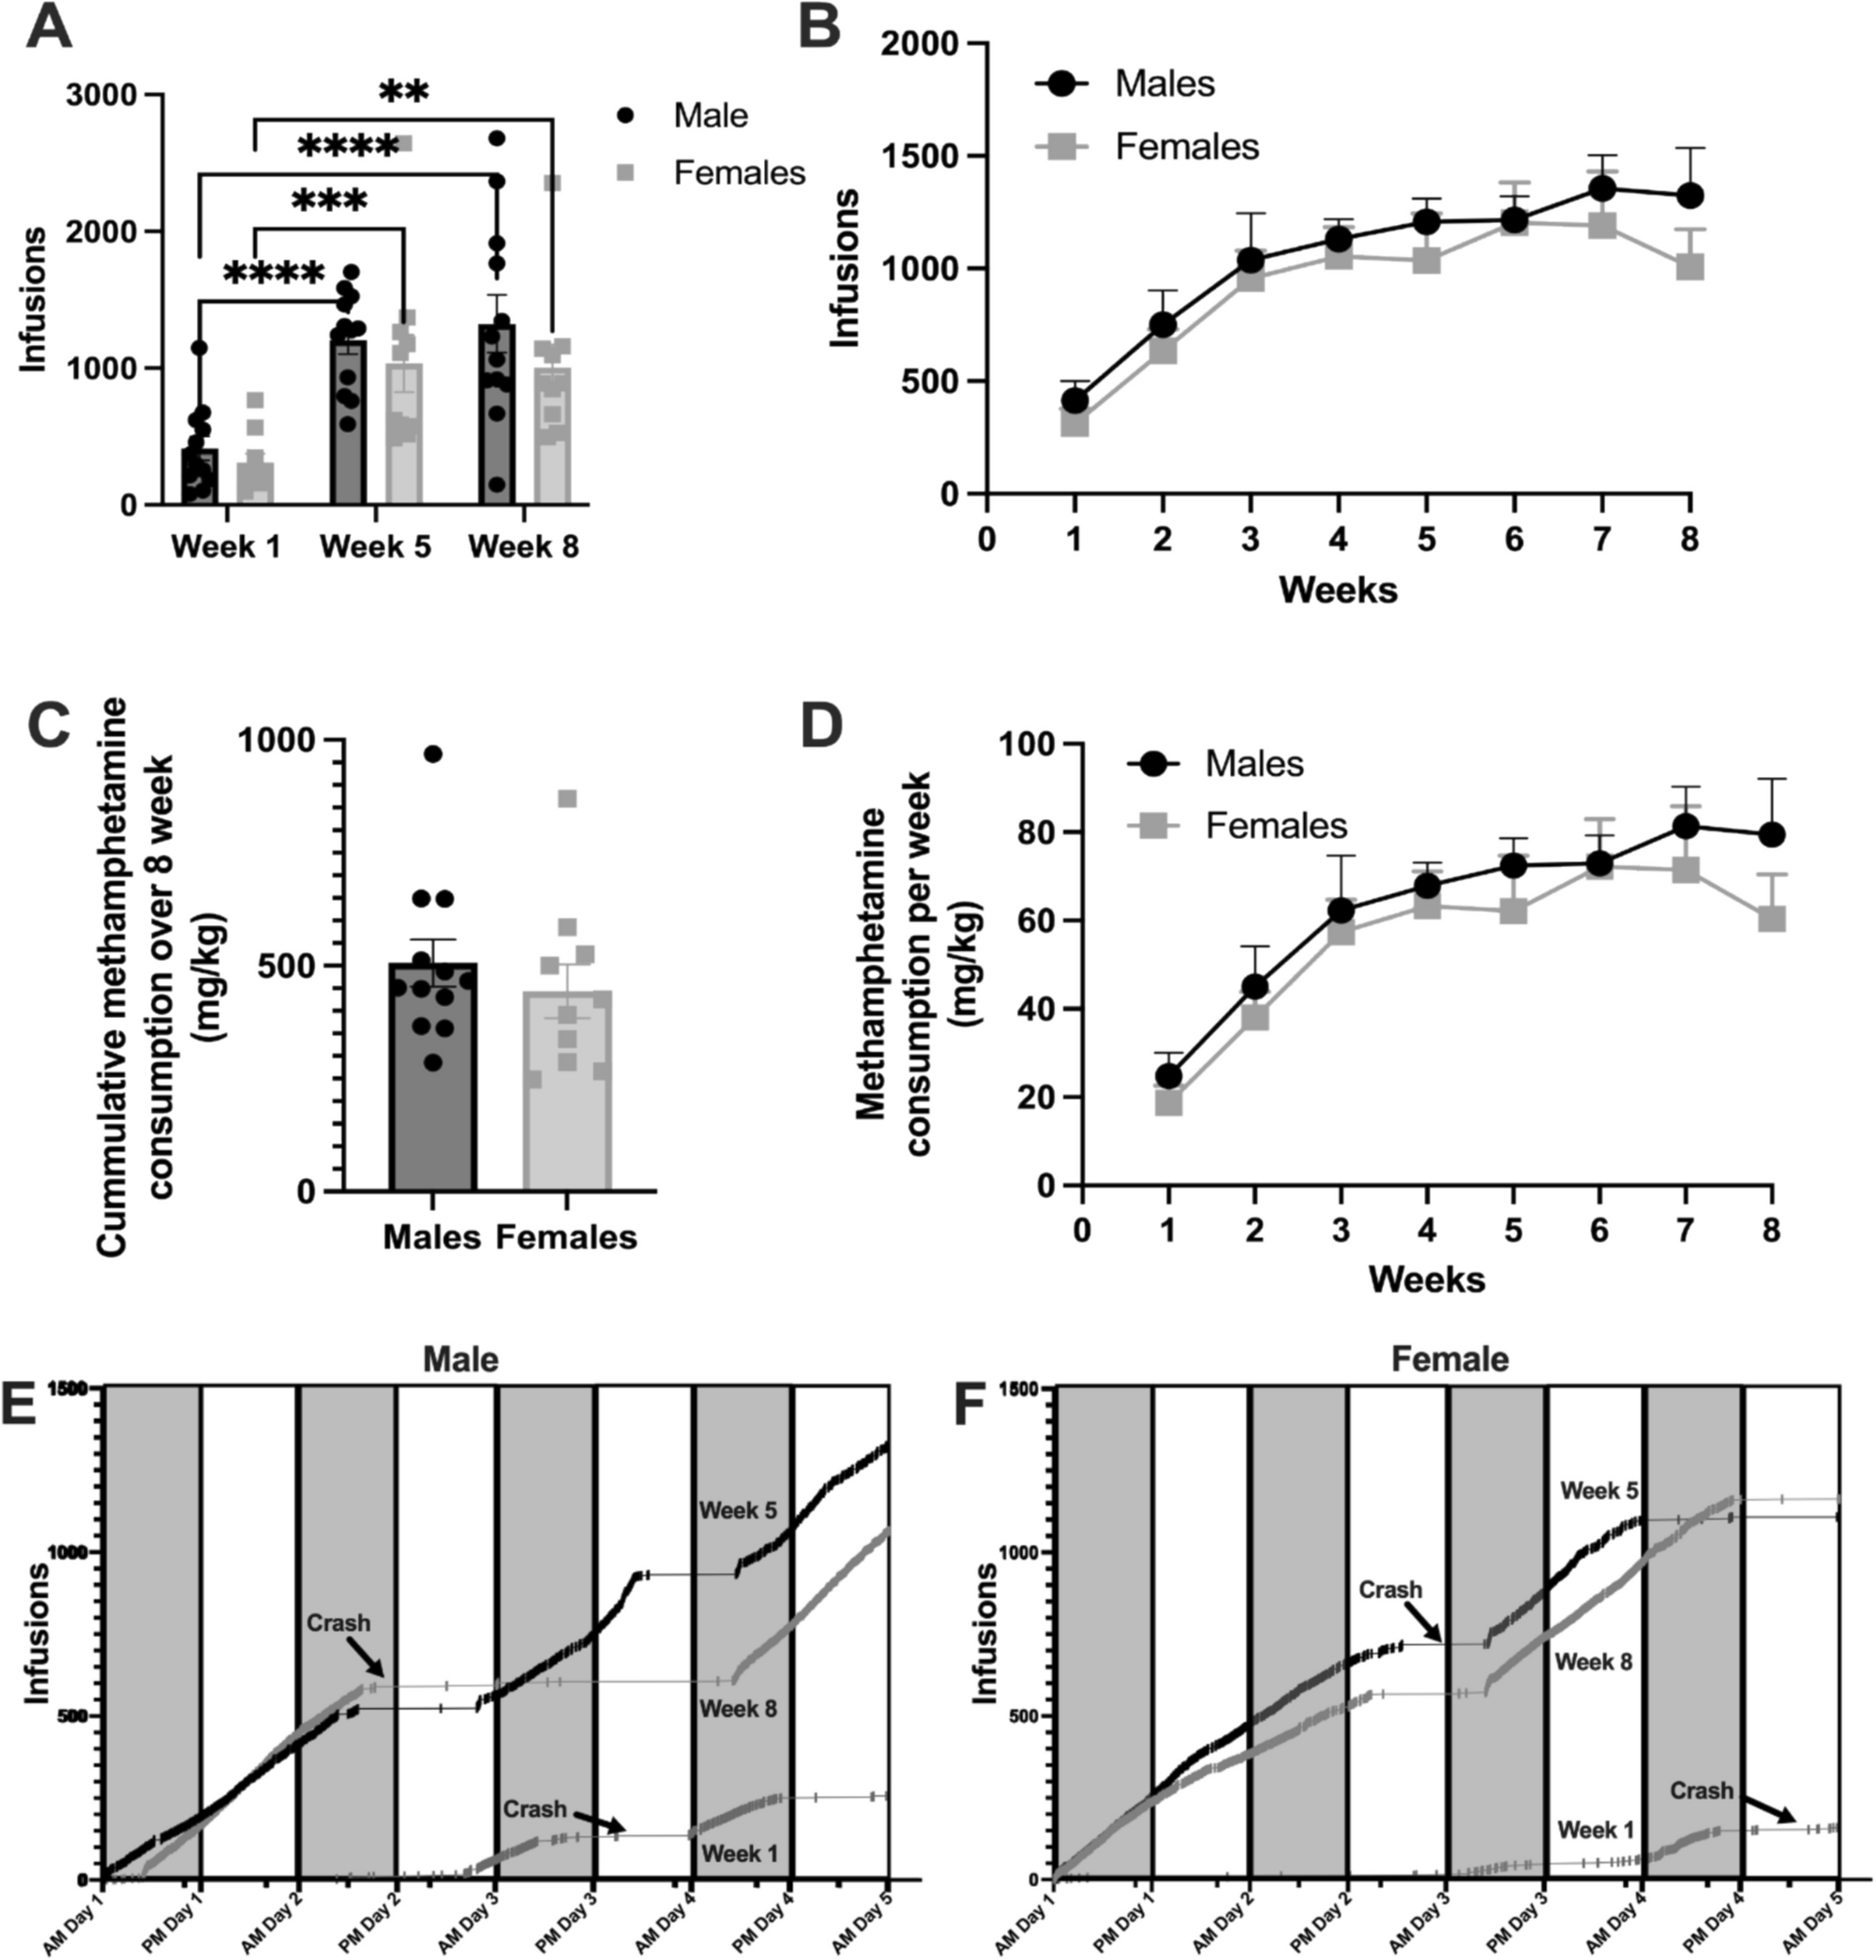
All VR scenarios were modelled with Blender 2.8 software and implemented in Unity 2017.4 and have been used in previous studies (Benvegnù et al. 2024, 2025). Three scenarios were used: i), a tutorial environment to familiarize participants with VR technology, consisting of a room with a graspable object (a cube); ii), VR Enriched Environment (EE; Fig. 1); and iii), VR Control Environment (CE). The EE scenario consisted of an indoor gray walls space environment divided into four compartments, containing materials to perform two cognitive and two motor activities. The cognitive activities consisted of (a), a shape-matching activity, including mental rotation, (b), a visuomotor activity of navigating a maze. The motor activities were (c), climbing a horizontal ladder and (d), climbing poles (Fig. 1). There was copyright-free, wordless music in the headphones. The CE scenario consisted of the same indoor gray wall space environment as the EE, but devoid of the interacting objects, thus allowing no interaction.
Fig. 1
Virtual reality scenarios. EE scenario a), a shape matching activity, b), navigating a maze, c), a horizontal ladder climbing activity, and d), pole climbing; CE scenario (e, f)
Instrumentation for HRV detectionThe Firstbeat Bodyguard 3 (Firstbeat, Finland), a wearable device (weight: 26 g, size: 54 mm. x 38 mm. x 7.7 mm) that records R-R interval data (sampling rate: 256 Hz) through two disposable chest electrodes placed on the heart and left fifth intercostal space, was used for HRV recording. After collection, the data were transferred to a computer using Firstbeat Bodyguard3 Exporter software, then cleaned and analyzed by using Kubios HRV standard software version 3.5.0.
Behavioral observation research interactive software (BORIS)BORIS (University of Torino) was used for visual quantification of participants’ behavior during the immersion in the VR environments, using the computer screen output that corresponded to what participants viewed through HMD. We measured two parameters during the EE scenario immersion, namely Deambulation and Interaction, while in CE scenario we only measured Deambulation (no interactive objects were present). Deambulation included teleporting by using hand controller into a participant-pointed white circle on the floor of the simulation. Interaction included manipulating yellow-colored objects in the virtual environment by grasping and throwing by pulling the trigger of the hand controller in the virtual environment. Two experimenters independently assessed the behavior of the participants. The measures collected were: a), number of Interaction or Deambulation events (number of event), b), average duration of single Interaction or Deambulation events (average duration), c), percentage of session time in Interaction or Deambulation (event % time).
MeasuresHRV indexesThe root mean square of successive beat-to-beat interval differences (RMSSD) was used as the time-domain index, which reflects the vagal regulation of HR and is little susceptible to respiratory influences. High frequency (HF, 0.15–0.4 Hz) and ratio of low frequency (LF, 0.04–0.15 Hz) to high frequency (LF/HF), measures of vagally mediated HRV and sympathetic-vagal balance, respectively, were used as frequency-domain indices. HF absolute power (in ms2) and LF/HF power ratio were extracted from HRV spectrum estimates using autoregressive (AR) modelling based spectrum estimation method.
MoodThe positive and negative mood associated with each virtual environment was measured after each scenario using ad hoc 10-point scales (0 = Strongly disagree, 9 = Strongly agree) built on the basis of the literature (Benvegnù et al. 2021, 2025) with items such as “I am happy, cheerful or satisfied”.
Pleasantness and arousalPleasantness and arousal elicited by the virtual scenarios were measured using ad hoc 10-point scales (0 = Not at all, 9 = Extremely) based on the literature (Vecchiato et al. 2015; Benvegnù et al. 2021, 2025) and characterized by items such as “Can you rate how much you liked this environment?“.
Immersion in VR environmentsThe degree of immersion elicited by each virtual environment was measured after each scenario using an ad hoc 10-point scale built on the basis of the literature (Vecchiato et al. 2015; Benvegnù et al. 2021, 2025), consisting of the item “To what extent did you feel immersed in the environment you just perceived?”.
Side effects associated with VR environmentsThe presence of symptoms associated with cybersickness was assessed using the Simulator Sickness Questionnaire (SSQ, Kennedy et al. 1993). The SSQ consists of 16 items (a list of symptoms such as “Fatigue,” “Headache” and “blurred vision.“), 4-point response scale (from “None” to “Severe”), and provides a total score and 3 subscales (Nausea, Oculomotor Disturbance, and Disorientation). Cronbach’s Alpha is 0.84.
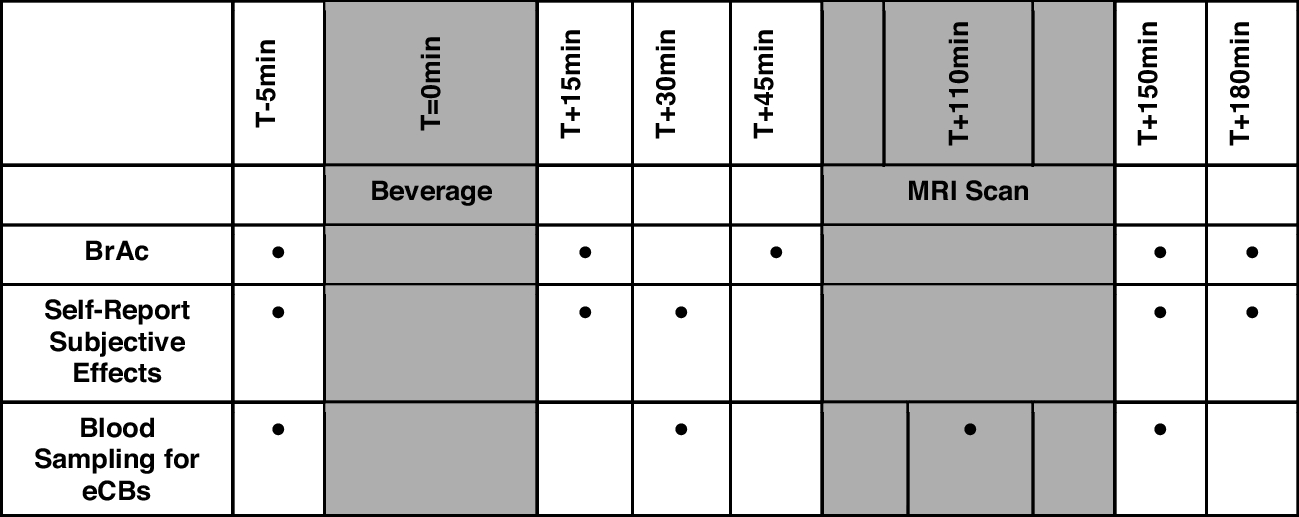
ProcedureVolunteers were asked not to take nicotine or caffeine during the hour prior to the study. All participants underwent an initial screening during which they received the necessary information and signed informed consent. HRV instrumentation was then applied to each participant. After 5 min of baseline recording, the participant was instructed on how to move around in a VR environment and how to use the controllers. To familiarize with VR, each participant was immersed in a training scenario for the duration of 1 min. Participants were then randomly assigned to either group A or group B and then immersed in EE and CE, for 5 min each, according to the order provided by their group. During the VR immersion, video recording was made of what the participant was seeing. Participants were not asked to perform specific tasks during immersion in virtual environments but were left free to move and grasp objects they found within the specific immersion condition. At the end of the baseline and each scenario, they filled out Numeric Rating Scales (NRS) to measure mood state, pleasantness, arousal and perceived immersion state. At the end of the experimental session, each subject also filled out the Simulator Sickness Questionnaire (SSQ) to check for any side effects associated with VR (Fig. 2).
Fig. 2
Schematic diagram of the protocol. Abbreviations: CE = Control Environment; EE = Environmental Enrichment; HRV = Heart Rate Variability; NRS = Numeric Rating Scale; SSQ = Simulator Sickness Questionnaire
Data analysisHRV data were continuously collected during immersion in virtual environments. Then, the RMSSD, HF and LF/HF were extracted at the baseline, and during the 5-minute time window spent by participants in the virtual EE and CE. Detection of outliers and artifacts was first performed by visual inspection, and when necessary, a correction algorithm was used in which artifacts were detected from a time series consisting of differences between successive RR intervals. For each participant on whom such correction was made, the percentage of corrected beats never exceeded 5% of the signal. In total, n = 77 beats were corrected. Data from one participant were excluded in the analyses of physiological indices because of insufficient signal quality.
HRV indexes were analyzed by One-Way repeated measures ANOVA (three levels: baseline, EE, CE) with Geisser-Greenhouse correction or nonparametric alternatives (Friedman test) in case of non-normal data (Shapiro-Wilk test). In case of significance, multiple within-group comparisons (with Holm-Šídák correction for ANOVA and corrected Dunn’s multiple comparisons test for Friedman test) were performed, with a focus on the key comparison between EE and CE. Confidence intervals of the post-hoc tests without the Holm-Šídák correction will be reported, as this correction adjusts the p-values of the individual comparisons to control the family -wise error rate (FWER) and does not allow for confidence intervals. The same analysis was conducted for mood state, pleasantness, and arousal. After verifying the non-normality of the data (Shapiro-Wilk test), the sense of presence and the BORIS measures of Deambulation were analyzed with Wilcoxon Signed Rank test, while SSQ was analyzed with one sample Wilcoxon Signed Rank test (comparison with scale median).
To test for associations between the different levels of response collected, Pearson or Spearman correlations (in case of non-normal data) were performed between self-reports and HRV indices and between self-reports and BORIS measures.
All statistical analyses were performed with GraphPad Prism version 9.1.0.
Comments (0)