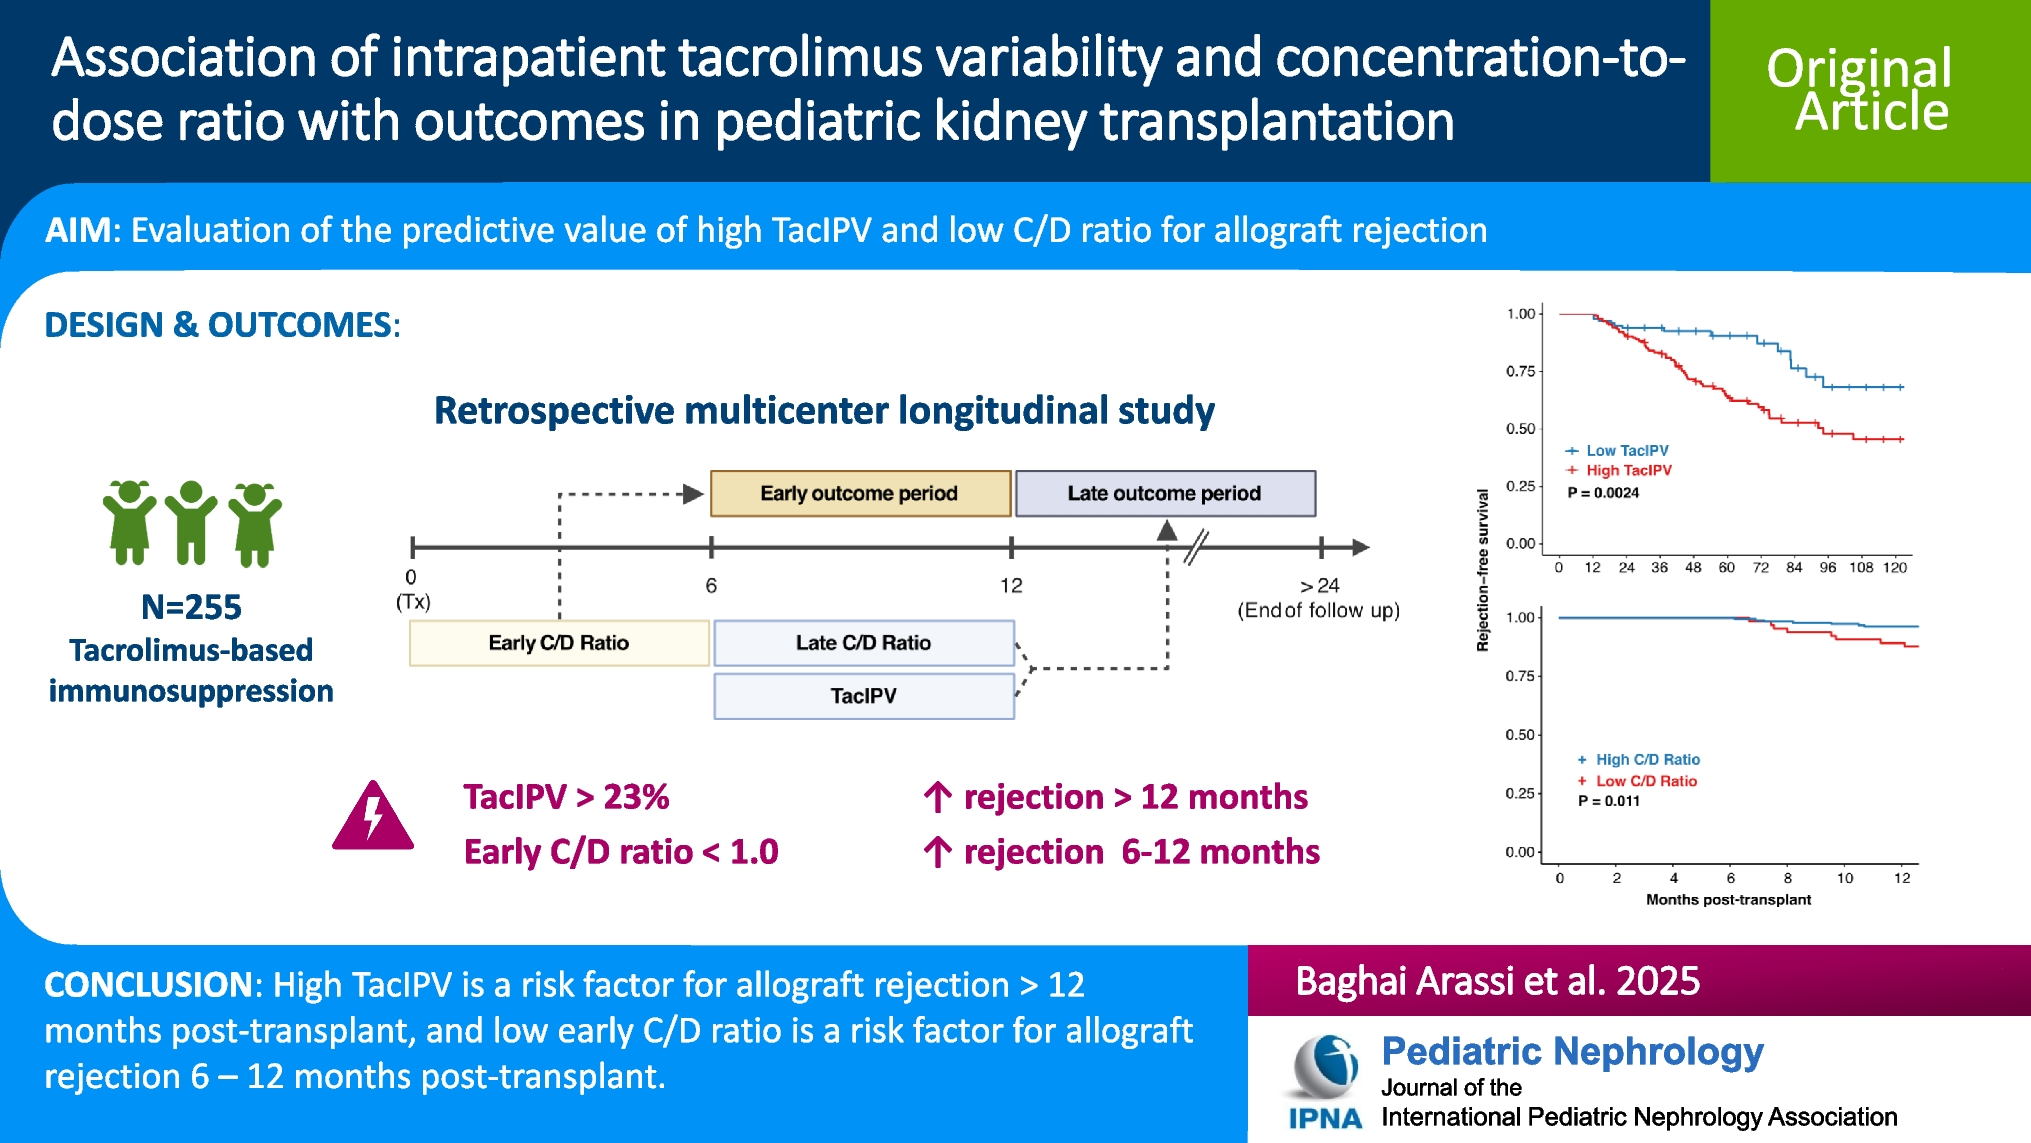
This multicenter study is the largest to date to examine the relationship between TacIPV, C/D ratio, and transplant outcomes in pediatric kidney transplant recipients. We found that high TacIPV is significantly associated with late allograft rejection occurring beyond 12 months post-transplant, while low C/D ratio is linked to earlier rejection episodes between 6 and 12 months. This is the first study to establish a pediatric-specific C/D ratio cutoff associated with rejection and the first multicenter study to demonstrate a consistent association between TacIPV and allograft rejection across pediatric transplant centers. Together, these findings suggest that TacIPV and the C/D ratio may serve as valuable non-invasive predictive markers to identify patients at risk for allograft rejection at different post-transplant times.
There is currently no consensus on the optimal statistical measures or time periods for quantifying TacIPV and C/D ratio, and standardization remains lacking. For TacIPV, coefficient of variation (CV%) is one of the most widely used approaches, particularly in pediatric transplantation studies [7, 20,21,22,23,24,25,26,27,28]. In our study, we found no meaningful difference between Tac CV% and Tac MAD in their association with allograft rejection. Regarding the C/D ratio, we applied BSA-correction, in line with previous work by our group [27] to ensure comparability with adult C/D ratio values. The ideal time for TacIPV and C/D ratio quantification has not been firmly established. For TacIPV, we focused on the 6- to 12-month post-transplant period [7, 8] as tacrolimus levels fluctuate substantially in the early post-transplant period, data on TacIPV beyond 12 months remain scarce, and tacrolimus trough levels in our cohort were largely stable during this interval. In contrast, previous studies, including our own [27], have assessed C/D ratio at earlier time points, as it is considered to be relatively stable soon after transplantation [10]. Nevertheless, both this study and others [29, 30] have shown that the C/D ratio increases over time. In our cohort, 23 patients shifted from the high- to the low-metabolizer group between early and late periods, with 14 of them having C/D ratios near the cutoff (0.8–1.2), indicating only marginal changes in metabolism. While the underlying mechanisms remain unclear, factors such as steroid dose reduction or complete withdrawal may influence tacrolimus metabolism, leading to changes in C/D ratio over time. This highlights the importance of considering the timing of C/D ratio assessment. The association between early C/D ratio and rejection risk was not observed with late C/D ratio, despite a higher number of events in the later follow-up period. This may reflect that early C/D ratios capture individual metabolic and immunological risk during the critical early post-transplant phase, while later rejection is likely influenced by additional factors such as immunosuppression tapering, variable adherence [26], or development of donor-specific HLA antibodies [31].
The determination of appropriate cutoff values for high TacIPV and low C/D ratio remains an area of active debate. Nonetheless, our cutoff values for both TacIPV and C/D ratio are well within previously reported ranges for both adult and pediatric kidney transplant recipients. Previously published TacIPV thresholds, derived from Tac CV% in both pediatric and adult kidney transplant studies, generally fall between 20 and 40% [21,22,23, 26, 32,33,34,35,36]. For C/D ratio, reported values range from 0.7 to 1.8 [9,10,11,12, 24, 37,38,39,40,41,42], with 1.0 being the most widely used cutoff. Cutoffs in previous studies were determined empirically, based on distribution measures (e.g., quartiles, tertiles, or median) or statistical methods. Each statistical method and time period of quantification has its strengths and limitations. Given the long and variable follow-up period in our study, we chose a cohort-independent approach based on minimization of log-rank P values. This method accounts for differences in follow-up time and ensures that the cutoff reflects its prognostic significance for rejection events rather than being solely arbitrarily selected.
We report the number of rejection episodes for the entire follow-up period of median 5.0 years (IQR, 3.0–7.5 years) (see Table 1), and we report all rejection types. While most studies report acute rejection rates of 10–25% within the first year post-transplant [27, 43,44,45], long-term data are limited. One study reported a 5-year acute rejection rate of 39% in pediatric recipients [43]. Excluding the 28 patients in our cohort who experienced chronic rejection episodes or rejection episodes after more than 5 years brings our observed rejection rate of 34% within the reported range by other investigators. In contrast, the comparatively low number of patients with graft dysfunction likely reflects the stricter definition we applied, which required a sustained eGFR < 30 mL/min/1.73 m2 or a > 50% decline from baseline eGFR at 3 months post-transplant. This approach was chosen to avoid capturing transient dysfunction (e.g., due to infection). eGFR values > 120 mL/min/1.73 m2 at 3 months were capped to control for early hyperfiltration in young recipients having received a kidney transplant from an adult donor.
Both C/D ratio and TacIPV have been shown to vary with age, with younger children typically exhibiting higher variability and lower C/D ratios. Several factors may contribute to age-related differences in tacrolimus exposure, including developmental differences in metabolism [46], more frequent dose adjustments due to infections [19, 47] (especially diarrhea, which can paradoxically increase exposure), inflammation [48], age-related variation in gut microbiota [49], and differences in tacrolimus formulation [14]. In our cohort, younger children more often received the liquid formulation, which is associated with slightly higher bioavailability. However, this does not explain their lower C/D ratios, suggesting increased tacrolimus metabolism in this age group. To account for age as a potential confounder, it was included in our multivariable Cox regression models (Supplementary Table S2). It was excluded from the final C/D ratio model by forward selection and remained in the TacIPV model without reaching statistical significance. Therefore, we found no clear evidence that age-stratified cutoffs would improve the predictive performance of these markers. Moreover, the limited number of events, particularly during early follow-up, precluded meaningful stratified cutoff determination and testing. Future studies are warranted to further explore the complex relationship between age, tacrolimus metabolism, and transplant outcomes.
Our study has several limitations. As a retrospective registry-based investigation, it does not permit direct causal relationships to be established between tacrolimus exposure, the factors influencing it (including therapy adherence) and transplant outcomes. Moreover, the limited granularity of our data hindered detailed analysis of infections such as BK polyomavirus, Epstein-Barr virus, and CMV, which were documented solely as binary variables. Nevertheless, other CERTAIN registry studies have explored post-transplant opportunistic infections in greater depth, utilizing study-specific electronic case report forms to offer a more detailed reference on this topic [18, 31, 50, 51]. Additionally, this cohort may not fully represent the broader population of kidney transplant recipients during the study period, as patients with incomplete or missing tacrolimus monitoring data were excluded. This exclusion, which may have involved patients receiving non-tacrolimus immunosuppressive regimens or those with insufficient documentation, could have contributed to an underestimation of certain clinical outcomes, such as new-onset diabetes mellitus, especially among individuals who discontinued tacrolimus due to adverse effects. In addition, as most patients in our cohort were of Caucasian descent, where CYP3A5 expressers are less common [52], the findings may not fully generalize to more diverse populations. Despite these limitations, our findings support the potential utility of TacIPV and C/D ratio as markers for identifying patients at increased risk of allograft rejection, which could guide individualized follow-up and monitoring strategies.
In conclusion, this study, the largest to date on the relevance of TacIPV and C/D ratio in pediatric kidney transplant recipients, identifies high TacIPV and low C/D ratio as significant risk factors for allograft rejection. TacIPV and C/D ratio may serve as cost-effective, non-invasive predictive markers for early identification of patients at risk for rejection. In patients with highly variable tacrolimus trough levels and low C/D ratios, potential causes of high TacIPV and increased tacrolimus metabolism should be investigated and addressed to reduce the risk of rejection and improve long-term graft outcomes.

Comments (0)