hESC-MSC culture
The hESC-MSCs were obtained from the Stem Cell Unit, College of Medicine, King Saud University, Riyadh [17]. All media, serum and other reagents used for cell culture were obtained from Gibco (Gibco, Thermo Fisher Scientific, Waltham, MA, USA). All plasticware used during this study was obtained from Thermo (Thermo Fisher Scientific, Waltham, MA, USA). hESC-MSCs were maintained in full culture medium (FCM) with high-glucose DMEM supplemented with 10% fetal calf serum, 1% essential amino acids and 1% antibiotic–antimycotic solution (Gibco, Thermo Fisher Scientific, Waltham, MA, USA) and incubated at 37 °C in a humidified atmosphere containing 5% CO2. Semiconfluent cells were harvested by incubation with 0.25% trypsin in 0.01% ethylenediaminetetraacetic acid solution at 37 °C for 3–5 min. The trypsinization reaction was stopped by the addition of FCM. The cells were centrifuged at 500 × g for 10 min at room temperature. Then, the cell pellet was resuspended in FCM, after which the cells in the suspension were seeded into 48-well plates at 4 × 10⁴ cells/well and incubated at 37 °C.
Low-level laser irradiation
The hESC-MSCs were divided into two groups: nonirradiated (control) and irradiated groups. The hESC-MSCs in the irradiated groups were irradiated by means of LLBL at different energy densities, such as 0.5, 1.0, 1.5, 2.0, 2.5, 3.0, 3.5, 4.0, 4.5–5.0 J/cm2, for 20 to 200 s, as described in previous publications [18,19,20,21]. The output power density of LLBL was 25 mW/cm2 during all experiments because it had been optimal for the photobiostimulation of cell proliferation in our laboratory. Briefly, hESC-MSCs were plated in 48-well plates and incubated overnight as described above.
The hESC-MSCs were irradiated only once. Nonirradiated hESC-MSCs were maintained under the same conditions as irradiated hESC-MSCs, such as the replacement of FCM with phosphate-buffered saline (PBS), and room temperature during irradiation. The medium was replaced with sterile PBS to minimize the loss of laser energy due to absorption by the red component of the FCM. Beam has 1 mm diameter. Irradiation area was 10 mm, which is almost equal to surface of each well in the 48-well plate as explained in our previous publications [20, 21]. To avoid the effects of second-order variables, such as quantification and properties, we maintained the cells in all the experimental groups, including the control group, under the same environmental conditions, such as temperature, humidity, and light. After irradiation, the irradiated and nonirradiated hESC-MSCs were maintained in fresh FCM and incubated as described above. All irradiation experiments were performed in triplicate, and the average value for each hESC-MSC group was calculated for analysis.
Cell proliferation analysis
The effect of LLBL irradiation on hESC-MSC viability was assessed by a 3-[4,5-dimethylthiazol-2-yl]-2,5-diphenyltetrazolium bromide (MTT) assay. Specifically, hESC-MSCs were seeded in 48-well plates and incubated overnight. Then, the cells were irradiated and incubated. At the end of 72 h, hESC-MSCs were incubated with 100 µl/well of MTT (0.5 mg/ml in PBS) for 2 h under the same conditions. Then, the MTT solution was replaced with an equal volume of isopropanol for 45 min, and the absorbance at 549 nm was read by a microplate reader (BioTek, USA) [20, 22].
Cell viability rate
The effect of LLBL on hESC-MSC viability was determined by counting the number of viable cells via the trypan blue exclusion assay (Trypan blue solution, Sigma Aldrich Company, Ltd Irvine, Ayrshire, UK). For evaluation of hESC-MSC viability, cells were seeded in 48-well plates and incubated overnight. Then, the cells were irradiated with LLBL and incubated. At the end of 72 h, the hESC-MSCs were washed with PBS and harvested by gentle trypsinization at a constant volume of 0.1 ml, mixed with an equal volume of trypan blue and loaded into a hemocytometer chamber for cell counting. Then, viable (unstained) and nonviable (stained) cells were counted, with three separate counts performed for each well [20]. The numbers of viable and nonviable cells in the irradiated and nonirradiated groups were compared, and graphs showing the cell viability data were generated.
Cell migration assay
The effect of LLBL on hESC-MSC migration was assessed in vitro via a wound healing “scratch” assay [23, 24]. The hESC-MSCs were seeded and incubated overnight. Then, a sterile 200-µl pipette tip was used to create a scratch in the cell monolayer, and the cells were irradiated with LLBL. The cell debris was removed by changing the media, and the cells were further incubated. At 72 h after the scratch was made and irradiation was completed, images were captured to evaluate the number of cells within the scratch zone as an indicator of the level of cell migration. Images were taken using a charge-coupled device camera (IX2-SL, Olympus, Japan) attached to an inverted phase-contrast microscope (Model No. IX51, Olympus, Japan) at a power of 10×. For statistical analyses, images were taken from three separate “scratch areas” at the same magnification. At the end of the experiments, the images were compared to the number of migrated hESC-MSCs in the “scratch area”, and the cell migration data were plotted in graphs. All assays were performed in triplicate on at least two separate occasions.
Analysis of OB differentiation
The characteristics of hESC-MSCs [17] are similar to those of primary hMSCs in terms of their cellular and molecular phenotypes. The hESC-MSCs were cultured in DMEM supplemented with 0.25 mol/l D-glucose, 0.004 mol/l L-glutamine, 0.006 mol/l sodium pyruvate, 10% FBS, 1× penicillin‒streptomycin (pen-strep), and nonessential amino acids (Gibco-Invitrogen, USA). The cells were grown to 70–80% confluence in FCM at a concentration of 50,000 cells/ml. For OB induction, FCM was replaced with OB differentiation medium supplemented with a cocktail of 10% FBS, 1% pen‒strep, 0.003 mol/l L-ascorbic acid (Wako Chemicals, Germany), 0.01 mol/l β-glycerophosphate (Sigma, Germany), 1e8 mol/l calcitriol (1α,25-dihydroxy vitamin D3; Sigma), and 1e-8 mol/l dexamethasone (Sigma). OB differentiation was performed in 48-well plates to induce hESC-MSC differentiation toward the OB lineage. We treated cells with LLBL at an energy density of 0.5, 1.0–2.0 J/cm2 with the control. After treatment with LLBL, OB differentiation medium was added to each well of hESC-MSCs, and 48-well plates were incubated for 10 days. The OB differentiation media were replaced three times per week, and the conditions were maintained for 10 days [17]. The differentiation process was monitored by measuring alkaline phosphatase (ALP) activity.
Quantitative ALP activity
To accurately measure ALP activity after OB differentiation, we utilized the ALP Activity Colorimetric Assay Kit from BioVision, Inc. (California, USA) with modifications. On the day designated for analysis, each well was gently washed with PBS to remove any unbound cells or debris. Subsequently, 50 µl of the provided p-nitrophenyl phosphate (pNPP) substrate solution was dispensed into each well. The plates were then shielded from light and incubated for 2 min at room temperature for the enzymatic reaction. After incubation, the optical density (OD) of the resultant product was measured at a wavelength of 405 nm with a spectrophotometer designed for microplate readings.
Flow cytometry
Flow cytometric analysis was conducted with single cells derived from both the LLBL-treated populations and the LLBL-untreated controls. Following LLBL, the cells were dissociated using trypsinization and subsequently neutralized with 10% serum. The cells were then resuspended in fluorescence-activated cell sorting (FACS) buffer (PBS [Invitrogen] supplemented with 1% Fetal bovine serum) at an approximate density of 1 million cells/ml. For the immunophenotyping of each MSC marker, we allocated approximately 100,000 cells for staining with each specific antibody. We utilized a panel of antibodies, including CD14APC, CD29PE, CD31FITC, CD34FITC (from DAKO), CD44PE, CD73PE, and CD146PE. The corresponding isotype control antibodies, IgG1-FITC, IgG1-PE, and IgG-APC, were obtained from BD Biosciences (San Diego). The cells were stained with the indicated antibody at a 1:10 dilution in FACS buffer for 30 min on ice. After two washes in FACS buffer, the cells were resuspended in the same buffer. A minimum acquisition of 10,000 events per sample was achieved using a FACSCalibur flow cytometer from BD Biosciences. Data analysis was carried out with CellQuest Pro® software.
Quantitative real-time PCR (qRT‒PCR)
Total RNA was isolated from nonirradiated and irradiated hESC-MSCs using an innuPREP RNA Mini Kit (Analytik Jena, Germany, REF No: 845-KS-2040250) according to the manufacturer’s protocol. The concentration and purity of the extracted RNA were assessed with a NanoDrop spectrophotometer (NanoDrop 2000, Thermo Fisher Scientific, USA). We synthesized complementary DNA (cDNA) from 1 µg of total RNA using a High-Capacity cDNA Reverse Transcription Kit (Applied Biosystems, USA), a ProFlex RT PCR system and a Multigene thermal cycler according to the manufacturer’s instructions.
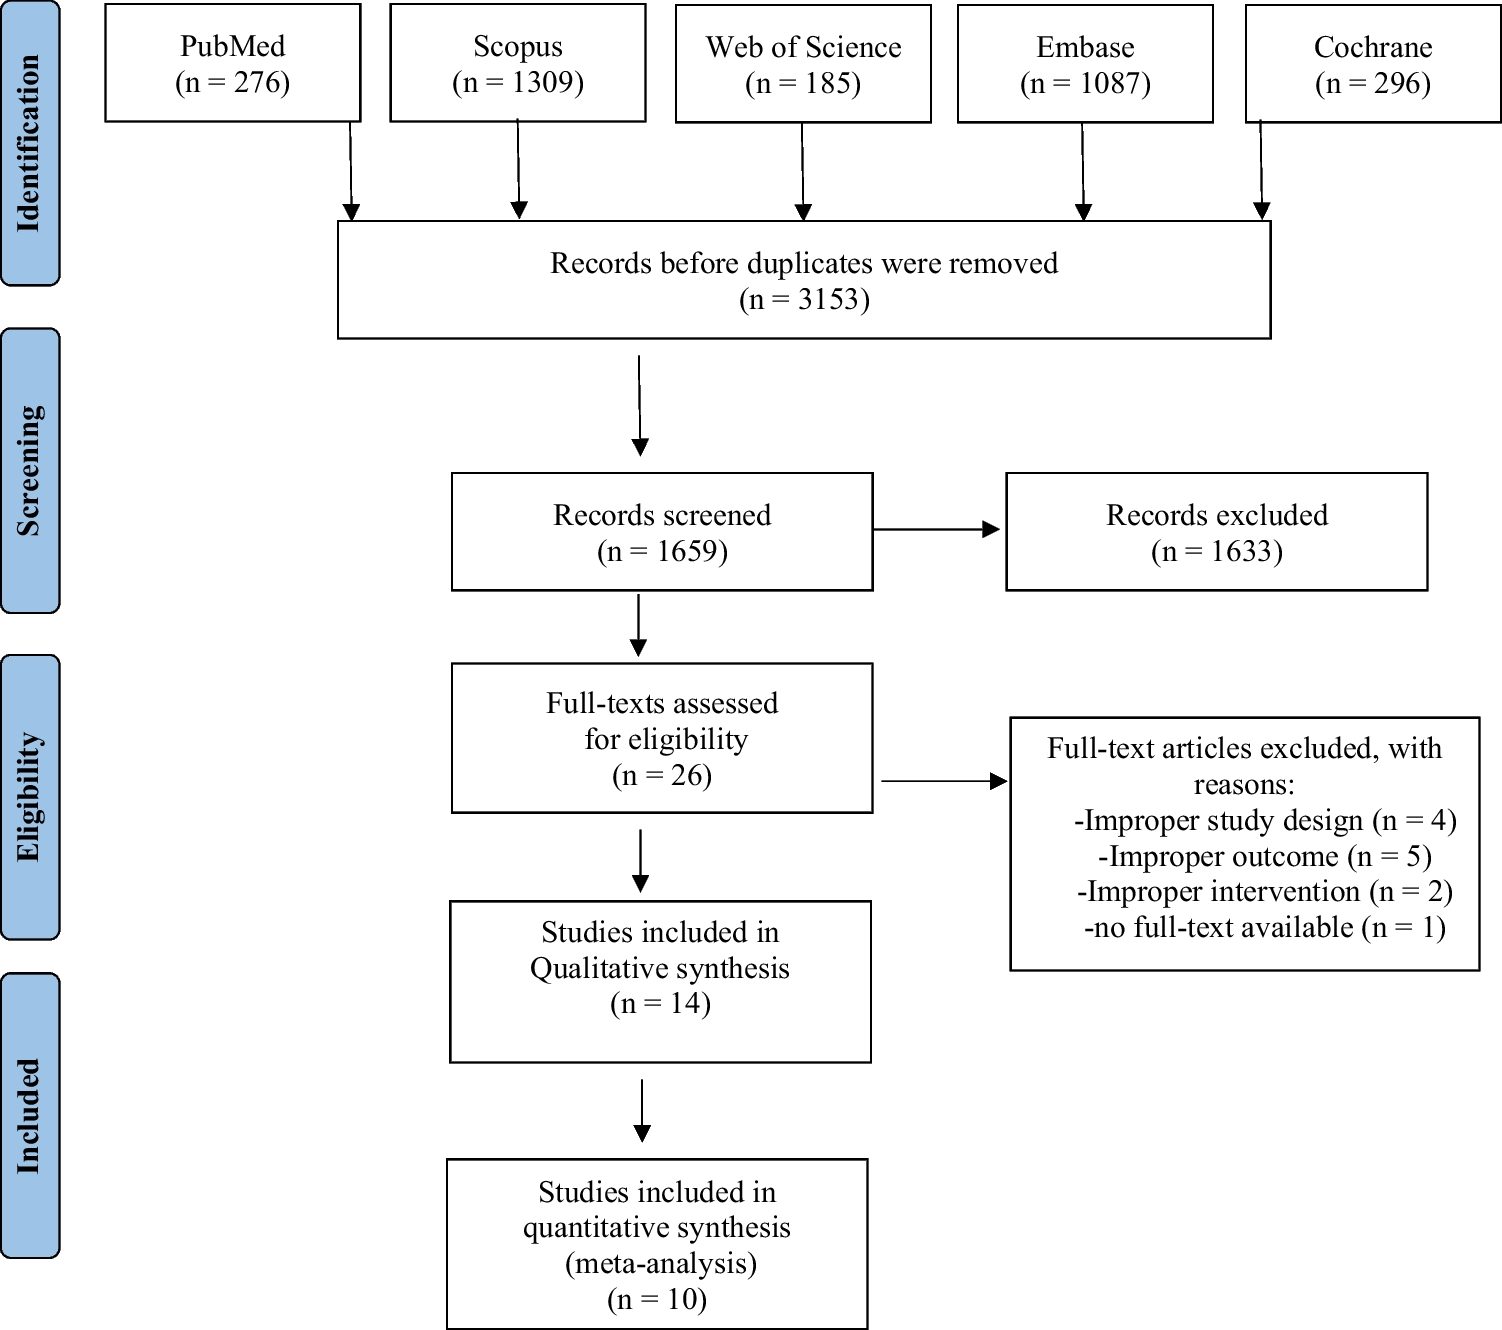
For analysis of mRNA levels, RT‒PCR was performed with cDNA samples utilizing the Applied Biosystems Real-Time PCR Detection System and the Fast SYBR Green PCR Kit (Applied Biosystems, UK), again following the manufacturer’s detailed protocol. Gene expression was standardized against the expression of the housekeeping gene GAPDH. We used the comparative cycle threshold (CT) method to determine relative expression levels, where ΔCT represents the difference in CT values between the target and reference genes. Experimental details used in this study are showing in flowchart Fig. 1.
Statistical analysis
One-way analysis of variance (ANOVA) was used for comparisons of continuous data, which are presented as the mean ± SD, with Tukey’s HSD test used for post hoc analysis (GraphPad Prism, version 4.0, San Diego, CA, USA). A P value < 0.05 was considered to indicate statistical significance. We performed student t-test for FACS & PCR data and graphs were prepared using Microsoft excel.


Comments (0)