
Remember me


To explore the cellular composition and states at the lesions of different types of cicatricial alopecia, we selected seven patients with untreated and histopathologically confirmed cicatricial alopecia, including lichen planopilaris (LPP, corresponding to primary cicatricial alopecia, n = 4) and localized scalp scleroderma (LS, corresponding to secondary cicatricial alopecia, n = 3). Fresh tissue samples from the lesion areas with retaining hairs were collected. Additionally, fresh samples from the perilesional tissue of two patients undergoing scalp nevus excision surgery were collected as a control group (Ctrl, n = 2). These two patients had no history of hair loss disorders (see Table S1). All patients with alopecia underwent trichoscopic examination and localization before sampling. For all samples, a 4 mm punch biopsy was performed, followed by digestion, filtration, and preparation of single-cell suspensions for single-cell sequencing using the 10x Genomics platform (see Fig. 1).
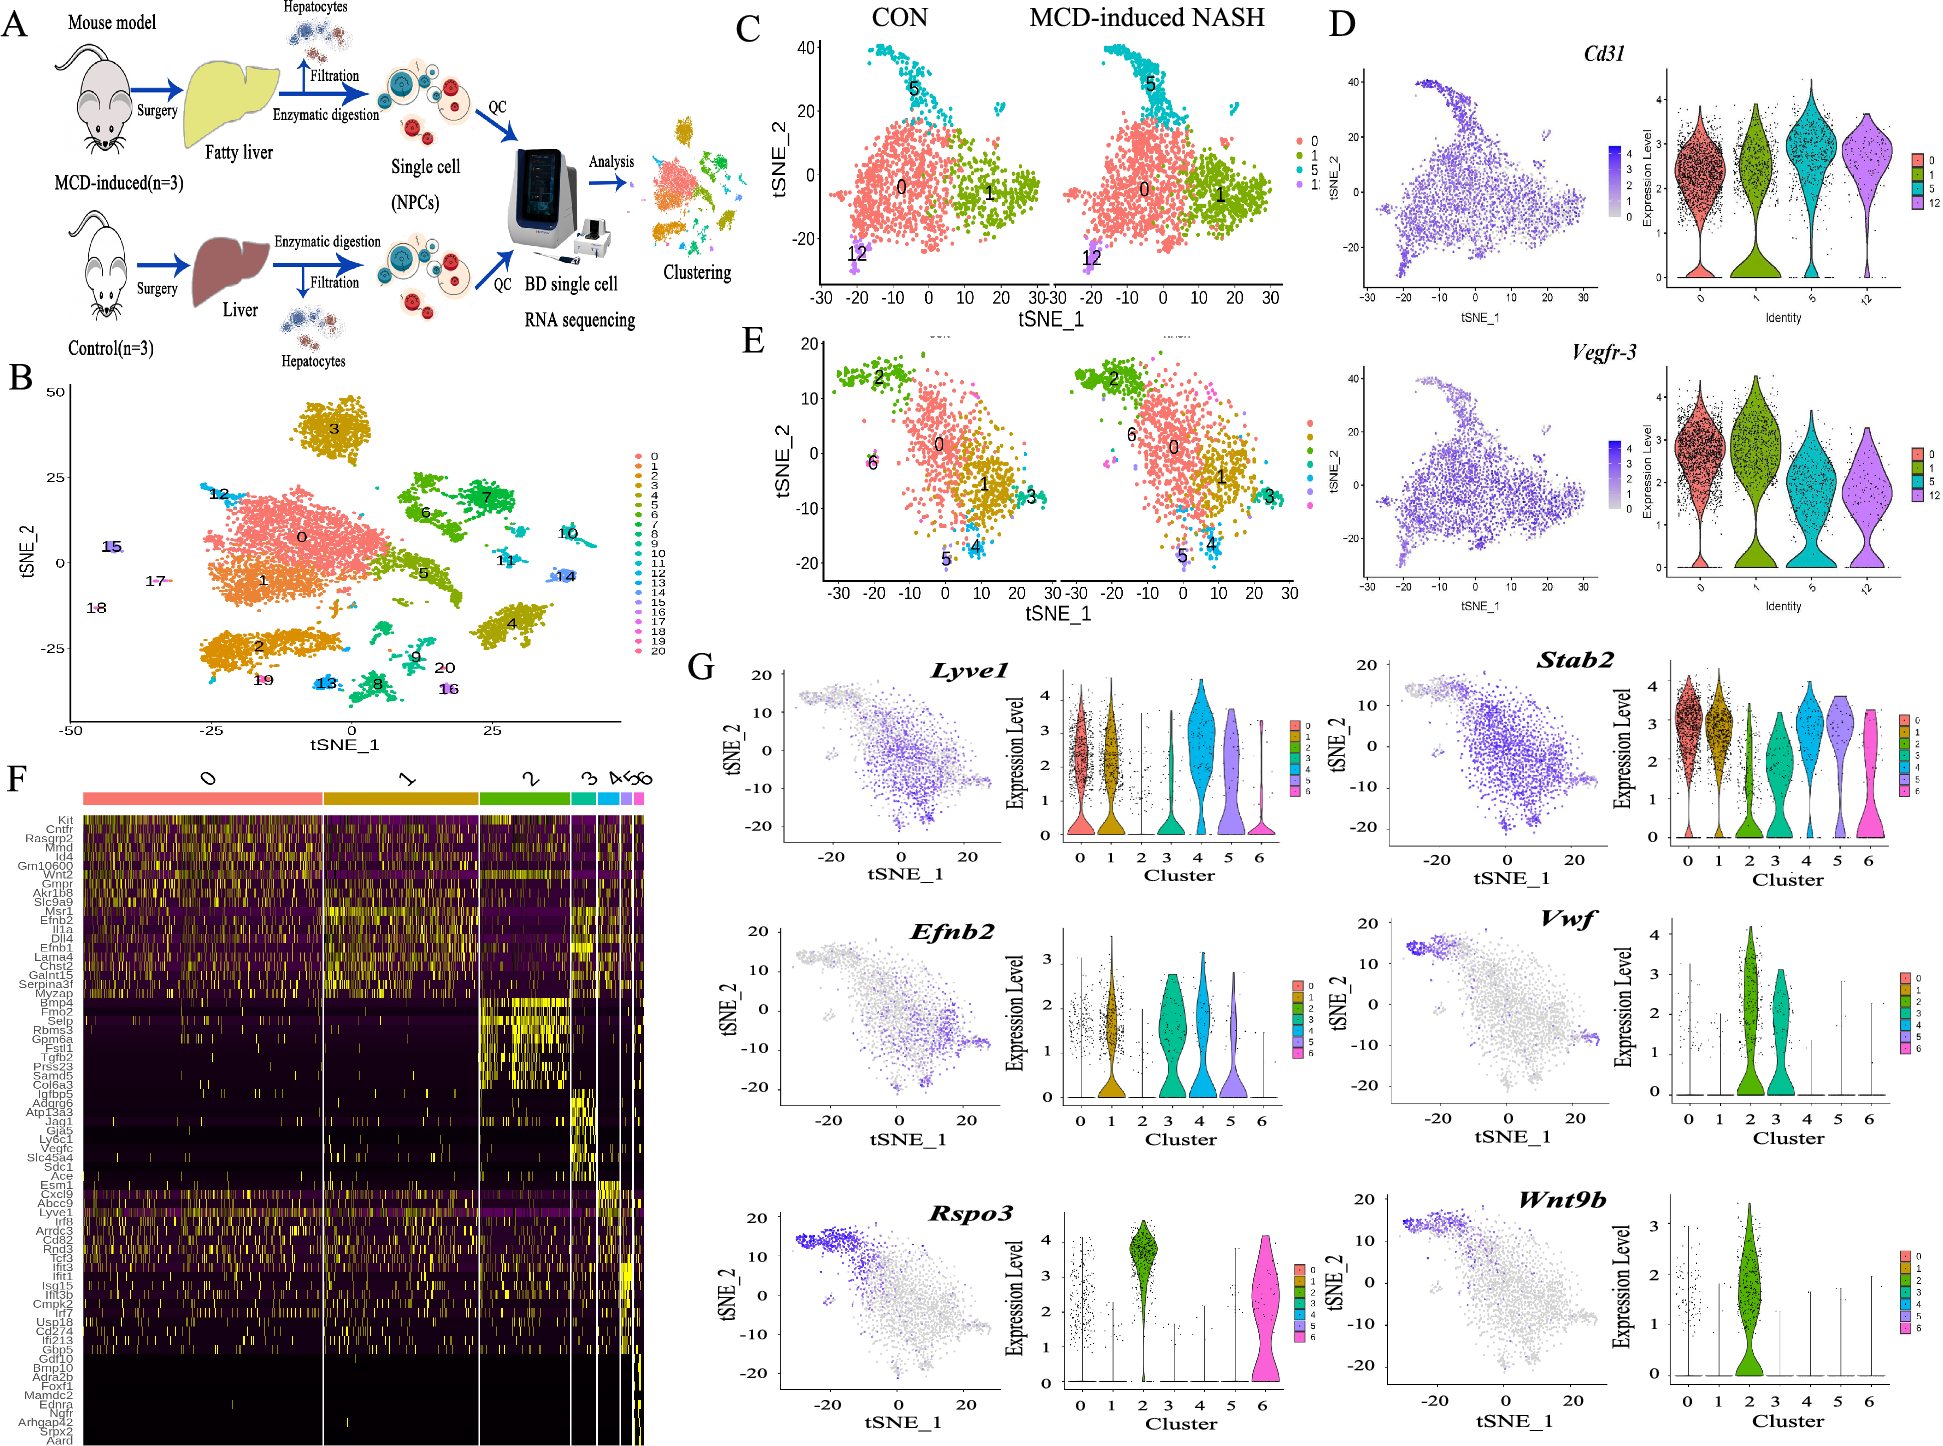
After integrating the above single-cell sequencing datasets and performing quality control, a total of 55,957 cells were identified, including samples from the Ctrl, LPP, and LS groups. Batch effects were removed, and UMAP was used for dimensionality reduction, showing that the cellular composition of skin samples was not significantly different among the three groups (Figure S1a). An unsupervised clustering approach divided all cells into 39 clusters (Figure S1b), with a heatmap displaying the top differential gene markers for each cluster (Figure S1c). Manual annotation and merging of cell clusters were performed using a reference gene set (Figure S1d), resulting in the identification of 21 cell types, including 9 immune cell clusters and 12 skin structural cell clusters, visualized with different colors on the UMAP plot (Fig. 2a, left). The classification markers and functional gene set enrichment (GSEA) differences for all cell types were then displayed (Fig. 2b and c). Annotations of major skin structure–associated cell types were based on the upregulation of marker genes and gene sets that have been confirmed to play key roles in the corresponding cell types, as listed below: Myoepithelial cells (KRT8, GSEA analysis suggests: epithelial mesenchymal transition and myogenesis), Keratinocytes (KRT5, KRT14; oxidative phosphorylation and MYC targets v1), Bulge cells (KRT15, CXCL14, LHX2; WNT signaling pathway upregulation), Bulb Matrix cells (MKI67, MSX2; MYC-related proliferative signaling upregulation), Sebocytes (DCD, androgen response upregulation), Sweat gland cells (AQP5; oxidative phosphorylation)(Fig. 2b and c). Although the cellular composition was similar among the groups, the proportions varied (Fig. 2a, right). Then, we focused on the changes in immune cell populations in the cicatricial alopecia regions by analyzing the 9 immune cell subtypes. We found that Tem cells were significantly upregulated in both the LPP and LS groups, macrophages were significantly upregulated in the LS group, and mast cells were upregulated in most samples from both the LPP and LS groups. Treg cells were slightly reduced in the LS and LPP groups, while B cells and neutrophils had higher proportions in some individual samples, with considerable intra-group variation (Fig. 2d and e). Among all LPP samples, LPP_1—characterized by a significantly higher severity (LPPAI-0 = 8.33)—showed a marked increase in the proportion of Tem and B cells, suggesting a potential association between these cell types and disease severity (Fig. 2e, Table S1).
Fig. 2
Overview of Scalp Cell Composition and Spatial Localization in Cicatricial Alopecia. (a) UMAP of scRNA-seq transcriptome profiles, with the proportion of the total number of cells for each cell type in the three groups. (b) The irGSEA heatmap shows the enrichment analysis scores of the top 50 gene sets for each cell type. (c) Dot plot showing expression of selected marker genes for the annotated cell subsets. Abbreviation correspondences: Endo - Endothelial cells, Mesen - Mesenchymal cells, Myo - Myoepithelial cells, Fib - Fibroblasts, Kerat - Keratinocytes, Bulge - Bulge, Matrix - Bulb Matrix, Seb - Sebocytes, Swe - Sweat gland cells, Mast - Mast cells, T_cells - T cells, Tn_Tcm - Naive and Central Memory T cells, Tem - Effector Memory T cells, Treg - Regulatory T cells, Neutro - Neutrophils, Macro - Macrophage, B_cells - B cells, Plas - Plasma cells, DCs - Dendritic Cells, Melano - Melanocytes, Schwann - Schwann cells. (d) Boxplot displaying the proportion of immune cell subsets in three groups. (e) Barplot displaying the proportion distribution of each immune cell subset in all samples. (f) Spatial transcriptomics data of one representative patient annotated with scRNA-seq transcriptome profiles by Robust Cell Type Decomposition(RCTD). Left: H&E staining of lesional skin in LPP and LS. Right: Spatial mapping of cell types with the RCTD method in the same sample. (g) Highlight the proportion of selected cell types for each spot on the spatial slice. White arrows indicate regions of dense cell distribution associated with the follicular isthmus/bulge. White outlines indicate the approximate contours of the hair follicle and epidermal structures
To explore the spatial distribution of cell types associated with cicatricial alopecia, we performed spatial transcriptomic sequencing on scalp biopsy samples from LPP and LS patients. We then annotated the spatial transcriptomic profiles using the previously annotated single-cell sequencing datasets, visualized the spatial distribution of these components, and compared them with the histological structure of adjacent HE-stained tissue sections from the same samples (Fig. 2f). The LPP group samples contained one relatively intact anagen terminal hair follicle with bulge and isthmus lichen-like infiltration, as well as several damaged hair follicles, while the LS group samples contained two relatively intact anagen terminal hair follicles with well-preserved sebaceous glands and arrector pili muscle structures (Fig. 2f, left). The locations of the hair follicles and other skin appendages corresponded well with the spatial distribution of the annotated cell populations in the spatial transcriptomic images, confirming that the previously annotated myoepithelial cells were arrector pili muscle cells.
Visualizing the proportion distribution of individual cell types revealed that Tem cells were predominantly located in the isthmus and bulge regions of the hair follicles in LPP samples, consistent with the typical inflammatory pattern of primary cicatricial alopecia [25]. Macrophages were widely distributed in the superficial dermis and follicular infundibulum of both LPP and LS samples. Still, they were also present in the bulge and isthmus regions of the hair follicles in the LPP group. The distribution pattern of Treg cells was similar to that of macrophages (Fig. 2f and g). B cells were found in some areas with significant inflammatory infiltration, while other immune cells were scattered or had a lower proportion (Fig. 2f and Figure S2).
The characteristics of the scalp microenvironment in primary cicatricial alopecia based on differential gene expression and cell communication analysisTo investigate changes in the scalp immune microenvironment across different cicatricial alopecia types, we applied a multi-condition design and employed methods for analyzing differential expression and predicting ligand activity to assess intercellular communication. Each condition group (Ctrl, LPP, LS) was compared with the other two groups, aiming to identify upregulated signaling pathways across all relevant cell subpopulations, including immune and skin structural cells. The top 50 significantly altered pathways for each group are illustrated in a chord diagram (Fig. 3a).
Fig. 3
The characteristics of the scalp microenvironment in primary cicatricial alopecia based on differential gene expression and cell communication analysis. (a) Circos plots summarize the top 50 prioritized Ligand(sender, lower semicircle)-Receptor(receiver, upper semicircle) interactions per condition between all effective cell types. (b) The sender-agnostic ligand activity heatmap displays the scaled activity values of certain ligands. In the left panel, the visualized ligands are the top 5 ligands with the highest-scaled activity for each receiver-contrast combination. In the right panel, the heatmap zooms in on interferon-related and interleukin-related ligands that show significantly increased activity in the LPP group compared to the other two groups
Among the signaling pathways specifically enhanced in the Ctrl group, regarded as “healthy” pathways, we noted increased activity in the IL15-IL2RA interaction (keratinocyte-Treg connection). However, IL15 does not directly bind IL2RA. Further analysis of differential L-R expression in Treg cells, acting as signal receivers, revealed that IL2RA was downregulated in both cicatricial alopecia groups, while IL15 showed reduced levels in some keratinocytes and Tem cells (Fig. 3a, Figure S3a). These findings align with recent research indicating the role of IL15 in maintaining hair follicle immune privilege and the downregulation of IL2RA + Treg cells in cicatricial alopecia lesions [26, 27]. In the LS group, there was a noticeable enhancement of classic scleroderma-associated signaling pathways, such as the TGFB1-SDC2 interaction between macrophages and mesenchymal cells, as well as the PDGFC-PDGFRB signaling between macrophages and fibroblasts, and among fibroblasts themselves. This indicates the crucial role of fibroblasts in morphea (Fig. 3a, Figure S3b) [28].
In the LPP group, it was noted that OSM (encoding Oncostatin M) expressed by macrophages acts on OSMR-related signaling in fibroblasts, leading to upregulation. OSM has previously been recognized as an important regulator of the hair follicle cycle and is known to inhibit hair follicle stem cell activity [29, 30], Therefore, we examined the top altered signals involving Bulge cells as receptors in the LPP group and found the presence of OSM-OSMR signaling, suggesting that macrophages might directly influence Bulge cells and contribute to the hair loss process in LPP (Fig. 3a, Figure S3c).
Given that some pathway activations may not be clearly linked to differential expression of ligands or receptors, we explored sender-independent ligand activity differences between groups based on changes in target gene expression. Interestingly, in the LPP group, interferon-related ligand activity (IFNG, IFNB1, IFNL1) was elevated across several cell subpopulations, including Bulge, sweat gland, and sebaceous gland cells. However, these interferon signals were not prioritized in conventional L-R communication analyses, suggesting that the differential expression of interferon ligands may not be significant between groups (Fig. 3b). Subsequently, we checked the expression levels of interferon ligands across all cell types in the single-cell transcriptomic data and found that only IFNG was predominantly expressed in the Tem cell subpopulation, with no significant differences in expression levels between groups (Figure S3d). Previous studies have suggested that the collapse of physiological bulge immune privilege induced by IFN-γ could be a core aspect of LPP pathology [9]. Combining the inter-group spatial distribution differences of Tem cells from the first section, we propose that LPP patients exhibit interferon-related inflammatory dysregulation localized around hair follicles and their appendages. We hypothesize the following: [1] The upregulation of IFNG-related ligand activity in cell subpopulations, such as Bulge cells, in the LPP group may be linked to the spatial distribution of Tem cells [2]. There might be signaling pathways in the LPP group that regulate interferon signal target genes independently of the direct action of interferon ligands.
CD8 + Tem cells mediate the inflammatory response around hair follicles in LPPInflammatory cells, predominantly T cells, forming a lichen-like infiltration around hair follicles are considered an important pathological feature in lymphocytic fibrosing alopecia diseases such as LPP [31]. Our previous results showed that the proportions of Tem cells and Treg cell subpopulations increased among immune cells in both the LPP and LS groups (Fig. 2d), and they mainly accumulated at the isthmus and bulge levels of hair follicles in the spatial transcriptomic maps (Fig. 2g). Therefore, this section will focus on the characteristics and functions of T cell subpopulations in LPP. We performed subpopulation analysis of all T cells in the single-cell sequencing data, identifying three subclusters: Tem, Tn/Tcm, and Treg, which were marked by the expression of NKG7, IL7R, and CTLA4, respectively (Fig. 4a, left, and Fig. 4b). The proportion of Tem cells increased in both the LPP and LS groups, while the proportion of Tn/Tcm cells decreased in both conditions, with no significant change in Treg cells (Fig. 4a, right). Additionally, the Tem subcluster specifically expressed IFNG, granzyme (GZMK/GZMB), and pro-inflammatory chemokines such as CCL4 and CCL5 (Figure S4a). Gene set enrichment analysis suggested upregulation of IFN-γ and IFN-α responses, as well as TNF-α and NF-κB-related signaling in the Tem subpopulation (Figure S4b). Differential analysis of transcription factor activity between clusters indicated increased activity of transcription factors associated with cytotoxic effector T cell lineage (RUNX, TBX21, EOMES) and interferon family transcriptional regulation (IRF1, IRF7, IRF8) in the Tem subcluster (Fig. 4c). Moreover, IRF1 and IRF7 in Tem cells jointly upregulated the expression of previously mentioned chemokines such as CCL4 and CCL5, and this subcluster also highly expressed IFNG (Fig. 4d and e). To validate the hypothesis that Tem cells in the LPP group mediate follicle-associated inflammation through interferon-related transcription factor activation, we explored the expression patterns of specific genes in the spatial transcriptomic data, including Tem cell markers (CD3D/NKG7), IFN-γ and pro-inflammatory chemokines (IFNG/CCL4/CCL5), and interferon-regulating transcription factors (IRF1/IRF7). Visualization showed that these genes co-localized in the perifollicular inflammatory regions of LPP samples, while in LS samples, they were primarily distributed in the superficial dermis (Figure S4e).
Fig. 4
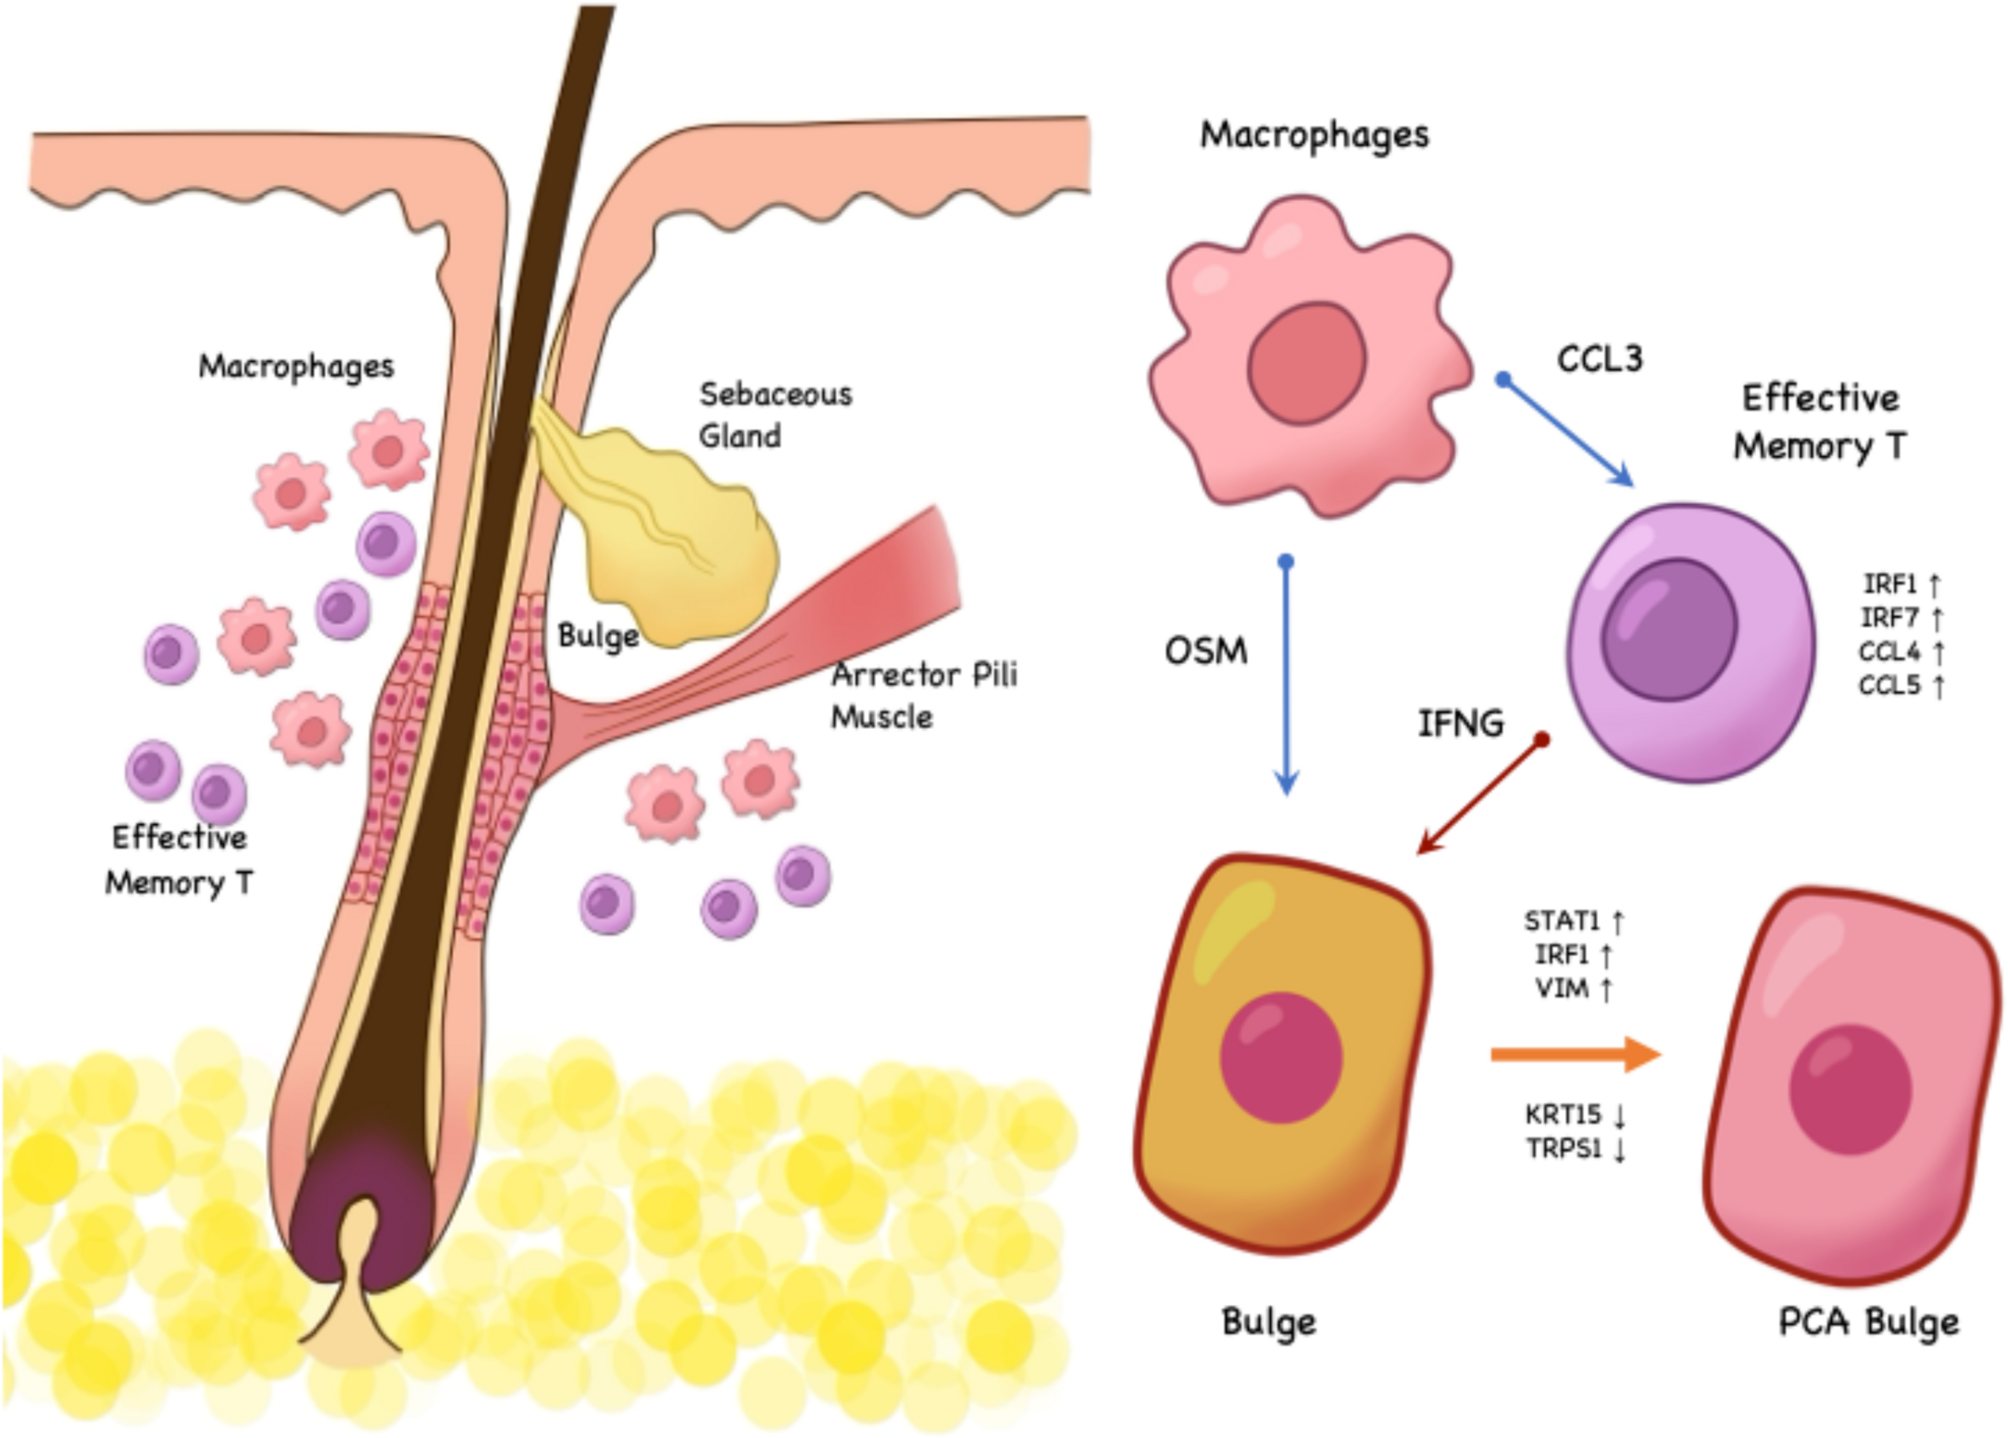
CD8 + Tem cells mediate the inflammatory response around hair follicles in LPP. (a) UMAP of scRNA-seq transcriptome profiles of T cells annotated with three subtypes. Right panel depicts changes in the proportions of these subtypes relative to total T cells, highlighting differences in T cell composition across groups. (b) UMAP (from A) annotated with the expression of selected subtype-specific marker genes. (c) Dot plot illustrating SCENIC analysis results for transcription factor activity across T cell subtypes. The x-axis represents three T cell subtypes: Tn/Tcm (naive/central memory T cells), Treg (regulatory T cells), and Tem (effector memory T cells). (d) Network visualization of selected transcription factor-target gene interactions from SCENIC analysis. (e) Dot plot displaying expression of selected genes (CCR5, IRF1, IRF7, CCL4, CCL5, IFNG) across subtypes (Tem, Tn/Tcm, Treg). (f) Immunofluorescence staining validation suggests a unique role of the macrophage-Tem CCL3-CCR5 signaling axis in LPP [1]. Immunofluorescence protein staining of LPP scalp for CD3-yellow, CCL3-red, CD68-green, CCR5-purple, and DAPI-blue [2]. Immunofluorescence protein staining of LS scalp for CD3, CCL3, CD68, CCR5, and DAPI, with white arrows indicating nerve fascicles [3]. Immunofluorescence protein staining of AGA scalp for CD3, CCL3, CD68, CCR5, and DAPI
Based on the above results, we explored the upstream regulatory mechanisms specific to Tem cells in the LPP group. First, we visualized the top five signaling pathways with the most significant changes in Tem cells, acting as signal receivers in the LPP group compared to other groups. The predictions suggested that macrophages upregulated various chemokines acting on Tem cells, with the CCL3-CCR5 signaling pathway showing high predictive reliability (Figure S4c). Upon examination, the receptor CCR5 was mainly expressed in the Tem subcluster (Fig. 4E), and the intensity of this signaling pathway was positively correlated with interferon-related transcription factors such as IRF4 and IRF7 (Figure S4D).
We then performed immunofluorescence staining to further investigate the above predictions. In LPP samples, we found extensive infiltration of T cells (CD3+) and macrophages (CD68+) around hair follicles, with strong CCR5 and CCL3 signals in these regions (Fig. 4f). Although a mixed infiltration pattern of T cells and macrophages was also observed in the dermis of LS samples (including areas around nerves), the proportion of CCR5 + cells among CD3 + cells was lower, and the CD68 + CCL3 + signal was not as prominent relative to the scale of inflammation (Fig. 4f). Interestingly, we also detected CD3 + CCR5 + signals in parts of the hair follicle infundibulum in AGA patients, but neither CD68 nor CCL3 signals were present (Fig. 4f).
In summary, we propose that the interferon-related inflammatory dysregulation around hair follicles in LPP is likely associated with the upregulation of signals such as CCL3-CCR5 by certain macrophages, which activate specific transcription factors (IRF1/IRF7) in Tem cells, leading to the expression of pro-inflammatory chemokines and interferon-γ.
Specific macrophage subpopulations contribute to the LPP disease process by upregulating CCL3 and OSMMacrophages have been shown to play a crucial role in various inflammatory skin diseases, and recent literature indicates an increased number of macrophages around hair follicles in LPP patients; however, their specific function remains unclear [10]. 。In our study, although the overall proportion of macrophages in the scalp samples from the LPP group did not show an increase (Fig. 2d), we focused on exploring the changes and characteristics of macrophage subpopulations in LPP based on previous findings. By performing unsupervised clustering of single-cell sequencing data for macrophages, we classified them into five clusters (Fig. 5a, left). To further characterize the functions of these macrophages, we scored the clusters using M1 and M2 gene sets [32]. Clusters 1 and 2 had higher M1 scores, while clusters 3 and 4 showed higher M2 scores, and cluster 0 had low scores for both M1 and M2 (Fig. 5a, right, and Fig. 5b).
Fig. 5
Specific macrophage subpopulations contribute to the LPP disease process by upregulating CCL3 and OSM. (a) UMAP plots showing cell clustering of macrophages and phenotype scoring for M1 and M2. (b) Dot plot displaying the correlation between different clusters (y-axis) and macrophage phenotypes (M1 and M2) on the x-axis. (c) Spatial transcriptomics data showing M1 and M2 polarization gene set score patterns across tissue sections under two conditions: LPP (top row) and LS (bottom row). (d) Heatmap displaying the expression levels of selected genes across different macrophage clusters (0 to 4), highlighting the top upregulated genes in cluster 1. (e) UMAP plot and bar graph showing the distribution and proportion of different cell types across conditions. (f) UMAP plots and violin plots showing expression patterns of CCL3, OSM, and TREM2 across different cell types. (g) Spatial co-expression maps showing the distribution of OSM and TREM2 expression in tissue sections of LPP and LS samples
Using the same gene sets to score each dot in the spatial transcriptomics, we found that the M1 score was locally elevated in the upper sections of hair follicles in the LPP group, resembling the distribution pattern of Tem cells observed earlier (Fig. 5c). Differential gene expression analysis among clusters revealed that cluster 1 specifically expressed several pro-inflammatory genes (CCL3, CCL4, CCL3L1, CCL4L2, IL1B), which were highly consistent with the upregulated ligands in macrophages identified in the LPP group from the previous cell communication analysis (Figure S4c). Cluster 0 showed high expression of CD1E and CD1A, suggesting that these cells are mainly Langerhans cells (Fig. 5d).
Based on the above results, we named the clusters as follows: M0 (cluster 0), M1A (cluster 1), M1B (cluster 2), M2A (cluster 3), and M2B (cluster 4). In the LPP group, the proportion of M1A macrophages increased, while M0 decreased (Fig. 5e). Gene set enrichment analysis showed that the M1A subpopulation significantly upregulated inflammation-related signals, such as TNF-α, IFN-γ, and IL6-JAK-STAT3, indicating strong pro-inflammatory characteristics (Figure S4f). The upregulation of the IL6-JAK-STAT3 pathway prompted us to examine the previously identified OSM-OSMR signaling, which belongs to the IL-6 family. We found that the M1A subpopulation co-expressed CCL3 and OSM (Fig. 5f). We also checked the expression of TREM2, a marker for OSM-high macrophages mentioned in previous literature, and found some overlap with the M1A subpopulation (Fig. 5g).
[30]. Co-expression analysis using spatial transcriptomics showed that, compared to the sparse expression in LS samples, there was TREM2/OSM co-localization in the inflammatory regions around hair follicles in LPP samples (Fig. 5g). The above findings suggest that M1A macrophages likely contribute to the inflammation surrounding hair follicles in LPP through two main pathways: [1] Upregulating chemokines such as CCL3 to stimulate surrounding Tem cells to secrete pro-inflammatory molecules (e.g., IFN-γ and CCL5) [2]. Secreting OSM to directly act on bulge stem cells, inhibiting hair growth.
STAT1 activation is involved in the aberrant lineage of hair follicle stem cells in LPPHFSCs are primarily located in the outer root sheath (ORS) region of the hair follicle bulge [33]. Damage to HFSCs has long been considered a key factor contributing to the irreversible hair loss associated with PCA-related diseases [25]. The previous conclusions suggest that Tem and M1A macrophages may act on bulge cells through various molecular mechanisms, such as IFN-γ and OSM. To clarify the changes in bulge cells in LPP compared to normal or other hair loss conditions, we performed lineage analysis of bulge cells based on single-cell sequencing data. Unsupervised clustering divided the bulge cells into three clusters (Figure S5a). Differential analysis between clusters showed that cluster 2 significantly upregulated hair follicle differentiation markers (KRT6B, KRT16, KRT75) compared to the other two clusters (Figure S5b).
Therefore, we annotated clusters 0 and 1 as HFSC Group 0 and Group 1, respectively, both of which expressed the HFSC marker KRT15, with Group 1 enriched for the classic Wnt pathway associated with hair follicle activation. Cluster 2 was annotated as Epic, as it highly expressed epidermal keratinocyte markers such as KRT17, lacked the stem cell marker KRT15, and upregulated genes related to epidermal development (Fig. 6a). We speculate that this cluster likely represents the commonly recognized K6 + inner bulge cells (IBC), which originate from the lower outer root sheath (ORS) and are involved in retaining the hair coat and maintaining HF-SC quiescence [33]. Transcription factor activity analysis indicated that STAT1 and IRF1 activities were higher in HFSC Group 0 (Figure S5c). The proportion of HFSC Group 0 increased in the bulge cells of both LPP and LS conditions, while Epic was significantly reduced in the LPP group (Fig. 6a, bottom right). Subsequently, we predicted the activity of two ligands, IFNG and OSM, acting on the bulge based on inter-group differential gene expression. The results showed that ligand activity was significantly elevated in the LPP group compared to the other two groups, with a concomitant upregulation of various inflammation-related signals (IRFs, IFITMs, STATs) and major histocompatibility complex (HLA), the latter being a key marker of hair follicle immune privilege loss (Fig. 6b) [9]. We then checked the expression of the STAT1-related JAK-STAT pathway in bulge cells across different groups and found that only STAT1 was significantly upregulated in the LPP group. This may be associated with the increased proportion of HFSC Group 0, which exhibits higher STAT1 and IRF1 activity, in the bulge cells of LPP (Figure S5d).
Fig. 6
STAT1 activation is involved in the aberrant lineage of hair follicle stem cells in LPP. (a) Integrated visualization of enriched biological processes and cell-type proportions. The left panel displays the top Gene Ontology (GO) terms ranked by -log10(p-value). The middle UMAP plots show the distribution of three distinct cell subtypes (HFSC_Group0, HFSC_Group1, and EpiC) across the dataset. The upper-right UMAP plots illustrate the expression levels of three Keratinocyte Lineage Markers. The right bar plot shows the proportion of these cell subtypes across different groups (Ctrl, LPP, LS). (b) Ligand activity - target gene combination plot, where two ligands, IFNG and OSM, are selected to show ligand activity differences and the regulatory status of their predicted target genes. (c) UMAP plots showing the distribution of two differentiation trajectories of bulge cells, fitted by slingshot, across the entire bulge population: Lineage1 (HFSC_Group1 → HFSC_Group0) and Lineage2 (HFSC_Group1 → EpiC). Pseudotime values for lineage1 are color-coded, transitioning from early (blue) to late (red) stages along the trajectory. (d) Scatter plots displaying the top six genes (EFNA5, TENM4, TRPS1, CDH12, CST3, and FREM2) with the most significant expression changes along lineage1, identified through tradeSeq analysis. A yellow smoothed line shows the fitted trend of gene expression over pseudotime. (e) Scatter plots displaying selected genes (KRT15, SOX9, LEF1, STAT1, IFITM3, IRF1, VIM, and ZEB1) with expression changes along lineage1, identified through tradeSeq analysis. (f) Spatial expression of STAT1 in tissue sections under two conditions (LPP and LS), visualized using spatial transcriptomics. (g) Immunofluorescence protein staining of AGA scalp for KRT15 (yellow), pSTAT-1 (red), TRPS1 (green), and DAPI (blue), with white arrows indicating arrector pili muscle (APM). (h) Immunofluorescence protein staining of LPP scalp for KRT15 (yellow), pSTAT-1 (red), TRPS1 (green), and DAPI (blue)
Since stem cells have differentiation potential, there may be lineage relationships among bulge subpopulations. We performed pseudotime analysis on the single-cell sequencing data to explore this possibility. Setting the stem cell-characteristic Group 1 as the starting point, we identified two lineages: HFSC Group 1→Group 0 and Group 1→EpiC (Fig. 6c). Along the Group 1→EpiC lineage, there was upregulation of the hair follicle differentiation marker KRT17, suggesting a lineage associated with normal HFSC differentiation (Figure S5e).
Interestingly, the Group 1→Group 0 lineage exhibited changes in gene expression: TRPS1 and ENFA5, which are known to be associated with hair follicle health, showed significant downregulation along the lineage (Fig. 6d) [34, 35]. TRPS1 (Transcriptional Repressor GATA Binding 1) silencing is thought to promote the EMT process [36]. Stem cell-related genes (KRT15, SOX9, LEF1) markedly decreased upon transitioning to Group 0, whereas inflammation-associated genes (STAT1, IRF1, IFITM3) were highly expressed in the middle of the lineage. Fibrosis-related genes (ZEB1, VIM) showed increased expression at the lineage’s end, mimicking the inflammation-to-fibrosis progression observed in cicatricial alopecia (Fig. 6e). Spatial transcriptomic analysis further revealed that, in comparison to the broad STAT1 expression in the epidermis and dermis of LS samples, STAT1 expression in LPP was highly concentrated around the hair follicles, particularly in the upper regions of the follicles affected by inflammation (Fig. 6f). Immunofluorescence staining showed widespread HFSC marker KRT15 in the outer root sheath (ORS) of androgenetic alopecia (AGA, non-cicatricial alopecia) samples, with KRT15 + cells in the upper follicle regions also co-expressing TRPS1 (Fig. 6g). In contrast, in the inflammatory regions of LPP hair follicles, the fluorescence distribution of KRT15 and TRPS1 was inversely correlated with the active phosphorylated form of STAT1, pSTAT1. In areas of prominent inflammatory infiltration, KRT15 and TRPS1 expression were both reduced, while pSTAT1 was increased (Fig. 6h).
In conclusion, we speculate that bulge cells in LPP are affected by the combined influence of IFN-γ and OSM, leading to the upregulation of transcription factors represented by STAT1, which promotes the HFSC Group 1→Group 0 transition along this inflammation-fibrosis lineage.
The crosstalk among macrophage-Tem-Bulge cells is associated with the severity of follicular inflammation in LPPTo clarify the spatial expression patterns of crosstalk signals among macrophage-Tem-Bulge cells in scalp tissue, we utilized spatial transcriptomic data from LPP to explore the relevant ligand-receptor expression. Co-expression analysis suggested that the receptor OSMR was widely expressed in epithelial-related structures (epidermis, hair follicles), while the ligand OSM was predominantly located around hair follicles. The receptor CCR5 was highly expressed around nearly all inflammation-affected hair follicle infundibulum-isthmus regions, whereas its corresponding ligand, CCL3, co-localized with CCR5 only in some areas surrounding the follicles, prompting us to investigate the heterogeneity of follicular inflammation in LPP (Figure S6a).
We then selected the infundibulum-isthmus inflammation regions of these two follicles and classified them into Mild and Severe areas based on the degree of inflammation for comparative analysis. Cell composition projection indicated that these regions were composed of keratinocytes and a small number of bulge stem cells, while immune cells mainly consisted of macrophages, Tem, and Treg, overlapping with the follicular structure, reflecting the infiltration and attack of these inflammatory cells on the hair follicles (Figure S6b). Comparative gene expression analysis between these regions further revealed that OSM expression was elevated in the Severe area, although not statistically significant, along with similarly increased levels of the previously mentioned inflammatory transcription factors IRF1 and STAT1. The expression of the fibrosis marker VIM was significantly upregulated in the Severe area, indicating a more advanced stage of the inflammatory response, while both CCL3 and CCR5 were significantly increased in this region (Figure S6c).
Additionally, the Severe area showed a significant upregulation of inflammation-related HFSC_Group0, and the source of OSM and CCL3—M1A macrophage subpopulation score—while the score for downstream differentiated HFSC cells (EpiC) was decreased. The Tem score was slightly higher but without significant differences (Figure S6d).
Comments (0)