Animals and treatment
SPF-grade C57BL/J mice, weighing between 25 and 30 g, or newborn mice (Huafukang, Beijing, China), were utilized for animal experiments. The mice were pretreated with NF-κB specific inhibitor (QNZ, MedChemExpress, Shanghai, China, 1 mg/kg) by intraperitoneal injection for 0.5 h, followed by LPS (Solarbio, Beijing, China, 5 mg/kg) for 12 h, and MSC/MSC-siKGF (1 × 10⁶ cells) by tail-vein injection for 12 h. The control group was injected with 0.9% NaCl.
Primary mouse AT2 cell and MSC culture
Newborn SPF-grade C57BL/J mice were used to isolate primary AT2 cells. The lung tissue was separated in phosphate-buffered saline (PBS), followed by enzymatic digestion at 37 °C. Then, the collected cells were cultured in Dulbecco’s modified Eagle medium (DMEM)/F12 medium (Corning, New York, USA), with the medium changed every 48 h for 3 d before use [22]. Antibodies used in flow cytometry to assess AT2 cell purity included Spc/Pdpn (Santa Cruz, Dallas, USA) and FITC-labeled goat anti-rabbit IgG (ZSGB-bio, Beijing, China). We treated AT2 cells with 100 nM QNZ/10 µM ERK1/2 specific inhibitor (PD98059, Beyotime, Shanghai, China) for 0.5 h, then applied 10 µg/ml LPS for 12 h, followed by KGF (Novoprotein, Suzhou, China, 10 ng/ml) for 12 h.
Following the euthanasia of male C57BL/J mice (25–30 g) by intraperitoneal injection of sodium pentobarbital (100 mg/kg), the femurs were aseptically harvested. The bone marrow cavity was then flushed to collect bone marrow cells, which were subsequently centrifuged and plated into culture dishes containing DMEM/F12 medium [26, 27]. Under optimal culture conditions, nonadherent cells were removed to obtain purified MSCs. To determine the role of KGF in MSC therapy, we transfected 100 nM KGF-siRNA (siKGF, GenePharma, Shanghai, China) for 48 h. MSCs at a density of 1 × 10⁴ cells per well were seeded into the apical compartment of a 6-well Transwell system, while AT2 cells were positioned in the basolateral compartment. AT2 cells treated with 10 μg/mL LPS were co-cultured with MSC/MSC-siKGF for 12 h.
Air–liquid cell culture
Calu-3 cells were seeded at a density of 5 × 10⁶ cells/cm2 in 24-well Transwell inserts (3413, Corning-Costar, Lowell, USA). The basolateral chamber was filled with DMEM/F12 medium supplemented with 10% fetal bovine serum, 1% penicillin–streptomycin, and 250 nM dexamethasone (D4902, Sigma, St. Louis, USA). The cells were cultured at 37 °C in a humidified incubator with 5% CO2. After 24 h, unattached cells in the apical chamber were removed, and the culture was switched to an air–liquid interface condition by removing the apical medium, while the basolateral medium was replaced every 48 h. The monolayer integrity was assessed by measuring transepithelial electrical resistance (TEER) using a Millicell ERS-2 V-ohm meter (Millipore, USA), and only monolayers with a stable TEER value exceeding 400 Ω cm2 were used for subsequent experiments.
Western blot assay
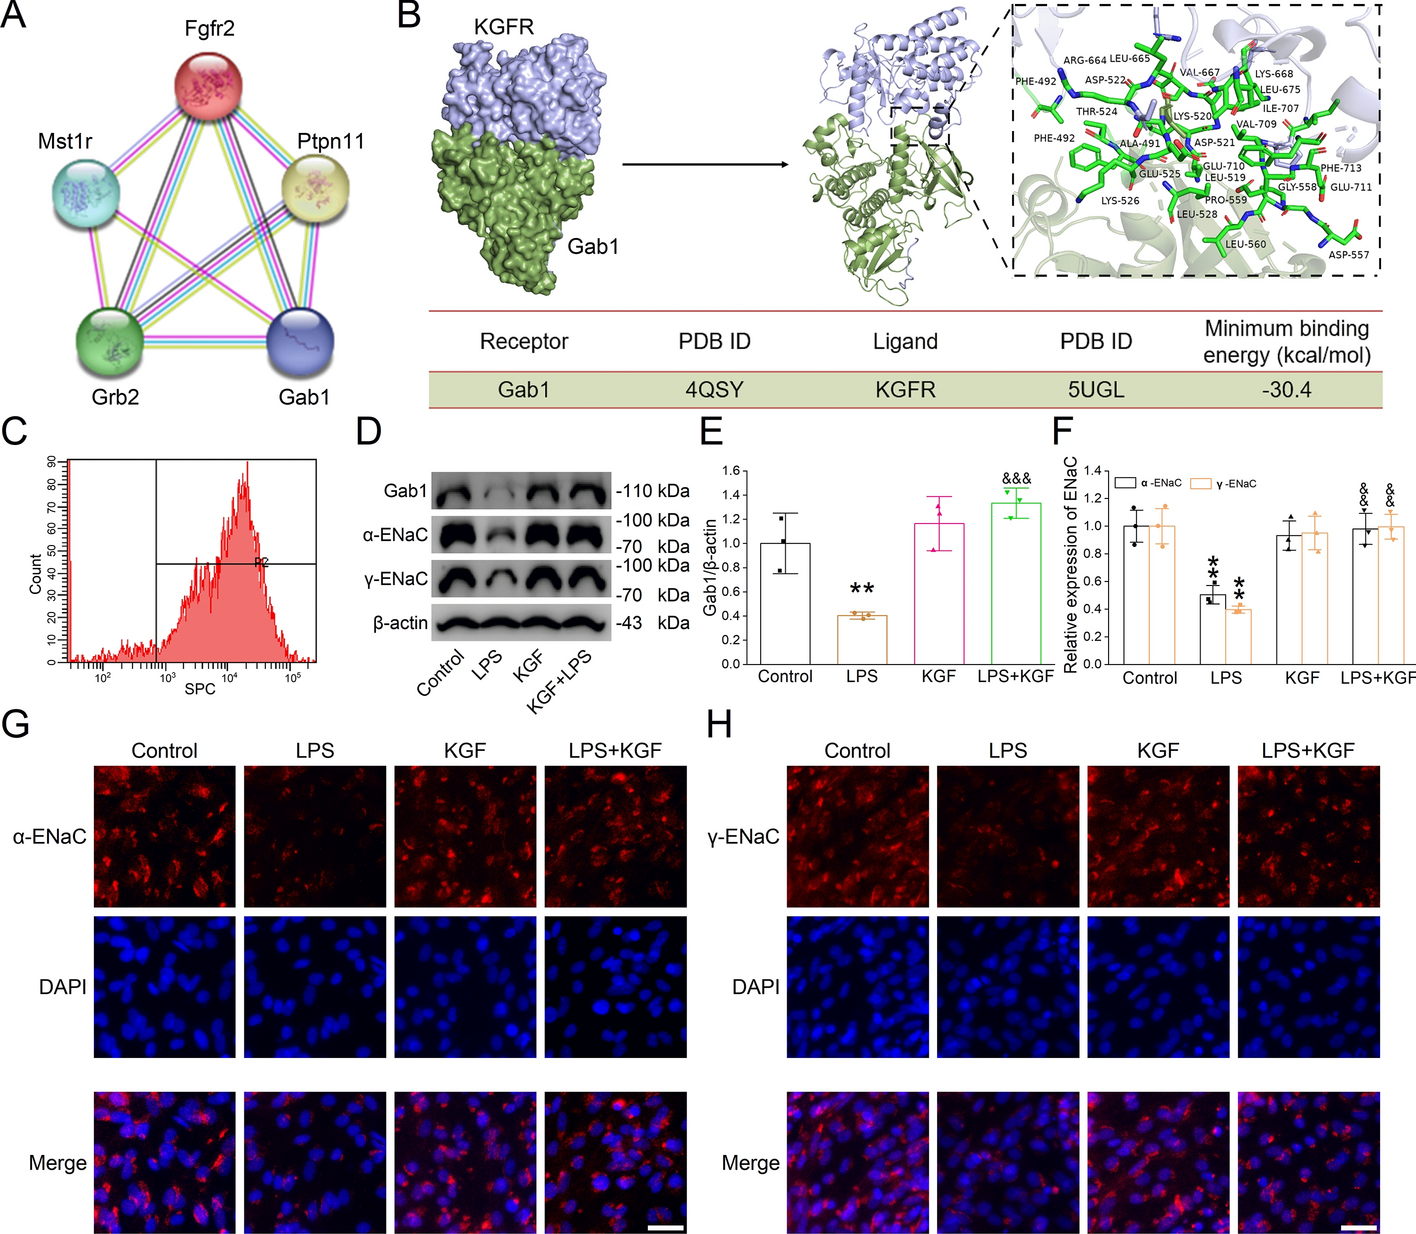
Cellular or tissue proteins were extracted, fractionated by SDS-PAGE gel electrophoresis according to their molecular weights, detected using specific antibodies, and visualized for subsequent expression analysis. The western blot assay utilized primary antibodies that included α-ENaC (1:1500, Invitrogen, Carlsbad, USA); γ-ENaC (1:1500, Abcam, Cambridge, USA); β-actin (1:1500, Proteintech, Chicago, USA); p65, p-p65, inhibitor kappaB (IκB), and p-IκB (1:1000, Abmart, Shanghai, China); ERK1/2 and p-ERK1/2 (1:1000, Cell Signaling, Danvers, USA); and Gab1 (1:500, Affinity, Cincinnati, USA). Horseradish peroxidase-conjugated, goat-anti-rabbit or goat-anti-mouse (1:5000, ZSGB-BIO, Beijing, China) antibodies were used as secondary antibodies at room temperature for 1.5 h. The protein bands were visualized using ECL on a chemiluminescence detection system (Tanon, Shanghai, China), and the intensity of each specific band was quantified with ImageJ.
Immunofluorescence staining
Primary mouse AT2 cells were immobilized using 4% paraformaldehyde at 25 ℃ for 20 min, and nonspecific permeabilization of cell membranes for 15 min with 0.2% Triton X-100. After blocking, the cells were incubated overnight with primary antibody against α/γ-ENaC (1:200), then with anti-rabbit IgG (H + L) highly cross-adsorbed secondary antibody for 2 h. Finally, the cell nuclei were stained with DAPI, and observed under the fluorescence microscope.
Co-immunoprecipitation
The primary mouse AT2 cells were treated with RIPA lysis buffer to extract cell lysates. A specific antibody was used to capture the target protein, forming an antibody–target protein complex, which was then precipitated using protein A/G-beads. During this process, proteins interacting with the target protein were also co-precipitated. Finally, western blot analysis was performed to analyze the interacting proteins.
Electrophoretic mobility shift assay
Nucleoprotein extraction was performed utilizing a dedicated kit sourced from Beyotime (Shanghai, China), with subsequent quantitation of protein concentration. The α-ENaC probe was prepared with the sequence 5′-GGAGAGTCCCC-3′. Next, the nuclear proteins were mixed with DNA probes and allowed to bind under certain conditions. By polyacrylamide gel electrophoresis, protein-bound DNA was separated from unbound DNA. The DNA was then transferred onto a nylon membrane, followed by employing specific detection methods to observe and analyze the positional changes of the DNA probes on the membrane, thereby assessing the binding status of proteins to DNA.
Quantitative real-time polymerase chain reaction
Total RNA was extracted from AT2 cells by Trizol reagent sourced from Invitrogen (Waltham, USA). The PrimeScript RT reagent kit (TaKaRa, Kusatsu, Japan), was utilized to convert the RNA into cDNA according to its guidelines. SYBR Premix Ex Taq II reagent (TaKaRa, Kusatsu, Japan) was used to prepare a reaction system containing the samples and primers, and quantitative real-time polymerase chain reactions (qRT-PCR) were performed on the ABI 7500 qRT-PCR System. The primer pairs included in the experiment were as follows: α-ENaC (forward: 5′-AGG GCT GAG CCT AGA GCT AGA GA-3′; reverse: 5′-TTC CTC CCG GAC TGT TTG AC-3′), β-ENaC (forward: 5′-GGG ACC AAA ACC ACC TTA GCT GCC ATC AC-3′; reverse: 5′-TGC AGT ACC ACA CTA GCA GC-3′), γ-ENaC (forward: 5′-CAG CCG TGA CCC TTC AGT TC-3′; reverse: 5′-CCT TAA TGG TCG GCG CCT GG-3′), and β-actin (forward: 5′-GGC TGT ATT CCC CTC CAT CG-3′; reverse: 5′-CCA GTT GGT AAC AAT GCC ATG T-3′). The PCR cycling system was set up according to the manufacturer’s instructions. The experimental data were analyzed using the 2−ΔΔCT relative quantification method.
Hematoxylin–eosin staining
The lung tissues were fixed in 4% paraformaldehyde for 24 h, subsequently dehydrated using a sucrose solution, embedded in paraffin, and then stored in a −80 °C freezer. The paraffin-embedded lung tissues were sectioned using a cryostat, followed by staining with hematoxylin–eosin (HE), and the pathological changes in the lungs were analyzed under an optical microscope. The lung injury score was evaluated on the basis of pulmonary hemorrhage, inflammatory cell infiltration, and pulmonary interstitial edema. According to the severity of injury, scores were assigned as follows: 0 (no apparent lesions), 0.5–1 (mild), 2 (moderate), 3 (severe), and 4 (critical). The ALI score was obtained by summing the scores for each parameter, and the average score for each group was calculated for statistical analysis. All evaluations were performed by an independent observer blinded to the sample identities [28].
Wet/dry weight ratio and lung index measurement
The severity of pulmonary edema was assessed by calculating both the wet/dry (W/D) weight ratio and lung index. Following euthanasia of the mice, lung tissues were promptly isolated and wet weight (g) was determined. Subsequently, these tissues were subjected to drying in an oven maintained at 60 °C for a duration of 48 h. Post-drying, the dry weight (g) of the tissues was measured. Utilizing these values, the W/D weight ratio was computed. In addition, the lung index was derived by dividing the wet weight of the lungs (g) by the total body weight of the mouse (kg).
AFC measurement in vivo
AFC was performed in vivo as previously described [29]. Briefly, after anesthesia with pentobarbital sodium (50 mg/kg) by intraperitoneal injection, the mice were placed supine with their limbs and heads fixed using syringe needles. After exposing and isolating the trachea, a T-connector attached to a mouse respirator was inserted to supply oxygen. The mouse was then positioned laterally, and 200 μl (the volume of injected alveolar fluid, Vi) of 5% (the initial concentration of injected protein, Pi) fatty acid-free bovine serum albumin solution was instilled into the lungs through the T-connector. After 30 min, the respirator was turned off, and a 1 mL syringe connected to the T-connector was used to gently aspirate the alveolar fluid and the protein concentration of the retrieved fluid was measured and recorded as Pf. According to the formula, the volume of alveolar fluid gathered (Vf) can be calculated as Vf = (Vi × Pi)/Pf. Finally, AFC was calculated on the basis of the following formula: AFC = [(Vi − Vf)/Vi] × 100.
Protein interaction prediction using string database
Utilizing the string database (https://string-db.org/), we predicted the downstream signaling pathways of the target protein. The proteins or gene sequences involved in our research were entered to generate a protein–protein interaction network. We then analyzed each potential interacting protein individually to assess its likelihood of being upstream or downstream of the target protein [30, 31].
Molecular docking analysis
We obtained the molecular structures of the two proteins from the PDB database (https://www.rcsb.org), digitally predicted whether the molecules were likely to bind or not at the zdock website (https://zdock.wenglab.org/), docked the two molecules using PyMol (https://pymol.org/2), and visualized the molecular docking results [32, 33].
Ussing chamber analysis
The Calu-3 monolayers were mounted in Ussing chambers (Physiologic Instruments, San Diego, USA), with the basolateral and apical sides perfused with their respective solutions (composition as previously described) [22]. A continuous flow of 95% O2/5% CO2 gas mixture was maintained at 37 °C. To permeabilize the basolateral membrane, 100 μM amphotericin B (Sigma, St. Louis, USA) was added to the basolateral side. After a 10-min equilibration, 100 μM amiloride (Sigma, St. Louis, USA) was applied to the apical side, and the resulting decrease in short-circuit current (Isc) was recorded as the amiloride-sensitive current (ASI), representing ENaC-mediated sodium ion transport. Data were acquired using the Acquire and Analyze 2.3 software.
Measurement of airway surface liquid height
The apical surface of the Calu-3 monolayers was washed three times with PBS, followed by the addition of 1 μL FITC-dextran (Sigma, St. Louis, USA) mixed with 99 μL PBS. The cells were incubated at 37 °C in the dark for 1 h. After removing the apical liquid, the air–liquid interface culture was continued for another 24 h. For analysis, the Transwell membrane was excised and placed in a confocal dish. The airway surface liquid (ASL) was imaged using a laser scanning confocal microscope with z-axis 3D scanning (step size: 10 μm). The ASL height was quantified using ImageJ software.
Statistical analysis
The experimental results were presented as the mean ± SE, and assessed the power of sample size firstly to meet P < 0.05. Upon successful completion of Levene’s test for normality and Shapiro–Wilk’s test for heteroscedasticity, we employed one-way analysis of variance (ANOVA) and Bonferroni’s test for comparisons across multiple groups.


Comments (0)