
Remember me
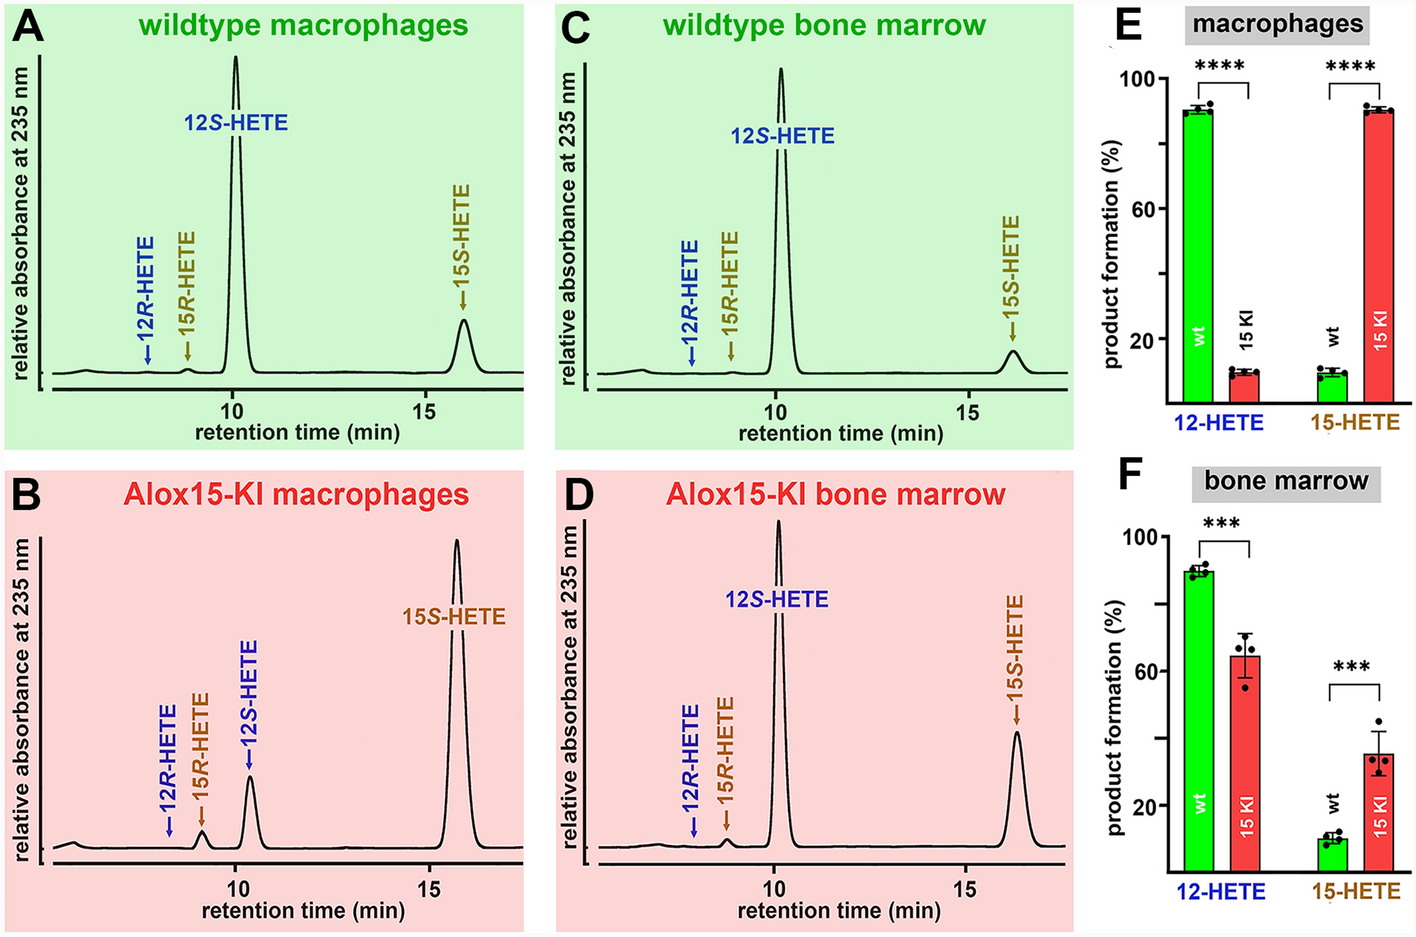


As most mammalian ALOX15 orthologs [28] mouse Alox15 is an AA 12-lipoxygenating enzyme [2, 22] and in vitro mutagenesis studies (Leu353Phe exchange) humanized the reaction specificity of the enzyme [7, 29, 30]. This mutagenesis strategy did also work in vivo since Alox15-KI mice which express the Leu353Phe mutant of mouse Alox15 instead of the wildtype enzyme express an AA 15-lipoxygenating enzyme [9]. To confirm these findings for the present study, we prepared peritoneal lavage cells and bone marrow cells from Alox15-KI mice and wildtype control animals and performed ex vivo activity assays. From Fig. 1A it can be seen that 12S-HETE was the major AA oxygenation product formed by peritoneal lavage cells of wildtype mice and that the corresponding R-enantiomer was almost absent. 15-HETE was also formed and here again we observed a strong preponderance of the S-isomer. When Alox15-KI peritoneal lavage cells were used as enzyme source (Fig. 1B) 15S-HETE was the major AA oxygenation product and 12S-HETE was identified as minor side product. Similar experiments were carried out with the cells of four different individuals of each genotype and statistic evaluation of the product patterns is given in Fig. 1E. According to these data wildtype mouse Alox15 converts AA to a product mixture consisting of 12S-HETE and 15S-HETE in a ratio of 1: 10. In contrast, peritoneal lavage cells of Alox15-KI mice form an inverse product mixture. Here the 15S-HETE/12S-HETE ratio was 10: 1. When normalized to equal cell numbers the amounts of AA oxygenation products were similar for both genotypes.
Fig. 1
Ex vivo mouse Alox15 activity assays. Peritoneal lavage cells and bone marrow cells were prepared from four different animals of either genotype, ex vivo activity assays were carried out. The AA oxygenation products were prepared by RP-HPLC and further analyzed by combined normal-phase/chiral-phase HPLC. A Major AA oxygenation products formed by wildtype peritoneal lavage cells. B Major AA oxygenation products formed by Alox15-KI peritoneal lavage cells. C Major oxygenation products formed by wildtype bone marrow cells. D Major oxygenation products formed by Alox15-KI bone marrow cells. E Quantification of the product patterns formed by peritoneal lavage cells of wildtype and Alox15-KI mice and statistical comparison (Mann–Whitney U-test) of the two genotypes (n = 4, ****p < 0.0001). F Quantification of the product patterns formed by bone marrow cells of wildtype and Alox15-KI mice and statistical comparison (Mann–Whitney U-test) of the two genotypes (n = 4, ***p < 0.001)
Next, we performed similar ex vivo activity assays with bone marrow cells. In these cells Alox15 is also expressed at high levels but in addition the Alox12 gene is also active. As expected 12S-HETE was identified as dominant AA oxygenation product of wildtype bone marrow cells and small amounts of 15S-HETE were also present (Fig. 1C). When Alox15-KI bone marrow cells were used as enzyme source (Fig. 1D) the relative share of 15S-HETE was strongly increased (threefold) but 12S-HETE remained the major AA oxygenation product. Similar experiments were carried out with the cells of four different individuals of each genotype and statistic evaluation of the product patterns is given in Fig. 1F. The relatively high share of 12S-HETE may be related to the high expression of Alox12 in these cells. Since the Alox12 gene was not affected by our in vivo mutagenesis strategy it contributed to AA oxygenation by these cells. This is not the case for peritoneal lavage cells since Alox12 is hardly expressed in these cells. Taken together the data presented in Fig. 1 indicate that in vivo Leu353Phe exchange functionally humanized mouse Alox15.
In the DSS colitis model Alox15-KI mice develop less intense inflammatory symptomsThe DSS-colitis model is a frequently employed model of intestinal inflammation [23, 24]. Since humanization of Alox15 reaction specificity impacts the in vitro biosynthetic capacity of the enzyme for pro-resolving lipoxins [31, 32] we tested the susceptibility of Alox15-KI mice in the DSS colitis model. Female mice were treated with 1.5% DSS in the drinking water for 8 consecutive days. Then the DSS solution was replaced with normal drinking water and the animals were allowed to recover for 8 days. When wildtype animals were challenged this way (green symbols in Fig. 2A) we observed that at day 5 the animals started losing body weight. At day 9 the lowest body weights were reached and the animals started to recover. At day 16 the original body weights were reached again. For Alox15-KI mice different body weight kinetics were recorded (red symbols in Fig. 2A). For these mice the body weights remained unchanged between day 0–6. At day 7 and 8 the body weights were slightly reduced but already at day 9 the animals returned to their original body weights. These body weight kinetics suggested that Alox15-KI mice were strongly protected from DSS-induced enteral inflammation.
Fig. 2
DSS-induced colitis in Alox15-KI mice and wildtype control animals. Colonies of Alox15-KI mice, which express an Alox15 mutant (Leu353Phe) with humanized reaction specificity, and of wildtype control animals were established (see Materials and Methods) and tested in the DSS-induced experimental colitis model. The experimental approach, animal grouping and quantification of the readout parameters are explained in detail in Materials and Methods. A Bodyweight kinetics of Alox15-KI mice and of wildtype controls. B Colon length determined at different time points of the experimental protocol. C Representative histological cross section of the colon at different time points of the experimental protocol. Upper panels, wildtype mice, lower panels, Alox15-KI mice. Solid arrows indicate infiltrations of inflammatory cells. Dotted arrows indicate mucosal ulcerations. D–F Expression profiles of classical pro-inflammatory gene products. At different time points of DSS treatment animals were sacrificed, the colon was prepared and total RNA was extracted. Aliquots of the RNA preparations were reversely transcribed and qRT-PCR was carried out to quantify the colonic steady state mRNA concentrations. These concentrations are given by the copy numbers of target mRNA per 106 copies of Gapdh mRNA. Experimental raw data were evaluated statistically with the two-way ANOVA function of the GrahPad Prism program and the following n-numbers were included: wildtype (wt) animals without DSS, n = 5; Alox15-KI (15-KI) animals without DSS, n = 5; wildtype (wt) animals 8 days DSS, n = 5; Alox15-KI (15-KI) animals 8 days DSS, n = 5; wildtype (wt) animals 8 days after DSS removal, n = 5; Alox15-KI (KI) animals 8 days after DSS removal, n = 5. ns statistically not significant. *p < 0.05, **p < 0.01, ***p < 0.001, ****p < 0.0001
As second clinical readout parameter we determined the degree of colon shrinkage [23, 24]. Here we found that DSS treatment of wildtype mice induced significant colon shortening (green symbols in Fig. 2B) but the colon lengths did not normalize during the recovery period. For the Alox15-KI mice we also observed significant colon shrinkage but after the recovery period the original colon lengths were almost reached again. Interestingly, the degree of colon shrinkage was more pronounced in Alox15-KI mice and this data suggests that humanization of Alox15 promoted colon shrinkage. However, after the recovery period the colon lengths of the Alox15-KI mice did almost reach the original values (day 0) and this data suggests that Alox15-KI mice apparently recovered more rapidly after removal of the inflammatory stimulus.
Next, we evaluated histological preparations of colon tissue for inflammatory symptoms and quantified three morphological inflammation parameters according to a semi-quantitative scoring system [33]: (1) extent of neutrophil infiltration, (2) extent of epithelial defects, (3) extent of mucosal ulcerations. For both, Alox15-KI mice and wildtype control animals we observed normally structured colon walls before DSS application (Fig. 2C, left panels). Thus, humanization of the Alox15 did not impact the structure of the colon wall. After 8 days of DSS treatment we observed significant neutrophil infiltrations in the colon wall of both Alox15-KI mice and wildtype controls but according to our scoring system the intensity of the inflammatory alterations was higher in the wildtype mice. During the resolution period most of the inflammatory alterations disappeared but we still observed neutrophils in the colon wall of both genotypes. The quantitative results of the scoring procedure (see Table S3, additional file 1) indicate that our experimental protocol induced a rather mild experimental colitis.
Intestinal inflammation alters the gene expression patterns in the colon wall and we profiled by qRT-PCR (Fig. 2D–F) the expression of three independent pro-inflammatory gene products [inducible nitric oxide synthase (iNOS), tumor necrosis factor alpha (TNFalpha) and interleukin-1beta (IL1beta)]. We found that these genes exhibited similar expression kinetics during enteral inflammation. Their expression levels were low before DSS administration but increased during the acute phase of inflammation. After the recovery period the expression levels were down to starting values. In principle, similar kinetics were observed for wildtype control animals and Alox15-KI mice but there were interesting differences between the two genotypes. At day 8 of DSS treatment iNOS expression was (Fig. 2D) significantly higher in wildtype mice than in Alox15-KI animals but similar differences were not observed in normal colon tissue (no DSS) and after the recovery period (day16). Considering the fact that iNOS is a classical pro-inflammatory enzyme, the lower expression levels of this enzyme in Alox15-KI mice at day 8 of DSS treatment were consistent with the protective effect of Alox15 humanization shown in Fig. 2A. Similar results were obtained for TNFalpha (Fig. 2E) and IL1beta (Fig. 2F) but for these proteins the differences did not reach the level of statistical significance. The most interesting finding of our expression studies was that during the acute phase of inflammation the expression of iNOS, TNFalpha and IL1beta were upregulated in wildtype mice. In contrast, in Alox15-KI mice the degree of upregulation was less pronounced.
Profiles of specific oxylipins in colon tissues of Alox15-KI mice and wildtype controls during the time-course of DSS colitisAA is one of the major polyenoic fatty acids in mammalian cells and there are six major AA oxygenation products (15-HETE, 12-HETE, 11-HETE, 9-HETE, 8-HETE, 5-HETE). These products are formed via nonenzymatic oxygenation reactions but also via the ALOX pathway of the AA cascade. Their biosynthetic mechanisms (Fig. 3A) involve hydrogen abstraction from one of the three bisallylic methylenes (C7, C10, C13) and either [+ 2] (blue) or [-2] (brown) radical rearrangement.
Fig. 3
Quantification of arachidonic acid oxygenation products in colon tissue at different time points of DSS-induced colitis. Colitis induction, sample workup and LC–MS/MS analysis as described in Materials and Methods. A AA is oxidized to six major oxygenation products (HETE-isomers). Biosynthesis of 15-HETE, 12-HETE and 9-HETE involve hydrogen abstraction from C13, C10 and C7, respectively, as well as [+ 2] radical rearrangement (blue). Formation of 11-HETE, 8-HETE and 5-HETE proceeds via C13, C10 and C7, respectively, hydrogen abstraction and [-2] radical rearrangement (brown). B Colonic 15-HETE concentrations. C Colonic 11-HETE concentrations, D Colonic 12-HETE concentrations, E Colonic 8-HETE concentrations, F colonic 9-HETE concentrations. G Colonic 5-HETE concentrations. The experimental raw data were evaluated statistically with the two-way ANOVA function of the GraphPad Prism program and the following n-numbers were included: wildtype (wt) animals without DSS, n = 5; Alox15-KI (KI) animals without DSS, n = 5; wildtype (wt) animals 8 days DSS, n = 5; Alox15-KI (KI) animals 8 days DSS, n = 5; wildtype (wt) animals 8 days after DSS removal, n = 5; Alox15-KI (KI) animals 8 days after DSS removal, n = 5. ns not significant. *—p < 0.05, **—p < 0.01, ***—p < 0.001
For 11-HETE (Fig. 3C), 9-HETE (Fig. 3F) and 8-HETE (Fig. 3E) we did not observe significant differences between the two genotypes at either time point of the enteral inflammation. If Alox15 significantly contributes to the formation of HETE isomers in the noninflamed colon wall we expected reduced 12-HETE levels in the colon tissue of Alox15-KI mice when compared with wildtype controls. In contrast, the colonic 15-HETE levels should be elevated. Our oxylipidomic data confirmed that the 12-HETE concentrations were higher in wildtype mice (Fig. 3D) although the difference between the two genotypes at day 8 of DSS treatment did not reach the level of statistical significance. Unfortunately, we did not observe an anti-parallel decrease in the 15-HETE levels (Fig. 3B). As leukotriene B4 (LTB4) 5-HETE is an AA oxygenation product formed via the Alox5 pathway. Since Alox5 is a canonic pro-inflammatory enzyme colonic 5-HETE concentrations should be elevated at day 8 of the experimental protocol. Such kinetics were indeed observed for Alox15-KI mice (red bars in Fig. 3G). However, for wildtype mice we did not observe similar kinetics. Here no significant differences were observed between the different time points of the inflammatory process.
Next, we quantified the oxygenation products of 5,8,11,14,17-eicosapentaenoic acid (EPA). This PUFA carries 4 bisallylic methylenes and thus (Fig. 4A), 8 different major EPA oxygenation products can be formed. Except for 14-HEPE (Fig. 4C), which was not part of our analytical protocol, we quantified the colon concentrations of these metabolites but did not detect significant differences between the two genotypes for 18-HEPE (Fig. 4B), 8-HEPE (Fig. 4G) and 5-HEPE (Fig. 4I) at any time point of the inflammatory process. For 11-HEPE (Fig. 4E) we observed a small but significant difference between the two genotypes at the end of the recovery period. 15-HEPE (Fig. 4D) and 12-HEPE (Fig. 4F), which are the major EPA oxygenation products formed by mouse Alox15 and its Leu353Phe mutant, were detected as dominant EPA oxygenation products in the colon wall. In contrast, 8-HEPE (Fig. 4G) and 9-HEPE (Fig. 4H) were only present at minor concentrations.
Fig. 4
Quantification of eicosapentaenoic acid oxygenation products in colon tissue at different time points of DSS-induced colitis. Colitis induction, sample workup and LC–MS/MS analysis as described in Materials and Methods. A EPA is oxidized to eight major oxygenation products (HEPE-isomers). Biosynthesis of 18-HEPE, 15-HEPE, 12-HEPE and 9-HEPE involve hydrogen abstraction from C16, C13, C10 and C7, respectively, as well as [+ 2] radical rearrangement (blue). Formation of 14-HEPE, 11-HEPE, 8-HEPE and 5-HEPE proceeds via C16, C13, C10 and C7, respectively, hydrogen abstraction and [-2] radical rearrangement (brown). B Colonic 18-HEPE concentrations. C Colonic 14-HEPE concentrations was not measured. D Colonic 15-HEPE concentrations. E Colonic11-HEPE concentrations. F colonic 12-HEPE concentrations. G Colonic 8-HEPE concentrations. H Colonic 9-HEPE concentrations. I Colonic 5-HEPE concentrations. The experimental raw data were evaluated statistically with the two-way ANOVA function of the GraphPad Prism program and the following n-numbers were included: wildtype (wt) animals without DSS, n = 5; Alox15-KI (KI) animals without DSS, n = 5; wildtype (wt) animals 8 days DSS, n = 5; Alox15-KI (KI) animals 8 days DSS, n = 5; wildtype (wt) animals 8 days after DSS removal, n = 5; Alox15-KI (KI) animals 8 days after DSS removal, n = 5. ns not significant, *—p < 0.05, **—p < 0.01, ***—p < 0.001, ****—p < 0.0001
Recombinant mouse Alox15 oxygenates EPA in vitro predominantly to 12-HEPE but its functionally humanized Leu353Phe mutant forms a 2: 1 mixture of 15-HEPE and 12-HEPE [4]. If our genetic manipulation of the Alox15 gene is mirrored on the level of colon lipids, Alox15-KI mice were expected to show elevated 15-HEPE levels but reduced 12-HEPE levels when compared with wildtype control animals. When we quantified the 15-HEPE tissue concentrations of Alox15-KI mice and corresponding wildtype controls at day 8 of DSS treatment we indeed observed significantly elevated levels in Alox15-KI mice (Fig. 4D). A similar trend was also observed at the other time points of enteral inflammation (no DSS, day 16) but here the differences did not reach the level of statistical significance. Unfortunately, we did not see an anti-parallel decrease in the 12-HEPE levels in Alox15-KI mice. In fact, no significant differences in the colonic 12-HEPE levels were detected when the two genotypes were compared (Fig. 4F).
Because of its high degree of unsaturation 4,7,11,13,16,19-docosahexaenoic acid (DHA) is very sensitive to auto-oxidation and 10 different cis–trans conjugated diene products (HDHA-isomers) can be formed (Fig. 5A). Moreover, this n-3 polyenoic fatty acid is a suitable substrate for different ALOX-isoforms which convert this substrate to highly specific oxygenation products [4].
Fig. 5
Quantification of docosahexaenoic acid oxygenation products in colon tissue at different time points of DSS-induced colitis. Colitis induction, sample workup and LC–MS/MS analysis as described in Materials and Methods. A DHA is oxidized to ten major oxygenation products (HDHA-isomers). Biosynthesis of 20-HDHA, 17-HDHA, 14-HDHA, 11-HDHA, and 8-HDHA involves hydrogen abstraction from C18, C15, C12, C9 and C6, respectively, as well as [+ 2] radical rearrangement (blue). Formation of 16-HDHA, 13-HDHA, 10-HDHA, 7-HDHA, and 4-HDHA proceeds via C18, C15, C12 and C9 and C6, respectively, hydrogen abstraction and [-2] radical rearrangement (brown). B Colonic 20-HDHA concentrations. C Colonic 16-HDHA. D) Colonic 17-HDHA concentrations. E Colonic 13-HDHA concentrations. F colonic 14-HDHA concentrations. G Colonic 10-HDHA concentrations. H Colonic 11-HDHA concentrations. I Colonic 7-HDHA concentrations. J Colonic 8-HDHA concentrations, K 4-HDHA concentrations. The experimental raw data were evaluated statistically with the two-way ANOVA function of the GraphPad Prism program and the following n-numbers were included: wildtype (wt) animals without DSS, n = 5; Alox15-KI (KI) animals without DSS, n = 5; wildtype (wt) animals 8 days DSS, n = 5; Alox15-KI (KI) animals 8 days DSS, n = 5; wildtype (wt) animals 8 days after DSS removal, n = 5; Alox15-KI (KI) animals 8 days after DSS removal, n = 5. ns not significant, *—p < 0.05, **—p < 0.01, ***—p < 0.001, ****—p < 0.0001
When we compared the colonic HDHA concentrations at the different time points of the experimental protocol we did not observe significant differences between the two genotypes for 20-HDHA (Fig. 5B), 16-HDHA (Fig. 5C), 13-HDHA (Fig. 5E), 10-HDHA (Fig. 5G), 11-HDHA (Fig. 5H), 7-HDHA (Fig. 5I), 8-HDHA (Fig. 5J) and 4-HDHA (Fig. 5K). In contrast, for the Alox15 products 17-HDHA (Fig. 5D) and 14-HDHA (Fig. 5F) we detected significant differences between humanized Alox15-KI mice and wildtype control animals. Recombinant mouse Alox15 oxygenates DHA to a 1:2 mixture of 17- and 14-HDHA [4]. If our genetic manipulation of the Alox15 gene is mirrored on the level of the colon lipids, Alox15-KI mice should have lower tissue concentrations of 14-HDHA but elevated levels of 17-HDHA when compared with wildtype controls. Our colon oxylipidome analyses revealed that Alox15-KI mice (Fig. 5D) show elevated 17-HDHA tissue concentrations when compared with wildtype controls independent of the time point of the disease. In contrast, the 14-HDHA concentrations in the colon of wildtype animals were higher than those in the Alox15-KI mice (Fig. 5F) although at day 8 the difference did not reach the level of statistical significance. When we explored the kinetic of 17-HDHA in Alox15-KI mice during the time course of experimental inflammation (Fig. 5D) we found significantly elevated tissue levels after 8 days of DSS treatment. After the resolution period the 17-HDHA levels were back to the initial levels. However, when we followed the 17-HDHA kinetics in wildtype mice we did not see such kinetic differences (Fig. 5D). These data suggest that the catalytic activity of the mutant Alox15 may play a role in the pathogenesis of DSS colitis. Similar kinetics were also observed for the colon concentrations of 7-HDHA, the major DHA oxygenation product of mouse Alox5 (Fig. 5I) but for this metabolite we did not observe significant differences between the two genotypes.
Linoleic acid (LA) and alpha-linolenic acid (ALA) are among the most abundant polyenoic fatty acids in mammalian cells. LA involves only one (Fig. 6A) bisallylic methylene and thus, only two major cis–trans conjugated dienes (13-HODE, 9-HODE) can be formed. Recombinant mouse Alox15 converted LA to 13-HODE but this is also the case for its functionally humanized Leu353Phe mutant. When we analyzed the colon concentrations of 13-HODE(Z,E) (Fig. 6B) and 9-HODE(E,Z) (Fig. 6C), we did not detect significant differences between Alox15-KI mice and wildtype controls. Moreover, 13-HODE and 9-HODE were present at similar concentrations (Fig. 6B + C) and these data suggest that LA auto-oxidation is the dominant biosynthetic pathway. Moreover, the colon concentrations of the 13-HODE and 9-HODE did not change during the time course of inflammation (Fig. 6B + C) suggesting that these metabolites may not be of major patho-physiological relevance for colon inflammation.
Fig. 6
Quantification of the oxygenation products of different polyenoic fatty acids in colon tissue at different time points of DSS-induced colitis. Colitis induction, sample workup and LC–MS/MS analysis as described in Materials and Methods. A LA is oxidized to two major oxygenation products (HODE-isomers). Biosynthesis of both 9-HODE and 13-HODE involves hydrogen abstraction from C11 but either [+ 2] (13-HODE, blue) or [-2] (9-HODE, brown) radical rearrangement. B Colonic concentrations of 13-HODE. C Colonic concentrations of 9-HODE. D ALA carries two bisallylic methylenes (C11, C14) and thus, four major oxygenation products (13-HOTrE, 9-HOTrE, 16-HOTrE, 12-HOTrE) can be formed but we only profiled the colon concentrations of 13- and 9-HOTrE. Biosynthesis of these two metabolites involves hydrogen abstraction from C11 but either [+ 2] (13-HODE, blue) or [-2] (9-HODE, brown) radical rearrangement. E Colonic concentrations of 13-HOTrE. F Colonic concentrations of 9-HOTrE. G Colonic concentrations of leukotriene B4. H Colonic concentrations of neuroprotection-1. I Colonic concentrations of maresin-1. J Colonic concentrations of resolvin D5. The experimental raw data were evaluated statistically with the two-way ANOVA function of the GraphPad Prism program and the following n-numbers were included: wildtype (wt) animals without DSS, n = 5; Alox15-KI (15-KI) animals without DSS, n = 5; wildtype (wt) animals 8 days DSS, n = 5; Alox15-KI (15-KI) animals 8 days DSS, n = 5; wildtype (wt) animals 8 days after DSS removal, n = 5; Alox15-KI (15-KI) animals 8 days after DSS removal, n = 5. ns statistically not significant. *—p < 0.05, **—p < 0.01, ***—p < 0.001, ****—p < 0.0001
For the two ALA (Fig. 6D) metabolites 13-HOTrE(Z,E,Z) and 9-HOTrE(E,Z,Z) (Fig. 6E + F) similar conclusions can be drawn but there were two interesting peculiarities: (i) 13-HOTrE(Z,E,Z) was detected in much higher quantities than 9-HOTrE(E,Z,Z) (Fig. 6E + F), which excludes auto-oxidation as major biosynthetic pathway. (ii) At day 8 of the DSS treatment we analyzed significantly lower 13-HOTrE(Z,E,Z) concentrations in the colons of Alox15-KI mice when compared with wildtype controls. Since the biosynthetic route of 13-HOTrE(Z,E,Z) formation during colitis remains unclear the reduction of 13-HOTrE(Z,E,Z) at the peak of inflammation is difficult to interpret.
Finally, we quantified the colon concentrations of canonic pro- and anti-inflammatory lipid mediators. LTB4 is a classical pro-inflammatory eicosanoid [34], which should be present in the colon tissue at elevated concentrations at the peak of inflammation. When we profiled the colonic LTB4 levels during the time course of enteral inflammation we observed the expected kinetics but the differences between the three time points in wildtype mice did not reach the level of statistical significance (Fig. 6G). In the Alox15-KI mice we observed similar kinetics but here the differences between the three time points were statistically significant (Fig. 6G). When we compared the colonic LTB4 levels between Alox15-KI mice and wildtype controls we did not detect significant differences between the two genotypes at either time point. (Fig. 6G). Thus, our genetic manipulation of the Alox15 gene did obviously not alter LTB4 metabolism.
Neuroprotectin 1 (NPD1, 10R,17S-dihydroxy-4Z,7Z,11E,13E,15Z,19Z-docosahexaenoic acid) is a dihydroxy derivative of DHA, exhibits neuroprotective properties [35] and has been classified as special pro-resolving mediator (SPM) [36]. We detected small amounts of NPD-1 in the colon of untreated wildtype mice (Fig. 6H) but the tissue concentrations were strongly increased at day 8 of DSS-treatment. After the recovery period the NPD-1 levels went back to normal. For Alox15-KI mice similar kinetics were observed but we did not detect significant differences between the two genotypes at either time point of the experimental colitis. Almost identical kinetics were measured for the dihydroxy SPMs maresin-2 (Mar-2, 13R,14S-dihydroxy-4Z,7Z,9E,11E,16Z,19Z-docosahexaenoic acid, Fig. 6I) and resolvin D5 (RvD5, 7S,17S-dihydroxy-4Z,8E,10Z,13Z,15E,19Z-docosahexaenoic acid, Fig. 6J). There were, however, interesting differences in the colon concentrations of these two SPMs. For Mar-2 we measured consistently lower concentrations in the colon tissue of Alox15-KI mice (Fig. 6I). These differences, which were statistically significant, suggest that humanization of the reaction specificity of mouse Alox15 may have impaired the biosynthetic capacity of the enzyme for maresin-2. The possible mechanistic basis for this finding will be explained later on in this paper (Discussion). In contrast, the biosynthetic capacity for RvD5 was apparently augmented by humanization of the reaction specificity of mouse Alox15. For this metabolite we consistently measured significantly higher colon concentrations in the colon tissue of Alox15-KI mice. These results can easily be explained by the modified catalytic properties of the humanized Alox15 (see Discussion).
In addition to these dihydroxy SPMs we also attempted to quantify the following representatives of the SPM family: RvD1, RvD2, RvD3, RvD4, LxA4, and LxB4. Unfortunately, neither of these metabolites could be quantified in normal or inflamed colon tissue of either genotype (see Figure S1, additional file 1). If present, their tissue concentrations were below the detection limits of our analytical procedure (see Table S1 + S2, additional file 1).
There was no difference between Alox15-knock-in mice and wildtype controls in the paw edema inflammation modelTo test the Alox15-KI mice in a second type of inflammation we employed the Freund’s complete adjuvant (CFA) induced paw edema model [37]. As clinical readout parameter we determined the degree of paw swelling, the expression of classical pro-inflammatory proteins and the sensitivity of the inflamed paw for thermic (Hargreaves test) and mechanic (von Frey test) stimulation. From Fig. 7A it can be seen that injection of PBS into the hind paw did not alter the paw volume when compared with an untreated paw (blank, BL) of wildtype mice. However, injection of Freund’s complete adjuvant led to a significant increase in the paw volume indicating the formation of an inflammatory edema. Similar alterations were induced in Alox15-KI mice (Fig. 7B). When we compared the degree of paw edema of Alox15-KI mice and wildtype controls we did not observe significant differences (Fig. 7C). These data suggest that Alox15-KI mice are neither protected from nor sensitized to adjuvant induced paw swelling.
Fig. 7
Freund’s complete adjuvant induced paw edema inflammation model. Paw edema was induced by subcutaneous injection of Freund’s complete adjuvant (see Material and Methods. A–C After 2 days the paw volume was measured as clinical readout parameter for the intensity of the inflammatory reaction. A Comparison of paw volumes in wildtype mice. B Comparison of paw volumes in Alox15-KI mice, C Comparison of paw volumes in wildtype vs. Alox15-KI mice 2 days after CFA injection. D–G Quantification of the expression profiles of pro-inflammatory genes by qRT-PCR. D iNOS, E TNFalpha. F IL1beta, G IL6. H–J Two days after CFA injection the paw withdrawal latency (Hargreaves test) was measured as readout parameter for pressure-induced pain perception. H Wildtype mice. I Alox15-KI mice. J Comparison of paw withdrawal latency of wildtype vs. Alox15-KI mice 2 days after CFA injection. K–M Two days after CFA injection the paw withdrawal threshold (von Fey test) was measured as readout parameter for heat-induced pain perception. K Wildtype mice. L Alox15-KI mice. M Comparison of paw withdrawal threshold of wildtype vs. Alox15-KI mice 2 days after CFA injection. The experimental raw data were evaluated statistically with the two-way ANOVA function of the GraphPad Prism program, n = 10 in each experimental group. ns not significant; ***p < 0.001, ****p < 0.0001
Next, we quantified by qRT-PCR the expression of classical pro-inflammatory gene products. As indicated in Fig. 7D iNOS mRNA was absent in normal paw tissue of both Alox15-KI mice and wildtype controls. In contrast, 2 days after CFA injection significant levels of iNOS mRNA were detected in the inflamed tissue of both genotypes. We even observed significantly higher iNOS mRNA levels in Alox15-KI mice when compared with wildtype control animals suggesting a higher degree of inflammation in this genotype. For TNF alpha, (Fig. 7E), IL1beta (Fig. 7F) and IL6 (Fig. 7G) we obtained similar data but for these pro-inflammatory cytokines we did not observe any differences between Alox15-KI mice and wildtype controls. Taken together, these expression profiles are consistent with the previous observation (Fig. 7C) that functional humanization of mouse Alox15 does not protect the animals in this particular inflammation model.
Pain is a frequent symptom of most inflammatory reactions and inflammatory pain can be quantified by a number of complex assay systems. For our study we used the Hargreaves [38] and the von Frey-tests [
Comments (0)