
Remember me


Human cardiac tissue samples used in this study were collected from Auckland City Hospital. Patients consented to the study prior to undergoing coronary artery bypass grafting (CABG) surgery, as per Human and Disability Ethics Committee of New Zealand approval (HDEC PR6432).
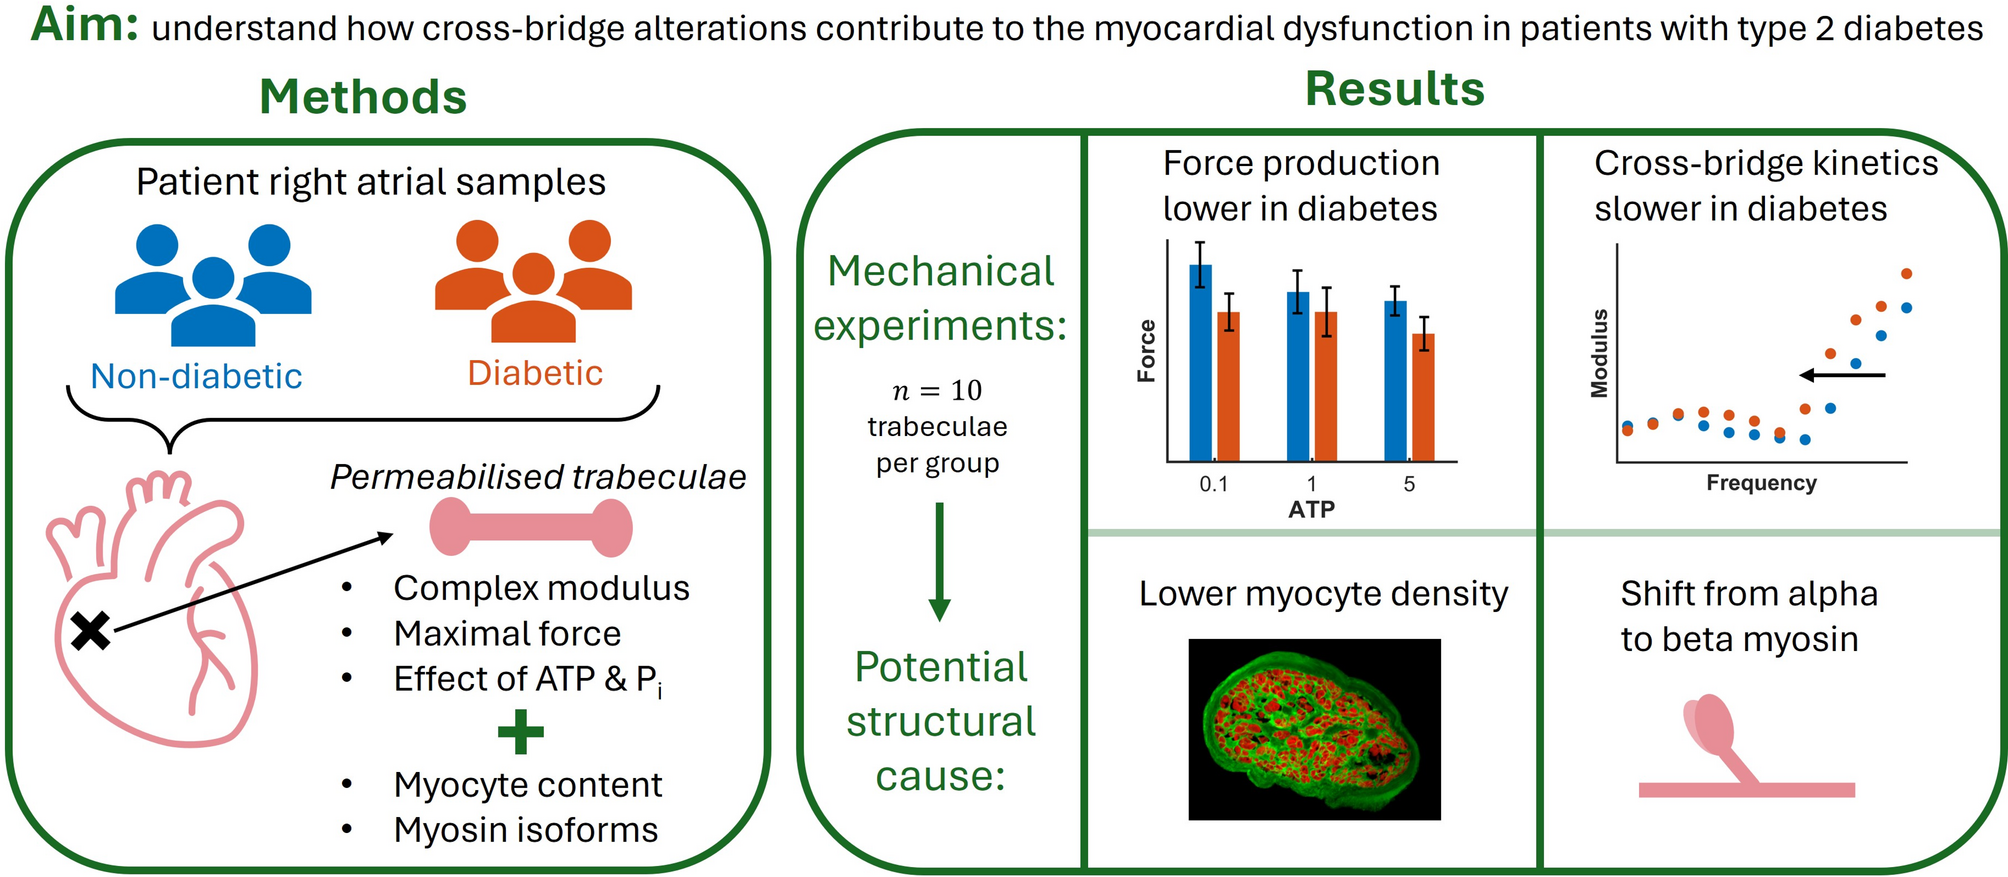
Trabeculae were collected from eight patients with type 2 diabetes (\(n=10\)) and from seven non-diabetic patients (\(n=10\)). Up to two trabeculae were dissected from the same patient tissue sample. There were three female patients in the diabetic group and one in the non-diabetic group. The patient groups did not differ in age, Body Mass Index (BMI) and estimated pre-operative ejection fraction (Table 1). E/e′ ratio and HbA1c were significantly higher in the diabetic group. None of the patients had heart failure at the time of surgery.
Table 1 Key patient data associated with the trabeculae measured in the studySample procurementA small section of tissue from the right atrial appendage (RAA) was removed during the surgery, with maximum dimensions of 5 mm \(\times \) 5 mm \(\times \) 20 mm. Immediately after excision, the sample was transferred into a chilled Krebs-Henseleit (KH) buffer and rapidly (under 10 min) brought back to the laboratory for dissection. The KH buffer used for transport and dissection was made up as follows: 118 mM NaCl, 4.75 mM KCl, 1.18 mM \(\hbox _4\), 1.18 mM \(\hbox _2\)\(\hbox _4\), 24.8 mM \(\hbox _3\), 11 mM glucose, 25 mM BDM, 0.25 mM \(\hbox _2\) and continuously bubbled with 95 % \(\hbox _2\)/5 % \(\hbox _2\) to maintain pH of 7.4.
Upon arrival at the laboratory, the sample was pinned in place to a dissection bath and superfused with continuous flow of KH buffer at room temperature. Free-running trabeculae were dissected from the endocardial surface of the atrial sample and placed into a 4 °C permeabilisation solution for approximately 20 h. The permeabilisation solution had a pH of 7.0, an ionic strength of 180 mM and contained 7 mM EGTA, 20 mM imidazole, 4 mM MgATP, 1 mM Mg2+, 10 μg/mL leupeptin, 30 mM BDM, 1 % v/v Triton, 50 % v/v glycerol.
Following trabecula dissections, subsamples spanning the wall thickness of the patient samples were dissected in blocks, flash-frozen in liquid nitrogen and stored at − 80 °C for 9–18 months.
Mechanical measurementsOur custom experimental device [11, 12] was used to perform a series of mechanical experiments on the permeablised trabeculae. These experiments captured active and passive properties of the muscle, as well as the response of the muscle to changes in ATP and Pi concentration.
Relaxing, pre-activating and activating solutions were prepared for the experiments (summarised in Table 2). All of the experimental solutions were adjusted with KCl to produce a final ionic strength of 180 mM and with KOH to produce a pH of 7.0 at the experimental temperature (37 °C). The set-up phase of the experiments was performed at room temperature, so relaxing solution was also prepared at 22 °C. The final concentrations of each metal, ligand, and metal-ligand complex were calculated using version 2.5 of the MaxChelator computer program [13].
Table 2 Solutions used for contractile experimentsFollowing permeabilisation, each trabecula was rinsed with relaxing solution and mounted into the experimental device at room temperature. Muscles were stretched to a sarcomere length of 2.2 μm (optimal length) where their final experimental lengths were measured. Muscle force was set to be zero at 85 % of the optimal muscle length (corresponding to a sarcomere length of 1.87 μm). After the set-up phase was complete, the experimental baths were heated to 37 °C.
In the subsequent mechanical interventions, complex modulus measurements were performed at 12 logarithmically-spaced frequencies between 0.18 Hz and 100 Hz. At each frequency, the force generated by the muscle was measured under sinusoidal length perturbations, with a peak-to-peak amplitude of 0.25 % of muscle length. The complex modulus was calculated at each frequency, by dividing the fast Fourier transform of force by the fast Fourier transform of normalised muscle length. Measurements taken in relaxing solution (pCa 9.0) are referred to as passive measurements, while those taken in activating solution (pCa 4.5) are referred to as total measurements, where total = passive + active. Active measurements, which reflect the cross-bridge properties alone, were thus found as the difference between equivalent passive and total measurements.
Initial mechanics protocolThe first stage of experiments, where the passive and baseline active muscle properties were measured, was identical across all muscles. Prior to activation, the muscle was switched into a bath of pre-activating solution for 1 min. Under baseline activating solution (5 mM ATP and 1 mM Pi), the muscle was held at a constant length until a steady-state force was reached. Here, we measured the total complex modulus (as previously described) as well as the total force-length relationship. The steady-state forces were recorded after shortening the muscle by 5%, 10% and 15%, as well as at the optimal muscle length. Following these experiments, the muscle was switched back into relaxing solution and passive measurements were collected. The passive complex modulus was measured at optimal length and the steady-state passive force was recorded at 100%, 95%, 90% and 85% of optimal muscle length.
Metabolite-sensitive mechanics protocolFollowing the initial protocol, a series of experiments were performed to assess the influence of ATP and Pi concentrations on the mechanics of the muscle. Five different conditions of metabolite concentrations were used (Table 3), resulting in three different concentrations for each of ATP and Pi.
Table 3 ATP and Pi concentrations of the five activating solutions used for this studyTo account for the effect of order dependence on the results, a balanced Latin square experimental design was used to prescribe the order of presentation of the metabolite solutions. This design included 10 unique permutations of exposure order for the five different metabolite interventions. Within the diabetic and non-diabetic patient groups, each of the exposure patterns was used for one trabecula.
For each activating solution, the muscle was, again, initially placed in pre-activating solution for 1 min. The muscle was then switched to a bath containing one of the five activating solutions listed in Table 3 until the force generated reached a plateau. After reaching a steady state, the total complex modulus of the muscle was measured before it was returned to a relaxing solution in preparation for the next intervention.
Following the second and fifth interventions, the muscle was activated in the baseline solution and the force was recorded to enable consistent measurement of any force rundown or drift throughout the experiment.
Experimental analysisAll muscle forces and complex moduli were converted to units of stress (Pa) following the experiment. This normalises the force measurements to the cross-sectional area of the trabecula and provides more consistent comparison between muscles. The measurement of cross-sectional area used for this normalisation is detailed in Section “Trabecula structural imaging”.
To account for the unavoidable reduction in maximum force production throughout the experiment (rundown), a linear model was used to adjust the active stress measurements. The slope of force rundown was found by fitting the four measurements of steady-state stress made in baseline activating solution for each trabecula. Using the relative time elapsed in the experiment, this slope was used to adjust all active stresses. The adjustment ensured that each stress measurement was in proportion to that which was recorded in the initial baseline mechanics protocol.
To assess the frequency behaviour of the muscles quantitatively, the active complex moduli under different metabolite conditions were fitted to an exponential model [14] with two processes:
$$\begin Y_a=H+\frac+\frac, \end$$
(1)
where \(Y_a\) is the active complex modulus, H, B and C represent the magnitudes of the components, b and c are the characteristic frequencies of the two exponential processes, and f is the frequency of the complex modulus. This is the simplest model that captures the most important frequency information of the complex modulus, namely the dip (b) and high pass (c) components. The model was fitted to the active complex modulus of each muscle under all metabolite conditions in MATLAB, using a nonlinear least-squares algorithm.
To assess if there was an effect of diabetes on the measured results, muscles were grouped depending on the diabetic status of the patients, and statistical analyses were performed in RStudio. Two-way ANOVA was used to determine if there was a main effect of diabetes on the dynamic modulus (magnitude of the complex modulus) across all frequencies, the active stress generated across the different metabolite conditions and both active and passive stresses across different muscle lengths. Three-way ANOVA was used to assess the effect of diabetes on the dynamic modulus across all frequencies and across the metabolite conditions. The effect of diabetes on these metrics was deemed significant when \(p<0.05\) for the patient group effect. Pairwise comparisons were made using Tukey’s test when the ANOVA group effect was significant and relevant comparisons were reported when significant. Note that for most tests only the overall group effect was significant. The difference in metabolite sensitivity between the patient groups was deemed significant in ANOVA analyses when \(p<0.05\) for the interaction effect between patient group and metabolite condition.
All measurements for the non-diabetic and diabetic muscle groups are presented in text and figures as the group mean ± standard error.
Trabecula structural imagingAfter the mechanical experiment, trabeculae were prepared for immunolabelling and imaging. Each trabecula was stretched to its experimental length and fixed with 2 % paraformaldehyde (PFA) in phosphate-buffered solution (PBS) for 10 min at room temperature. Fixed trabeculae were cryoprotected in PBS with 30 % sucrose and then stored in optimal cutting temperature compound at − 80 °C until cryosectioning, where six to eight 10 μm transverse sections were taken at >100 μm intervals across the length of the trabecula.
The antibody labelling protocol to stain the tissue sections was adapted from [15]. Sections were rehydrated with PBS and blocked for 1 h with Image iT FX Signal Enhancer. Wheat Germ Agglutinin (WGA) conjugated with Alexa Fluor 488 was added at a concentration of 1 mg/L and Alexa Fluor 594 phalloidin was added at 0.264 μM, to PBS with 1% bovine serum albumin (BSA) and 0.01 % sodium azide. Prolong Gold antifade reagent was used to mount coverslips on top of the sections. The slides were cured at 4 °C for 72 h before imaging.
Images of the trabecula cross-sections were acquired with a Nikon C1 confocal microscope (20\(\times \) objective) and EZ-C1 software (e.g. Fig. 1A) and processed semi-automatically in ImageJ.
Fig. 1
A sample confocal image showing the analysis performed in ImageJ. A trabecula cross-section with phalloidin (labelling f-actin) in red and WGA (labelling cell membrane and extracellular matrix) in green, B identified WGA area (green in panel A), C mask of the total cross-sectional area of the trabecula, D identified phalloidin area (red in panel A). The myofilament fraction for this section was 0.36
WGA labelling (Fig. 1B) was used to select the trabecula perimeter and create a mask (Fig. 1C) whose pixels were counted to find the cross-sectional area of each section. The myofilament area in each section was similarly found by counting the pixels with phalloidin labelling above a certain threshold (Fig. 1D) and used to determine the fraction of the total area made up of myofilaments (phalloidin). This provides a reasonable proxy for the entire myocyte area. For each trabecula, the myofilament fraction and the total area of the cross-section were averaged across all sections which were successfully processed (at least two for each muscle). The fraction of myofilament content in each trabecula was compared between the non-diabetic and diabetic muscle groups by unpaired two-tailed t-test.
The measurement of trabecula cross-sectional area was used to normalise the measured forces for the final active and passive stresses presented in “Results” section. Additionally, the myofilament area was used to normalise the active stresses measured in the trabeculae which provides a measure of the contractile properties of the myofilaments themselves, rather than the entire muscle. This distinction was made as we expected these human muscles to contain varying amounts of extracellular matrix materials [16].
Myofilament protein analysis (LC-SWATH-MS/MS)Mass spectrometry analysis of the myofilament proteins was performed using the flash-frozen tissues from the RAA samples. These were acquired from a group of eight diabetic and six non-diabetic patient samples from which trabeculae used for the previously described experiments were obtained. Endocardial tissue pieces of around 5 mm \(\times \) 5 mm \(\times \) 2 mm were placed into 150 μL of lysis buffer containing 7 M urea, 2 M thiourea, 5 mM DTT in 50 mM ammonium bicarbonate and probe sonicated using a Qsonica Q125 ultrasonic processor (Qsonica LLC, CT, USA) for 4\(\times \)30 s at 30% amplitude. Samples were then centrifuged at 16,000 g for 5 min at 5 °C and an aliquot (50 μg of total protein) was taken from each sample and subsampled. Disulphide bonds were then reduced at 56 °C for 15 min in a temperature-controlled microwave (CEM, Mathews, NC, USA). Cysteines were alkylated with 15 mM iodoacetamide (IAM) in the dark for 40 min. 10 mM Cysteine was added to quench any residual IAM. The sample was then diluted 10-fold with 50 mM ammonium bicarbonate, and 1 μg of sequencing-grade modified porcine trypsin (Promega, Madison, WI, USA) added. Samples were incubated at 39 °C overnight in a temperature-controlled mini-incubator. The next day the digested samples were acidified with a small volume of 50 % formic acid, and then desalted on a 10 mg Oasis HLB SPE cartridge (Waters, MA, USA), eluting with 300 μL of 50% acetonitrile. The extract was then concentrated to approximately 25 μL in a vacuum centrifuge (Thermo Savant, Holbrook, NY, USA).
Sample extracts were analysed at 30-fold dilution with 0.1% formic acid and 8–10 μL injected (as appropriate based on signal intensity) onto a 0.3 mm \(\times \) 10 mm trap column packed with 3 μm 300 Å C4 media (Dr Maisch, Ammerbuch-Entringen, Germany) and desalted for 3 min at 15 μL/min, before being separated with the following gradient at 6 μL/min using a Micro M5 UPLC system (AB SCIEX, Framingham, MA, USA): 0 min 1% B; 0.1min 5% B; 16 min 40%B; 17.5 min 98% B; 19.5 min 98% B; 20 min 1% B; 30 min 1% B, where A was 0.1% formic acid in water and B was 0.1% formic acid in acetonitrile.
The LC effluent was directed into a ZenoTOF 7600 Quadrupole-Time-of-Flight mass spectrometer (AB SCIEX) for SWATH acquisition comprised of 50 variable width isolation windows (with 1 Da overlap) covering a precursor mass range of 350–1100 m/z. The accumulation time was 50 ms for the initial TOF-MS scan, and 15 ms for each SWATH MS/MS scan (140–1600 m/z), giving a total cycle time of approximately 0.85 s. The mass spectrometer and UPLC system were under the control of the Sciex OS software package (AB SCIEX).
The resulting 14 MS/MS datasets were collectively searched against a Human protein database downloaded from Uniprot using DIA-NN 1.9.2 and output was filtered in DIA-NN quantification at 0.01 false discovery rate for precursors (peptide level) with no Heuristic protein inference, and Protein Inference set to Genes in order to distinguish between isoforms. Trypsin was set as a digestion enzyme allowing up to 1 mis-cleavages, the Iodoacetamide was set as global cysteine Alkylation modification, scan window was set to 10, MBR was enabled, Mass Accuracy was set to 25 ppm, MS 1 Accuracy to 15 ppm, charge 2–5, and fragment range 140–1800.
Of particular interest in this dataset were the relative proportions of alpha and beta heavy chain myosin isoforms in the tissue samples. Alpha myosin is the dominant isoform in human atrial tissue [17], but has been found at reduced proportions in certain disease states. For each patient sample, the unique abundances of MYH6 (alpha) and MYH7 (beta) were identified and the amount of alpha myosin was expressed relative to the total amount of both isoforms. This fraction of alpha myosin was compared between the non-diabetic and diabetic patient groups by unpaired two-tailed t-test.
Comments (0)