
Remember me
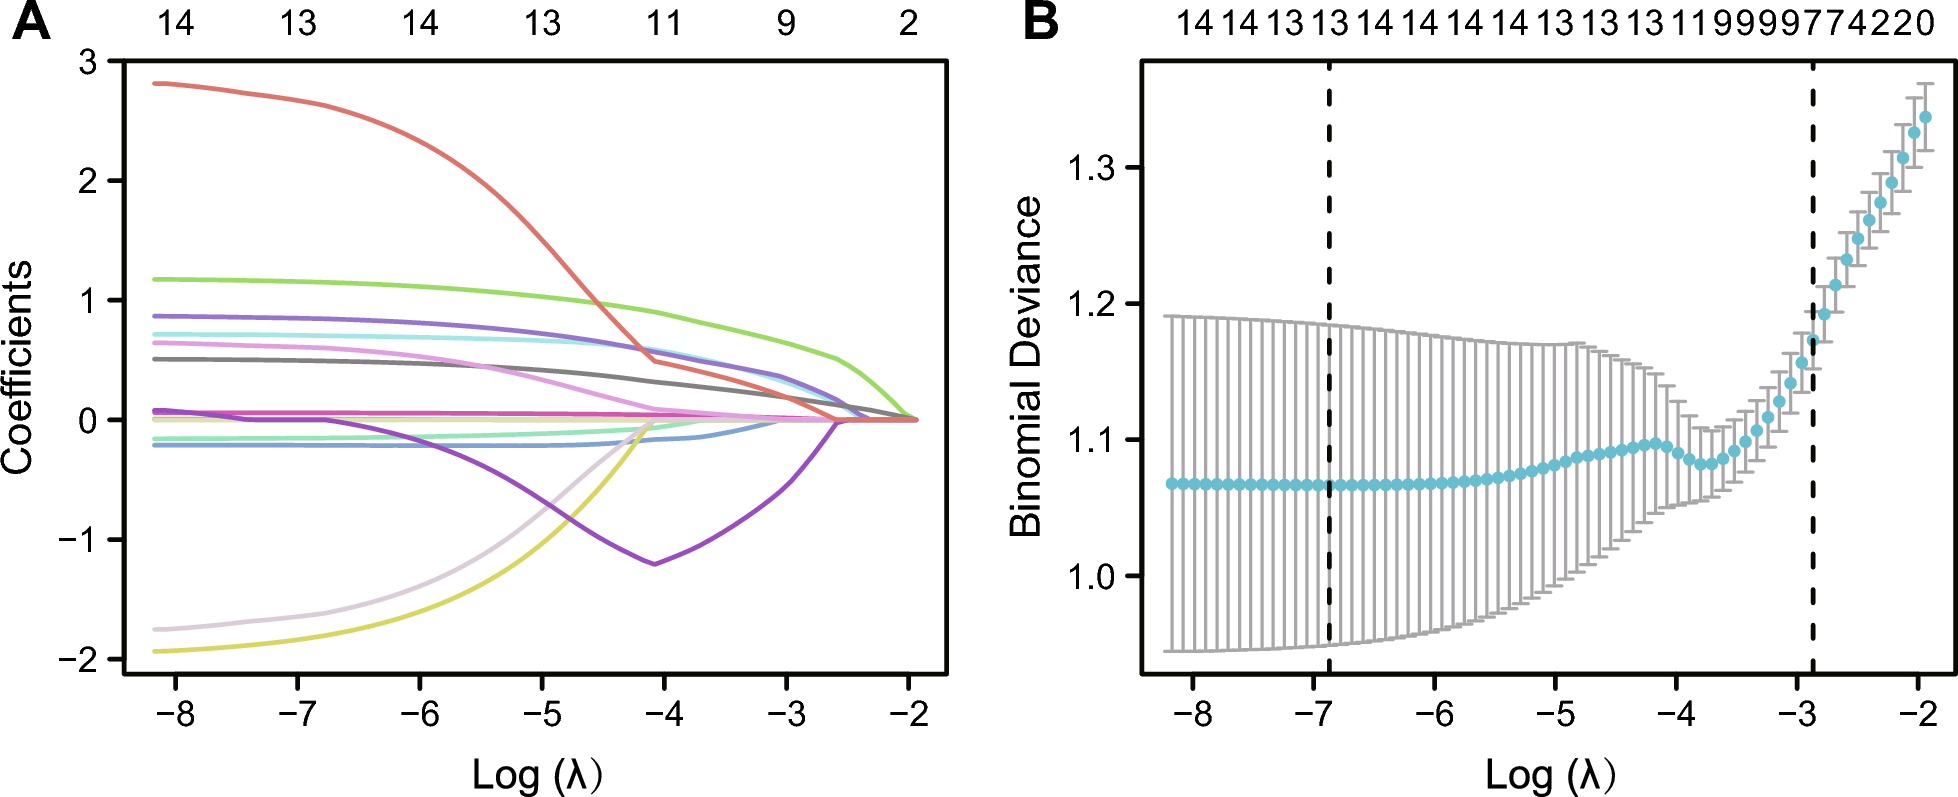


Through the application of the Lasso regression analysis, which is renowned for its ability to perform variable selection and regularization, we have effectively refined our baseline dataset. In our study, based on Lasso regression analysis, we successfully screened out seven confounding factors (sex, BMI, platelets, lymphocytes, monocytes, total cholesterol, and triglycerides) unrelated to CHD from a baseline dataset comprising 14 clinical features (Fig. 1). Lasso regression enabled us to eliminate the interference of confounding factors through the PSM method and select clinical features highly associated with CHD to streamline the analysis, thereby enhancing the robustness and interpretability of the results.
Fig. 1
LASSO regression screening results. A Co-variation of the 14 variables when the regularisation parameter λ is varied. B The regularisation parameter λ screening process
Clinical and biochemical characteristics in NAFLD and NAFLD-CHD groupsThrough the Lasso algorithm, seven clinical features unrelated to CHD were identified and subsequently neutralized for their impact on outcomes using the PSM method. PSM is a statistical technique that balances covariates between treatment and control groups, effectively reducing bias and confounding variables in observational studies. After applying the PSM (1:1) method, this study included a total of 282 participants, consisting of 141 NAFLD patients and 141 NAFLD patients with CHD, with average ages of 54.52 and 58.89 years, respectively. Compared to patients without CHD, those with CHD had a higher proportion of smokers, hypertension and diabetes (Table 1). In contrast, sex, BMI, platelet count, lymphocyte count, monocyte count, total cholesterol, and triglycerides were balanced between the groups, with no significant differences observed (P > 0.05).
Table 1 Baseline characteristics of patients with NAFLD (control) and with NAFLD and CHDUnivariate and multivariate analyses of factors associated with CHD in NAFLDThe univariate logistic regression analysis showed that neutrophil(N)(OR, 1.407; 95% CI, 1.194—1.657; P < 0.001), Low-Density Lipoprotein Cholesterol (LDL-C)(OR, 1.754; 95% CI, 1.225—2.513; P = 0.002), Systemic Immune-Inflammation Index (SII)(OR, 1.002; 95% CI, 1.001—1.002; P < 0.001), Systemic Inflammation Response Index (SIRI)(OR, 1.532; 95% CI, 1.115—2.107; P = 0.009), Neutrophil-to-Lymphocyte Ratio (NLR)(OR, 1.401; 95% CI, 1.144—1.717; P = 0.001), Platelet-to-Neutrophil Ratio (PNR)(OR, 0.984; 95% CI, 0.975—0.994; P < 0.001), Neutrophil-to-High-density lipoprotein Cholesterol Ratio (NHR)(OR, 1.301; 95% CI, 1.132—1.496; P < 0.001), and Neutrophil-to-Monocyte Ratio (NMR)(OR, 1.155; 95% CI, 1.079—1.236; P < 0.001) were correlated with the occurrence of CHD in NAFLD patients. The multivariate logistic regression analysis showed that N(OR, 1.420; 95% CI, 1.193—1.690; P < 0.001), LDL-C(OR, 1.948; 95% CI, 1.326—2.861; P < 0.001), SII(OR, 1.002; 95% CI, 1.001—1.003; P = 0.001), SIRI(OR, 1.527; 95% CI, 1.072—2.175; P = 0.019), NLR(OR, 1.418; 95% CI, 1.129—1.781; P = 0.003), NHR(OR, 1.375; 95% CI, 1.021—1.852; P < 0.001) and NMR(OR, 1.161; 95% CI, 1.080—1.248; P < 0.001) were still risk factors for CHD in NAFLD patients. PNR was a protective factor for CHD (Table 2; Fig. 2).
Table 2 Univariate and multivariate analysies of factors associated with NAFLD-CHDFig. 2
Forest plots of independent factors associated with CHD in NAFLD
Using RCS analysis to explore the relationship between immunoinflammatory indexes and CHD in NAFLD populationsWe used RCS to analyze the dose–response relationship between six immunoinflammatory indexes and the risk of CHD (Fig. 3). After adjusting for all covariates in the analytical model, a linear correlation was observed between NHR, NLR, NMR, and PNR with CHD (P for overall < 0.05, P for nonlinear > 0.05). In contrast, SII showed a nonlinear correlation with CHD (P for overall = 0.001, P for nonlinear < 0.05). Moreover, there was a negative correlation between PNR and CHD, with the incidence of CHD decreasing as PNR increased. It is noteworthy that in the NAFLD population, SIRI does not show a significant correlation with the occurrence of CHD (P for overall = 0.155, P for nonlinear = 0.254).
Fig. 3
The association between 6 variables and CHD was shown using restricted cubic splines (RCS)
Association between immunoinflammatory indexes and coronary Gensini scoreSpearman’s correlation analysis between Gensini score and six immunoinflammatory indexes showed that Gensini score was not significantly correlated with NLR (r = 0.169, P = 0.008), SII (r = 0.116, P = 0.072), SIRI (r = 0.176, P = 0.005) and NMR (r = 0.085, P = 0.183). Weak relationships were detected between Gensini score and NHR (r = 0.256, P < 0.001) and PNR (r = -0.200, P = 0.001) (Fig. 4).
Fig. 4
Analysis of the correlation between six immunoinflammatory indexes and the severitly of CHD
Population risk biomarkers predictive of CHD risk using machine learning modelsWe established a disease prediction model based on univariate and multivariate logistic regression analysis to identify risk factors for CHD in NAFLD. Using Generalized Linear Models (GLM), Support Vector Machines (SVM), and Random Forest (RF) algorithms, we compared residual values with residual plot to determine the most effective predictive model. RF exhibited the smallest residuals, indicating superior predictive capability. Therefore, we proceeded with the RF model for further analysis (Fig. 5A). To explain which risk biomarkers are most important for predicting the diagnosis of CHD, we calculated the Shapley Additive Explanations (SHAP) values. SHAP values provide a transparent and interpretable method for evaluating the importance of individual features in a model. By calculating SHAP values, we can better identify which risk biomarkers contribute the most to predicting the diagnosis of CHD. The top three predictive factors for increased CHD risk include higher NHR levels, older age, and the presence of type 2 diabetes. In addition, higher LDLC levels and lower PNR levels are also important predictive factors for the occurrence of CHD. The levels of NMR, SII, and SIRI have a weak impact on the occurrence of CHD(Fig. 5 B,C). Moreover, male gender, smoking, hypertension, and higher triglyceride levels are risk factors for the occurrence of CHD, while higher HDLC levels serve as a protective factor against CHD. We extracted and visualized individual CHD risk profiles, using waterfall plots to show the positive and negative impacts of personal CHD risk biomarkers on the prediction results (Fig. 5D). In conclusion, for patients suffered CHD and NAFLD, the predicted risk was primarily influenced by nine factors: diabetes, age, hypertension, smoking, TG, NLR, NHR, LDL-C, and HDL-C. Furthermore, to evaluate the predictive performance of NHR in patients with different myocardial injury statuses, we conducted stratified subgroup analyses based on cardiac biomarkers (Creatine Kinase-Myocardial Band, Myoglobin and Cardiac Troponin T) in the NAFLD population (Supplementary 1). The results demonstrated that NHR consistently exhibited significant predictive value for CHD in biomarker-negative subgroups, including CKMB-negative (OR = 2.22, 95% CI: 1.36–3.62), Mb-negative (OR = 2.32, 95% CI: 1.40–3.83), and cTnT-negative (OR = 1.93, 95% CI: 1.00–3.73) patients (all P < 0.05), indicating that in the NAFLD population, even when myocardial injury markers are not elevated, NHR can serve as a predictive biomarker for the occurrence of CHD.
Fig. 5
Machine Learning Screening Variables. A Residual plots assist in evaluating and comparing the fitting effectiveness of different machine learning models. B Summary Plot visually ranks features by their average impact on model predictions using SHAP values. C Beeswarm plot of SHAP values for different variables in the CHD group. D The Waterfall plot displays the SHAP value contribution of each feature to an individual prediction outcome
Construction of a diagnostic nomogram to predict CHD in the NAFLDWe employed machine learning algorithms to identify nine biomarkers associated with CHD. Building upon this, we aimed to construct a nomogram model using these biomarkers to predict CHD risk specifically in NAFLD populations (Fig. 6A). Evaluation using PR curves confirmed the model's robust diagnostic accuracy and reliability, with all predictive factors surpassing baseline measures and converging towards optimal performance in the upper-right corner (Fig. 6B). Further validation through Diagnostic Calibration Curve showed minimal deviation from the ideal line, affirming the model's precision and utility in clinical prediction of CHD risk (Fig. 6C). We evaluated the predictive capability of nine biomarkers for CHD risk in NAFLD patients using ROC curves, with discrimination assessed by the Area Under the Curve (AUC). LDL-C (AUC = 0.598), SII (AUC = 0.631), SIRI (AUC = 0.656), NLR (AUC = 0.661), PNR (AUC = 0.675), and NHR (AUC = 0.703,95% CI, 0.652–0.754) exhibited varying accuracies (Fig. 6D). Then, we investigated their combined predictive accuracy, revealing a significant improvement with an AUC of 0.834 when these nine biomarkers were used together (Fig. 6E).
Fig. 6
Establishing a diagnostic nomogram for CHD in patients with NAFLD. A Nomogram for the diagnosis of CHD. B PR curve for diagnosis of CHD. C Calibration curve for prediction accuracy. D ROC curves of nine indexes in the overall population. E The ROC curve of the combination of nine indexes in the overall population
Comments (0)