Participants
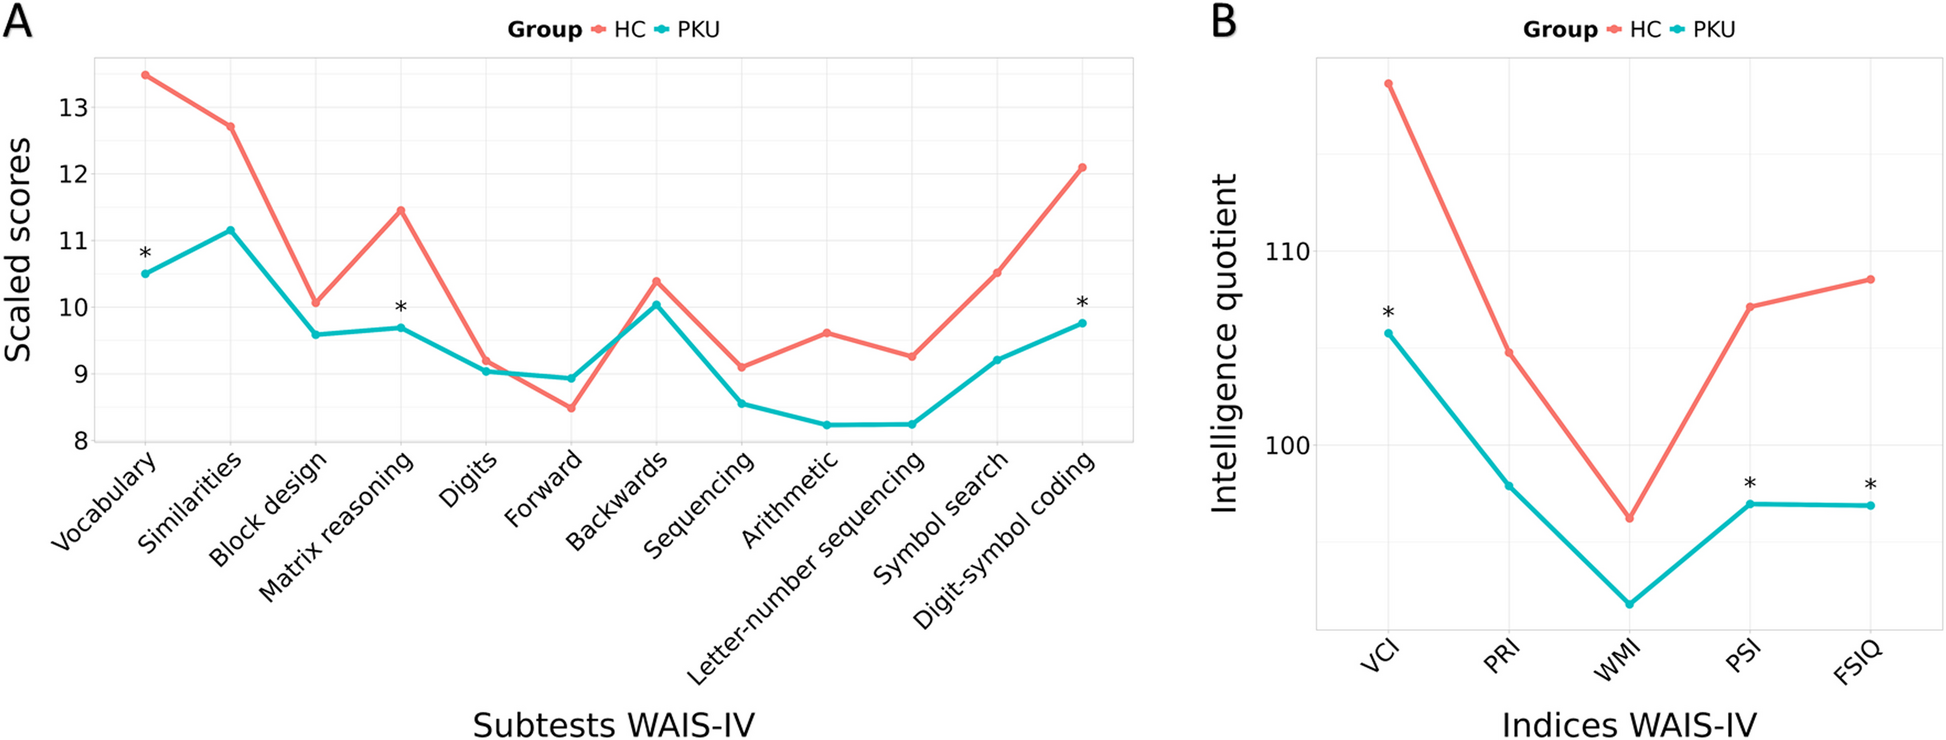
Participants in this study were recruited from the Muscular and Inherited Metabolic Disorders Unit, at the Hospital Clínic, located in Barcelona (Catalonia, Spain). The total sample comprised 60 participants, 29 of whom were patients with early-treated classical PKU whereas the remaining 31 participants were age and sex comparable healthy controls (HC).
The inclusion criteria for PKU patients included: (1) age above 18 years and (2) genetic diagnosis of classical PKU. The inclusion criteria for HC were age above 18 years. The exclusion criteria for patients and HC were: (1) intelligence quotient estimation below 70 according to Wechsler Adult Intelligence Scale – 4th edition (WAIS-IV) tests, (2) pregnancy or planning a pregnancy during the study period, (3) active cancer, (4) severe chronic hepatic disease, (5) acute cardiovascular event occurring within the 6 months prior to study inclusion, (6) common MRI contraindications, (7) claustrophobia, (8) pathological MRI findings other than mild WM hyperintensities in long repetition time sequences, and (9) MRI artefacts.
This study was approved by the Bioethics Committee of the University of Barcelona (IRB00003099) and Hospital Clínic of Barcelona (HCB/2020/0552). It was conducted in accordance with the basic principles of the Declaration of Helsinki, among other relevant regulations and guidelines. Signed written informed consent was provided by all the participants of this study, after a complete explanation of the procedures involved.
Clinical data
Participants’ sociodemographic information, along with clinical data, was obtained during a clinical interview. This information included PKU date of diagnosis, previous and current pharmacological treatment (i.e. sapropterin), use of protein substitutes and supplements, Phe dry blood spot (DBS-Phe) and venous Phe levels, body mass index (BMI), subjective cognitive complaints through clinical assessment, years of education and parents’ years of education, with other medical diagnoses.
The DBS-Phe levels were measured using tandem mass spectrometry (MS/MS) using the NeoBase™ 2 Non-derivatized kit (Revvity, Inc; Waltham, Massachusetts, U.S.). Briefly, to extract the Phe from 3.2 mm of DBS, an organic compound solution that includes the deuterated Phe-d3 (internal standard) was added. Subsequently, 10 µL of this solution was directly injected into the MS/MS (Xevo-TQD; Waters Corp; Milford, Massachusetts, U.S.). The acquisition was performed in positive ionization and Multiple Reaction Monitoring modes using Masslynx software (Waters Corp). The run time was 2.5 minutes. The concentration of Phe was calculated based on the area relative to its internal standard, which had a known concentration, using Neolynx software (Waters Corp). The results were expressed in µmol/L.
Median Phe values obtained from DBS were used to determine the index of dietary control (IDC). This index was approximated using the DBS-Phe levels recorded in the year preceding the study’s inclusion, with approximately 6 to 12 measurements per year for each patient [23, 24].
For additional information on the metabolic control of the patients, historical plasma and DBS-Phe levels throughout their lifetime were collected from medical records. The median of all plasma and DBS-Phe levels recorded each year was calculated for each patient up to the day of the baseline measurement, resulting in an annual median. These annual medians were then averaged according to four age categories (childhood: 0–12 years, adolescence: 13–17 years, adulthood: ≥18 years, and lifetime), excluding age categories with fewer than 10 available measurements per patient [23, 24]. The proportion of Phe values falling within the desired range for the patient [1], categorized accordingly, was also documented. This information is detailed in Supplementary Table 1.
Neuropsychological assessment
Participants from both groups, the HC and PKU groups, underwent a comprehensive neuropsychological assessment. This cognitive evaluation was designed based on domains typically affected in PKU, as identified in prior studies [25]. The assessment comprised several WAIS-IV subtests, including (1) the Vocabulary, (2) Similarities, (3) Arithmetic, (4) Digit Span including Forward, Backwards, and Sequencing tasks, (5) Letter-Number Sequencing, (6) Block Design, (7) Matrix Reasoning, (8) Digit-Symbol Coding, and (9) Symbol Search. Scaled scores based on normative data were obtained. From these subtests, we calculated the verbal comprehension (VCI), perceptual reasoning (PRI), working memory (WMI), and processing speed (PSI) indices (VCI and PRI, prorated) and the prorated full-Scale intelligence quotient (FSIQ) of the WAIS-IV.
MRI acquisition
MRI were acquired with a 3 T scanner (MAGNETOM Prisma, Siemens, Germany), located at the Centre de Diagnòstic per la Imatge de l’Hospital Clínic de Barcelona (Catalonia, Spain). The scanning protocol of this study included two diffusion-weighted images acquired using identical parameters (TR= 3230 ms, TE= 89.20 ms, voxel size= 1.5 mm3, 99 diffusion directions at b= 0, 1500 and 3000 s/mm2, flip angle 78°, 92 slices, FOV= 210 mm; slice thickness 1.5 mm), but reversed phase-encoding direction (anterior-posterior (A-P) and posterior-anterior (P-A)), obtained for each subject. Subsequent preprocessing and analyses were performed at the Neuroimaging Laboratory of the Medical Psychology Unit, Department of Medicine, University of Barcelona, Spain.
Tract-based spatial statistics analyses
The DTI technique was implemented to investigate local diffusion properties of white matter tracts. Specifically, FA was calculated, indicating the principal directionality of water diffusion, while MD provides information about the overall magnitude of water diffusion, both markers of WM tracts’ integrity [26]. DTI data was processed using the FSL (FMRIB Software Library, version 6.0.5) (https://fsl.fmrib.ox.ac.uk/fsl/fslwiki) [27] toolbox, developed by the Oxford Centre for Functional MRI of the Brain (FMRIB).
The preprocessing of DTI images included the application of TOPUP and EDDY correction algorithms to rectify distortions caused by eddy currents and movements, as well as to adjust for field inhomogeneities.
Following the preprocessing, we employed the DTIFIT function within FSL to fit the diffusion tensor model to each voxel. Our analysis utilised a b-value of 1500 s/mm2, with the imaging protocol including 14 non-diffusion-weighted volumes and 94 volumes at b= 1500 s/mm2, in an AP-PA acquisition.
For a group comparison and correlations with DTI metrics, our study utilised TBSS [26, 27]. TBSS performs nonlinear registration (using Nonlinear Image Registration Tool [FMRIB]) of FA images from DTIFIT to the MNI standard space and generates a mean FA skeleton that represents the centre of all WM tracts common to the whole group. Each subject’s FA image was projected onto the skeleton and the resulting FA skeleton images were fed into a general linear model (GLM) modelling the two groups (HC, PKU) to find voxel-wise differences in FA skeleton maps. The same steps were used to obtain and study the MD maps.
The Johns Hopkins University (JHU) ICBM-DTI-81 and the XTRACT HCP Probabilistic Tract atlases, both incorporated in FSLView (v3.2.0), were used to extract the anatomical labels from the FA and the MD maps. The JHU ICBM-DTI-81 atlas includes 50 white matter tract labels manually segmented from diffusion data of 81 subjects from the International Consortium of Brain Mapping. The XTRACT HCP Probabilistic Tract atlas comprises 42 white matter tracts derived from diffusion data of 178 subjects from the Human Connectome Project.
Statistical analyses
Statistical analyses of sociodemographic, clinical, and neuropsychological data were conducted using IBM SPSS Statistics 27.0.1.0 (2020; Armonk, NY: IBM Corp) and R Statistical Software, version 4.3.1 (R Core Team 2023, https://www.r-project.org/). The Shapiro-Wilk test was employed to assess the normality of data distributions, and Levene’s test was used to evaluate the homogeneity of variances. We performed between-group comparisons for continuous variables using Student’s t-tests or Mann-Whitney U tests (for variables that did not meet the assumption of normality), depending on the data distribution. Categorical or dichotomous variables were examined using Pearson’s chi-squared test. Correlation between variables was performed with Spearman’s or Pearson’s tests when required. Results were corrected for false discovery rate (FDR) using MATLAB (v.R2020b). We set the threshold for statistical significance at p≤0.05.
Effect size measures were calculated to quantify the magnitude of differences between groups and the strength of relationships within our dataset.
Neuroimaging statistical analyses consisted of a voxel-wise GLM with non-parametric permutation tests (5000 permutations), besides threshold-free cluster enhancement (TFCE) for statistical inference. Voxel-wise intergroup comparisons, as well as multiple regression analyses between imaging measures, WAIS-IV indices, FSIQ, and metabolic control indicators, were computed. Only clusters >40 voxels were reported. For multiple testing corrections, the family-wise error rate (FWE) correction was applied, with a reporting criterion of FWE-corrected p-value ≤0.05 for all the analyses.
All the analyses were controlled for age, with the age of the participants included as a covariate.


Comments (0)