Patients and animals
The two probands and their respective parents were enrolled in this study at the Sun-Yat sen Memorial Hospital of Sun Yat-sen University. C57BL/6 J mice (SPF grade) were housed and fed at the Medical Research Center Animal Experimental Platform of Sun Yat-sen Memorial Hospital. Male mice aged 4 ~ 5 weeks were used for the experiments.
Genetic detection
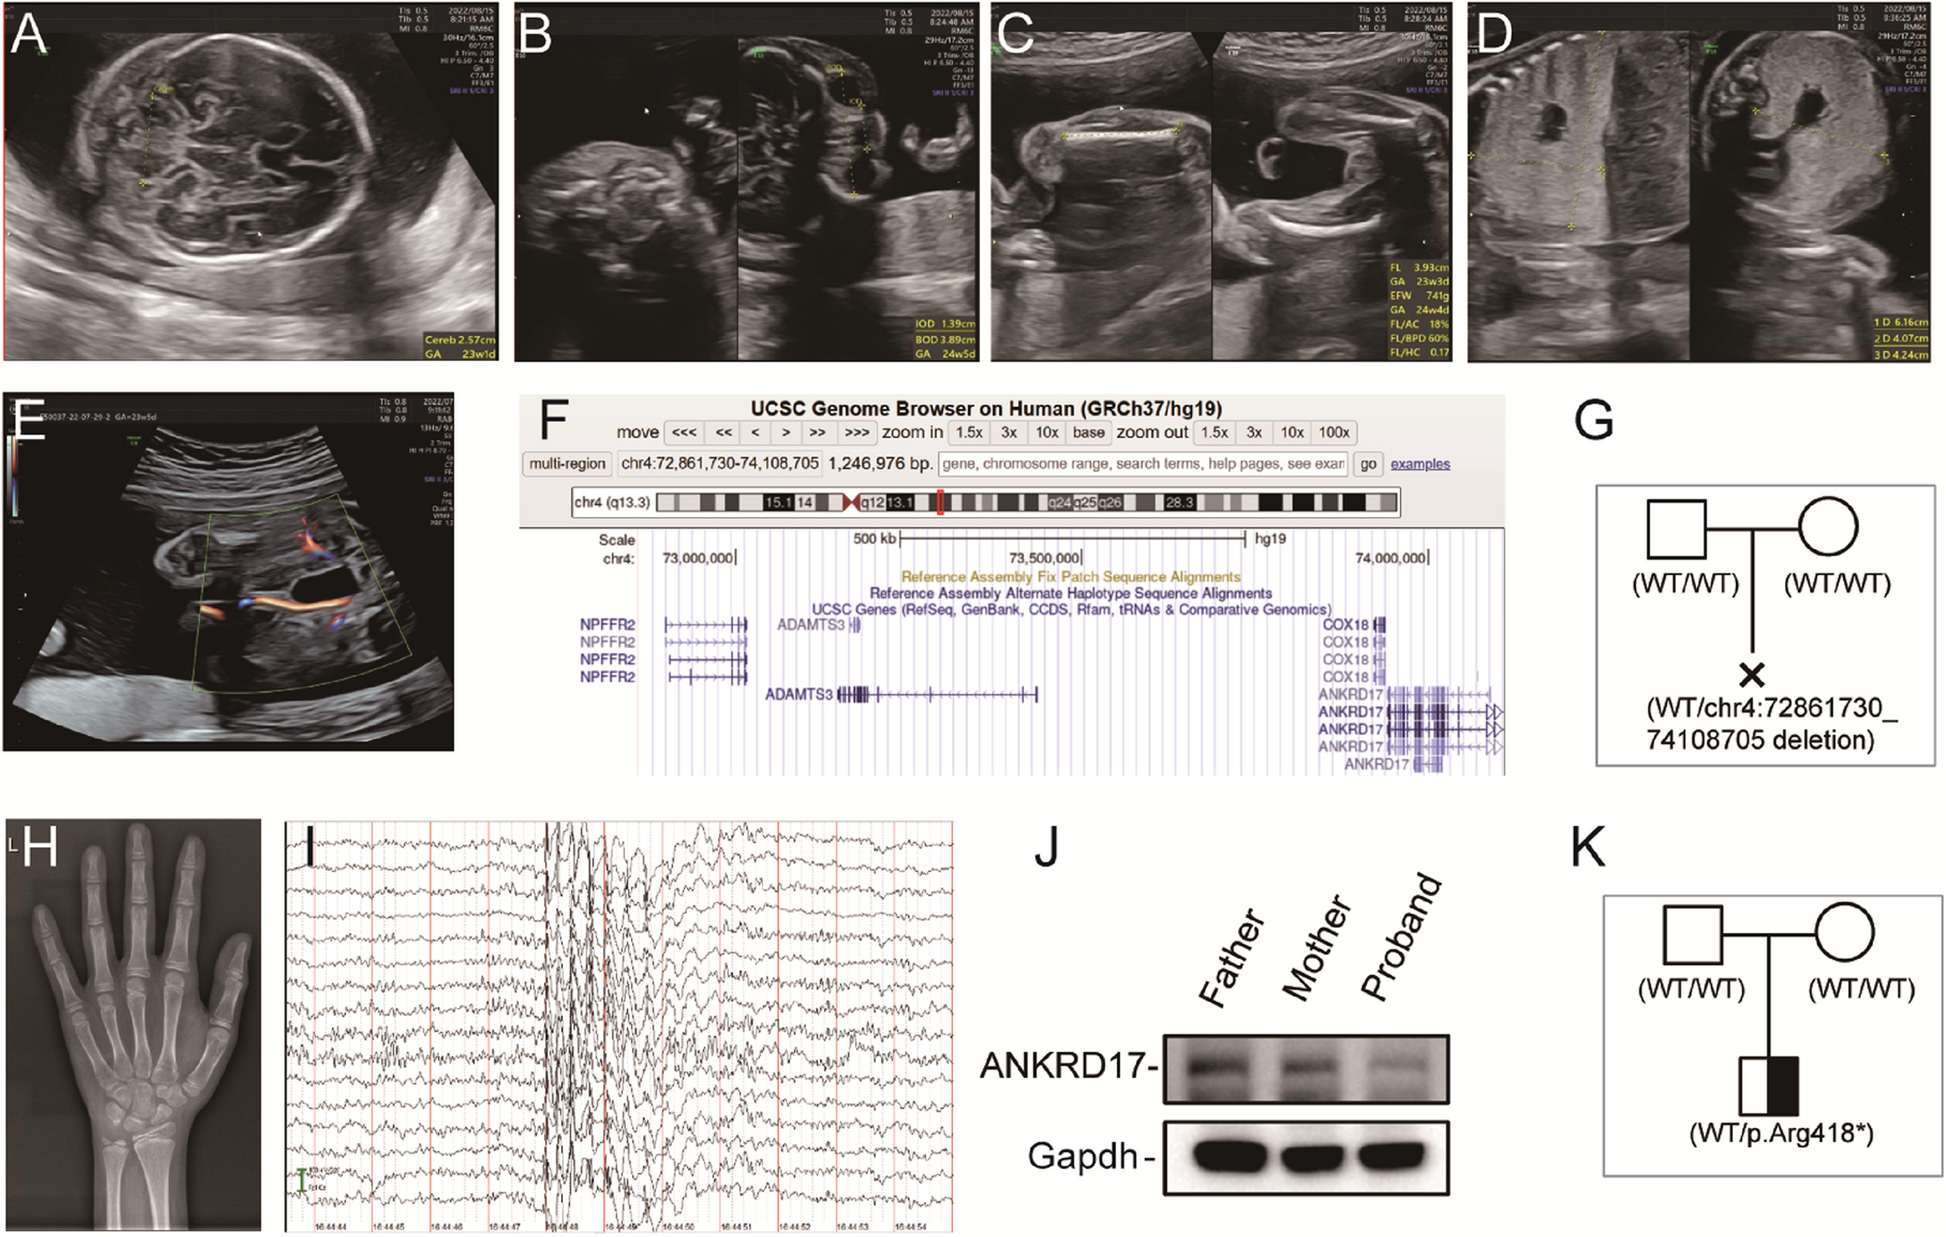
Trio-WES was performed at our Cellular and Molecular Diagnostics Center as previously described [5, 31]. In brief, genomic DNA was isolated from peripheral blood samples preserved in EDTA and obtained from both the probands and their respective parents. The qualified DNAs were further processed using Trio-WES. High-throughput sequencing was conducted on the NovaSeq 6000 platform (Illumina, CA, USA) following DNA library preparation, hybridization capture, enrichment and quality assessment. After filtering and quality control of the raw data, the clean reads were aligned to the University of California Santa Cruz (UCSC) human reference genome (hg19). Several databases were used for variant annotation, including OMIM (http://www.ncbi.nlm.nih.gov/omim/), ClinVar (https://www.ncbi.nlm.nih.gov/clinvar), the Single Nucleotide Polymorphism Database (http://www.ncbi.nlm.nih.gov/SNP/), and gnomAD (http://gnomad-sg.org/). The genetic variations were annotated, analysed, and classified according to the 2015 American College of Medical Genetics (ACMG) guidelines.
AAV-mediated knockdown of ANKRD17 in the mPFC and Hippocampus-CA1 region in mice
The adeno-associated virus (AAV) particles used in this study were purchased from Jikai Co. (Shanghai GeneChem, China). Briefly, a series of three Ankrd17 siRNAs [4] were synthesized, cloned and inserted into the viral vector hSyn promoter-EGFP-MIR155(MCS)-SV40 PolyA (GeneChem, GV680). AAV particles were produced in 293T cells, yielding a final viral concentration of 1.8E + 13 v.g./ml for the recombinant AAV-Ankrd17 (rAAV-Ankrd17). In vivo, the three consecutive Ankrd17 siRNAs are expected to undergo enzymatic cleavage, generating three separate siRNA molecules. This enhances gene silencing effectiveness, as each siRNA molecule can independently interact with the target RNA, guiding its degradation. An unrelated siRNA duplex provided by Jikai Co. (Shanghai GeneChem, China) was used as a negative control.
To induce Ankrd17 knockdown in the medial prefrontal cortex (mPFC) or CA1 region of the hippocampus, mice were deeply anaesthetized with isoflurane (approximately 5% in a gas mixture) and injected with either the knockdown or control rAAV virus. The rAAV injection procedure closely followed our previously published methodology [32]. In brief, a total of 300 nanolitres of rAAV-Ankrd17 virus were bilaterally injected at a rate of 80 nl/min into the mPFC (coordinates: ± 0.35 mm, ML; + 1.8 mm, AP; − 2.4 mm, DV) or the CA1 region (coordinates: −1.9 mm, AP; ± 1.5 mm, ML; − 1.1 mm, DV). Behavioral experiments were conducted three weeks after this surgical procedure.
Three-chamber social test
Prior to behavioural testing, mice were habituated through gently handling daily for 3–7 days. The standard three-chambered apparatus was used following established methodology [10]. Mice were first acclimated to the apparatus, which included empty cages in both side chambers, for 10 min with free access to all three chambers.
In the sociability stage, a test mouse was placed in the center chamber with doors to the side chambers blocked. One side chamber contained another mouse ("Stranger 1"). After unblocking the doors, the test mouse was allowed to explore the apparatus for 10 min. After a 2-h interval, the social novelty test was conducted. The test mouse was returned to the center chamber, with doors blocked, while a novel mouse ("Stranger 2") was placed in the opposite side chamber. The doors were then unblocked, allowing the test mouse to explore for 3 min.
To eliminate odor cues, the apparatus was cleaned with 75% ethanol between sessions. Video recordings were analyzed for time spent in each chamber, interaction time with each mouse or empty cage (nose proximity ≤ 3 cm), and locomotion patterns using the Smart v3.0 Small Animal Behavioral Recording and Analysis System (Reward Corporation).
Open-field test
The open-field test was performed in a chamber with dimensions of 50 × 50 × 40 cm (ZH-ZFT, Anhui Zhenghua Biological Instrument Equipment Co., Ltd., Anhui, China). Prior to testing, mice were acclimated to the testing room through handling and familiarization. On the test day, each mouse was individually placed in the center of the chamber and allowed to explore freely for 15 min. Video recordings captured entries into and time spent within the central square and the peripheral areas, as well as the total distance travelled. These data were subsequently quantified in a blinded manner, without knowledge of the experimental groups.
Y maze
The Y-maze test was conducted in a Y-shaped maze with three arms (A, B, C; 8 × 30 × 15 cm, width × length × height), arranged at 120-degree angles. To maintain cleanliness and eliminate olfactory cues between trials, both the open field and the interior of the Y-maze were thoroughly cleaned with 75% ethanol. The experiment consisted of an exploration period and a testing period. During the exploration period, Arm A was closed. Each mouse was placed at the end of one of the open arms (Arm B), facing the center, and allowed to explore the maze (Arms B and C) for 3 min. After a 2-h interval, all arms of the Y maze were opened, and the mice were placed at the same starting position. During this testing period, the mice were allowed to explore the entire maze for 3 min. For both periods, the number of entries into each arm (A, B, C), the time spent in each arm, and the distance travelled within each arm were recorded for each mouse.
qPCR
Total RNA was extracted from the mPFC or CA1 region using TRIzol (Thermo Fisher, 15,596,026). RNA concentrations were determined using a NanoDrop ND-2000 (Thermo, United States). To synthesize cDNA, total RNA was reverse transcribed using PrimeScript RT Master Mix (Takara, RR036A) following the manufacturer's instructions. Quantitative Real-time polymerase chain reaction (qPCR) was performed using TB Green™ Premix Ex TaqTM II (Takara, RR820A) on a Roche Real-Time PCR Detection System (LC480). Data were analysed using the 2−ΔΔCt method and normalized to β-actin mRNA levels, which served as an internal control.
The primer sequences are detailed in Table S1, and the Ankrd17 primers were sourced from previously published literature [15].
Western blot
The animals were deeply anaesthetized and transcardially perfused with prechilled PBS. Brains were quickly dissected on ice, sliced into 300 μm slices using a Leica Vibratome (VT1200S; Leica, Baden-Baden, Germany) and the target mPFC or CA1 tissues were collected. Tissues were placed in ice-cold RIPA lysis buffer (Sigma, R0278) with a protease inhibitor mixture complete tablet (Sigma, P8340), mechanically homogenized with a pestle, and lysed for 30 min on ice. Lysates were centrifuged at 14,000 rpm for 30 min at 4 °C, and the supernatant was transferred to a fresh tube on ice. Protein concentrations were determined using a BCA assay (Pierce) according to the manufacturer’s protocol. Protein levels were normalized with RIPA lysis buffer, and 5 × sample buffer was added. The lysates were boiled at 95 °C for 10 min for SDS‒PAGE.
Proteins were separated using a premade 4–20% gel (ACE, ET15420) and transferred to 0.22 μm or 0.45 μm PVDF membranes. Membranes were blocked for 2 h in 5% milk prepared in Tris-buffered saline supplemented with 0.05% Tween (TBST). After blocking, membranes were probed overnight at 4 °C with the appropriate primary antibody in TBST. Membranes were washed 3 times in TBST and incubated for 1 h with HRP-conjugated secondary antibody: goat anti-mouse IgG (1:5,000; Cell Signaling Technology, 7076), goat anti-rabbit IgG (1:5,000; Abcam, ab6721)]. After secondary incubation, membranes were washed three times with TBST. Blots were visualized using a chemiluminescence detection system.
Primary antibodies used in this study included: anti-PSD95 (1:1000; Abcam, ab238135), anti-synapsin I (1:1000; Abcam, ab254349), anti-NMDAR2A (1:1000; Abcam, ab133265), Anti-Glutamate Receptor 1(1:1000; Abcam, ab183797,), anti-ANKRD17 (1:1000; Abcam, ab85726; 1:1500; Proteintech, 27701–1-AP), and anti-alpha tubulin (1:1000; Abcam, ab176560).
Immunofluorescence
Mouse brain tissue was processed as described in our previous publication [32]. Briefly, upon removal, whole brains were fixed overnight in 4% paraformaldehyde at 4 °C, followed by cryoprotection in 30% sucrose for 48 h. Subsequently, the brains were OCT-embedded and sectioned at 30 µm using a cryostat (Leica CM1950, Germany). Sections from the mPFC or CA1 region were selected and stained.
For immunofluorescence, the primary antibodies used were: anti-ANKRD17 (1:2000; Bethyl, IHC-00596), anti-NeuN (1:300; Sigma, MAB377), anti-Camk2a (1:250; Santa Cruz, sc-13141; 1:250; Abcam, ab52476), anti-GAD67 (1:50; Abcam, ab213508), anti-PV (1:1000; Abcam, ab11427,), anti-MAP2 (1:500; Abcam, ab5392) and anti-c-fos (1:250; Santa Cruz Biotechnology, sc-166940). The secondary antibodies were: Alexa Fluor® 488 goat anti-rabbit IgG H&L (1:1000; Invitrogen, ab150077), Alexa Fluor™ 488 goat anti-Chicken IgY (H + L), (1:500; Thermo Fisher Scientific, A-11039) or Alexa Fluor® 647 goat anti-mouse secondary antibody (1:1000; Thermo Fisher Scientific, A21235). Cell nuclei were labelled with DAPI.
Three to four location-matched sections from each mouse were selected, with five mice per group, resulting in a total of 15–20 images per group. To minimize batch effects, samples from the control and knockdown groups were stained together.
5D label-free proteomics
Brain tissue was obtained from a 26-week-old fetus with ANKRD17 deficiency (Case 1), with family consent, due to multiple anomalies identified through ultrasound. The control group included brain tissue from a 25-week-old fetus of the same sex, induced with family consent due to isolated chondrodysplasia detected by ultrasound, with negative WES results. Proteins were extracted from paraffin-embedded brain tissue sections per group for subsequent proteomic analysis.
5D proteomics was conducted by Shanghai Jikai Gene Chem in China. For bioinformatics analysis, Blast2GO (version 1.3.3) was used for GO annotation of the target proteins. During the KEGG pathway annotation process, KOALA (KEGG Orthology and Links Annotation, Version 2.3) software was used to align the KEGG GENES database (version: KO_INFO_END) with the target protein sequences. These protein sequences were classified by KO labels, and pathway information was automatically obtained. Enrichment analysis for both GO annotations and KEGG pathway annotations was performed using Fisher's exact test. WoLF PSORT was subsequently used to predict the subcellular localization of the proteins. Differentially expressed proteins were defined as those with|fold change|≥ 2.
Statistical analyses
All data were analysed and visualized using R 4.1.1 and Adobe Illustrator 2023. Ordinary two-way ANOVA followed by Bonferroni's multiple comparisons test and two-tailed unpaired t-test were employed for comparisons. A p-value < 0.05 was considered statistically significance. Data are presented as the mean ± SEM. *, p < 0.05; **, p < 0.01; ***p < 0.001;****, p < 0.0001.


Comments (0)