
Remember me

As shown in Scheme 1, 78c@Lipo-FA was prepared by adding DSPE-PEG2k-FA and 78c proportionally using a thin-film dispersion method. Chs/SerMA hydrogel microspheres were prepared by microfluidics, and the MMP9-responsive peptide DPG was covalently attached to the Chs/SerMA hydrogel microspheres by maleimide and sulfhydryl reactions. Finally, 78c@Lipo-FA, as the secondary structure of microspheres, was prepared to link with DPG@Chs/SerMA hydrogel microspheres to form LFDCS (Scheme 1A).
Scheme 1
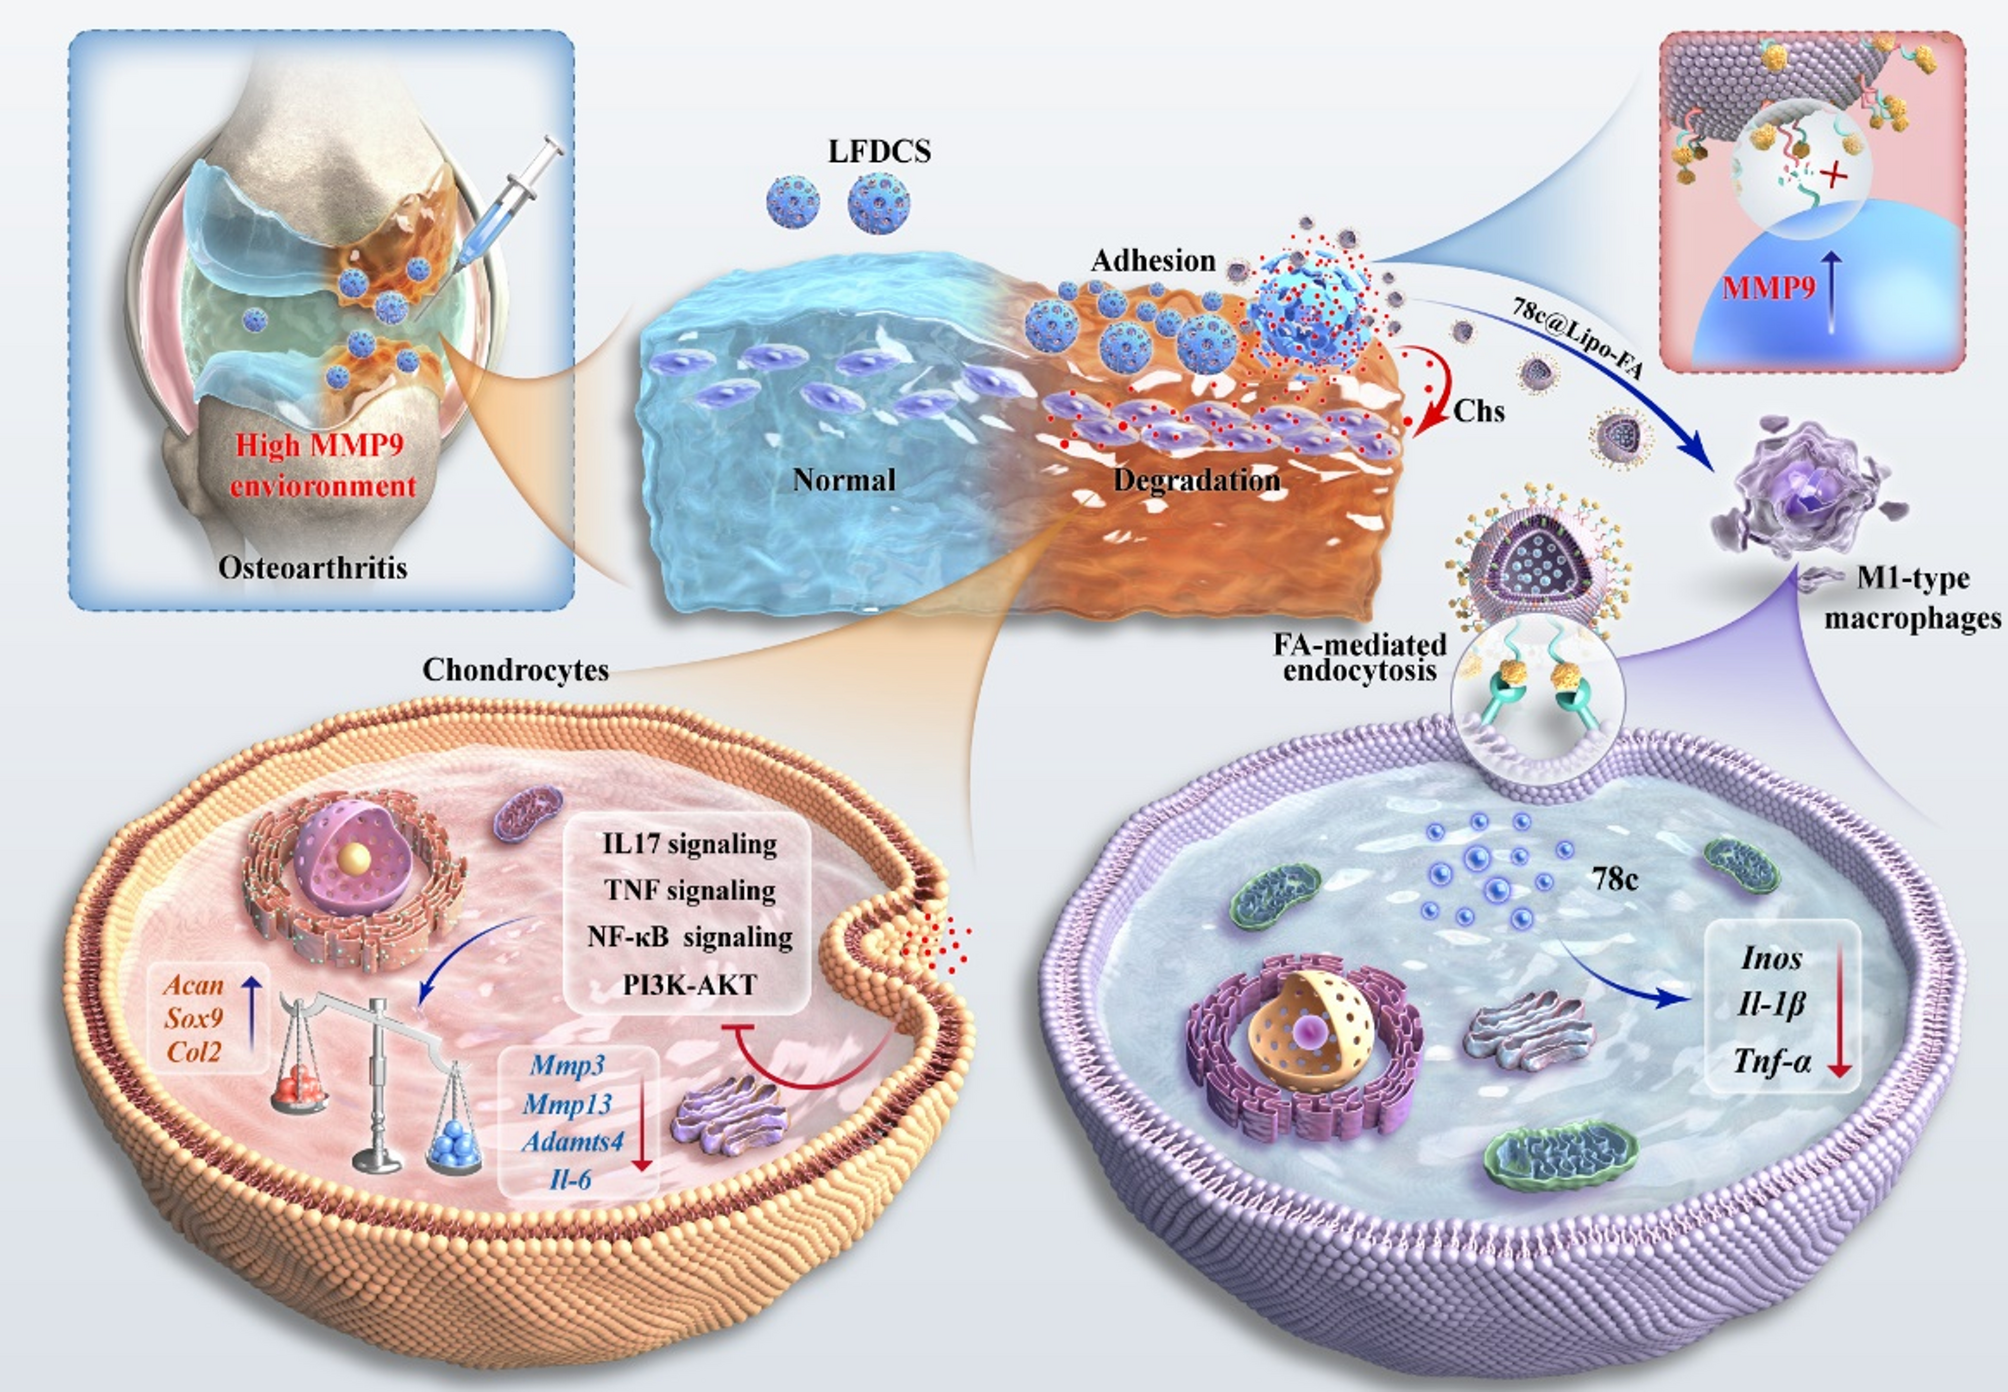
Bionic bearing-inspired lubricating microspheres characterized by immunomodulatory for osteoarthritis treatment. (A) Synthesis of M1-targeted liposomes and highly adhesive lubricating hydrogel microspheres. (B) Application of composite hydrogel microspheres in OA. (C) Mechanism of composite hydrogel microspheres to ameliorate chondrocyte dysfunction through downregulation of inflammatory and PI3K/AKT signaling pathways and inhibit M1-mediated inflammation. Ultraviolet: UV
78c, as a CD38 inhibitor, not only inhibits macrophage function by suppressing CD38 signaling in M1 macrophages, but also exhibits nontoxicity to M2 macrophages, indicating an excellent therapeutic prospect for targeting inflammation in OA [30]. Consistent with previous findings, we found that the M1 macrophage population was significantly lower in LPS + 78c group ( 51.8%) as compared to the LPS group (77.4%) (Figure S1A) [30]. This conclusion was supported by quantitative real-time PCR (qRT-PCR) results for the gene expression of Tnf-α, Il-1β, and Inos (Figure S1B). However, 78c is a fat-soluble compound with low solubility in aqueous solution and is quickly cleared by the synovial fluid, severely reducing the intra-articular drug delivery efficiency [38]. As a drug delivery system, liposomes exhibit the ability to enhance drug loading through the lipophilic properties of phospholipids, thereby promoting the effective uptake of drugs by cells; consequently, they have provided excellent drug delivery in the clinical setting [39].
The folic acid receptor (FAR) family encompasses four members, namely FARα, β, γ, and δ [40]. As a receptor widely expressed upon M1 macrophages, FAR is essentially absent in M0, M2 macrophages, and normal cells [41]. Furthermore, large numbers of FAR-positive macrophages are present in OA [42]. Therefore, we used FA as a ligand to modify liposomes (Lipo-FA) to effectively target M1 macrophages, which did not affect the remaining cells.
In the previous study, liposomes were preparation by thin-film dispersion method. As illustrated in Fig. 1A, liposome films were prepared using a rotary evaporator after mixing the materials in a centrifuge tube. 78c@Lipo-FA was prepared by stirring, ultrasonicating, and extruding the liposome suspension. The TEM results revealed that the liposomes had a uniform spherical appearance (Fig. 1B). The diameters of Lipo, Lipo-FA, and 78c@Lipo-FA were 134.53 ± 11.03 nm, 137.23 ± 2.67 nm, and 154 ± 5.97 nm, respectively (Fig. 1C), and exhibited well dispersion (Figure S1C). The zeta potentials of Lipo, Lipo-FA, and 78c@Lipo-FA were -21.3 ± 0.49 mV, -46.2 ± 0.95 mV, and -31.2 ± 0.79 mV, respectively (Fig. 1D, Figure S1D). Interestingly, we found that after FA modification, the zeta potential of the liposomes increased approximately 2-fold, which may be due to the anchoring of the negatively charged functional groups present in the DSPE-PEG2k-FA band to the liposomes [43]. Furthermore, the Lipo-FA encapsulation of 78c was approximately 74% (Figure S2).
To test the targeting of Lipo-FA, flow cytometry assay was employed to assess the uptake of liposomes by BMMs. The results revealed that, compared to Lipo alone, Lipo-FA and 78c@Lipo-FA were taken more by M1 macrophages and the loading of 78c had no significant effect on the targeting of liposomes (Fig. 1E), suggesting that the modification of FA increase the uptake of liposomes. Observed by a fluorescence microscope, as depicted in Fig. 1F and G, M1 macrophages displayed a higher uptake of Lipo-FA and 78c@Lipo-FA than the Lipo group, and the fluorescence intensities of Lipo-FA and 78c@Lipo-FA were 1.5 times and 1.4 times higher than those of the Lipo group, further confirming the targeting of Lipo-FA. In sum, we designed FA-modified liposomes capable of tracking and delivering drugs to M1 macrophages, thus enhancing the liposome delivery efficiency [44].
Fig. 1
Characterization of 78c@Lipo-FA. (A) Scheme diagram of the preparation process of Lipo-FA; materials including 78c, HPSC, cholesterol, octadecylamine, and DSPE-PEG2k-FA. (B) TEM of liposomes. (C) Particle size of liposomes (n = 3). (D) Zeta potential of liposomes (n = 3). (E) Representative panels of the uptaking-liposomes in the BMMs assayed by flow cytometry. (F) Representative images of the uptaking-liposomes in the BMMs observed by the fluorescence microscope (After BMMs were incubated for 4 h). (G) Relative fluorescence intensity of the uptake of liposomes by BMMs (n = 3). ***p < 0.001
Characterization and lubrication properties of LFDCSSerMA hydrogel exhibits different characteristics at different concentrations [45, 46]. To determine the suitable concentration of SerMA to prepare the microspheres, we examined the G’ and G’’ concentrations of the SerMA solutions during the curing process with a rheometer. As shown in Figure S3, we found that different concentrations of solutions fused well after photo-crosslinking, and 25% w/v SerMA had higher viscosity than the other groups. Therefore, 25% w/v SerMA was selected for subsequent experiments.
Chs/SerMA hydrogel microspheres were fabricated with a microfluidic device, and the amino groups on the Chs/SerMA hydrogel microspheres were activated by Suflo-SMCC. Subsequently, DPG was covalently attached to the activated Chs/SerMA hydrogel microspheres. After purification by dialysis, 78c@Lipo-FA was bound to DPG@Chs/SerMA hydrogel microspheres via DSPE segments embedded in the hydrophobic region of liposomes (Fig. 2A). SerMA was selected as the carrier because of the traits: firstly, sericin contains various reactive groups sensitive to chemical modifications; secondly, sericin possesses high adhesion properties [10, 12, 47]. After demonstrating the excellent physical adhesion properties of 25% w/v SerMA, the microstructure of the microspheres was studied. Fig. 2B showed that the SerMA hydrogel microspheres displayed excellent spherical shape and homogeneity. Scanning electron microscopy (SEM) revealed that SerMA hydrogel microspheres had a porous structure with a diameter of about 100 μm (Fig. 2C).
Currently, microsphere preparation materials such as Chs methacrylate, HA methacrylate, and GelMA, which are commonly employed in the treatment of OA, require chemical modifications to enhance their adhesion properties for cartilage tissue engineering because of their inherently weak adhesion ability [3, 4]. To investigate the impact of SerMA hydrogel microspheres on cartilage adhesion, GelMA hydrogel microspheres were applied as the control group [48]. The results indicated that the microspheres of 25% w/v SerMA hydrogel microspheres exhibited superior adhesion to cartilage and defect sites compared to the microspheres of 7.5% w/v GelMA hydrogel microspheres (Fig. 2D, Supplementary Video 1). Thus, SerMA-based microspheres could effectively adhere to the cartilage surface without additional modification.
FTIR spectroscopy and SEM were performed to confirm the binding of 78c@Lipo-FA to SerMA hydrogel microspheres. The results of FTIR spectroscopy indicated the presence of amide and ether bands at 1,680 cm− 1 and 1,083 cm− 1 in DPG@Chs/SerMA compared to Chs/SerMA and activated Chs/SerMA. (Chs/SerMA-NH) (Fig. 2E). We also observed the surface morphologies of SerMA, LFDS, and LFDCS by SEM. As shown in Fig. 2F and Fig. S4, some dispersed liposome microreservoirs were observed on the surfaces of LFDS and LFDCS, whereas they were absent in Chs/SerMA or SerMA hydrogel microspheres, suggesting that Lipo-FA are attached to the microspheres.
To explore the lubrication properties of the microspheres, SerMA, LFDS, and LFDCS were placed under 10 N and 15 N loads in the universal material testers, respectively. The results showed that the coefficients of friction (COF) of SerMA, LFDS, and LFDCS were reduced compared with PBS, with the COF values of LFDS and LFDCS decreasing by approximately 49% and 48%, respectively (Fig. 2G, Fig. S5). Owing to the high viscosity and rolling characteristics, SerMA hydrogel microspheres can enhance lubrication by acting as ball bearings [49]. In addition, the results in Fig. 2G revealed that the lubricating properties of LFDS and LFDCS were superior to those of SerMA, indicating that the hydrated synovial membrane provided by liposomes could also reduce the damage to the cartilage by mechanical friction and further synergistically reduce the COF of the interface [36].
Systemic or local injection of targeted liposomes often results in unsatisfactory therapeutic effects because of their short half-lives and limited distances of action [50]. Therefore, it is imperative to establish a liposome preservation reservoir that can preserve liposomes and is programmed to control their release [51]. Abnormal inflammatory states and cartilage friction increase the secretion of IL-6, prostaglandin E2, and MMP3, MMP9, and MMP13 within the joints [52]. In this study, LFDCS were designed as a conserved bank of 78c@Lipo-FA. Upon the presence of MMP9, such as in the microenvironment of the OA and trauma, LFDCS could release 78c@Lipo-FA with DPG cleaved by MMP9 for therapeutic purposes.
As shown in Figure S6, the characteristic peaks of DSPE, PEG2k, and GPLGLAGQC were observed in the nuclear magnetic resonance result, indicating successful synthesis of DPG. Next, DiO dyed-liposomes were observed to study the released 78c@Lipo-FA from LFDCS. In vitro, as expected, more liposomes with green fluorescence were found of LFDCS in the MMP9 environment than in control group without MMP9 (Fig. 2H).
Chs is a vital structural component of the cartilage extracellular matrix (ECM) that promotes chondrocyte anabolism and inhibits chondrocyte catabolism to facilitate cartilage repair [53]. In this study, we prepared SerMA hydrogel microspheres mixed with Chs. First, the concentration of Chs in the LFDCS release solution was determined with HPLC. The results demonstrated that Chs had an initial burst release within 24 h, followed by a gradual plateau, reaching a plateau at 7 d, which reflects approximately 80% encapsulation of Chs (Fig. 2I, Fig. S2). The in vitro degradation profile revealed that LFDCS showed continued biodegradability (Figure S7).
In summary, LFDCS adheres to cartilage and provides lubrication to joints, while also responds to MMP to release liposomes.
Fig. 2
Characterization of LFDCS. (A) Scheme diagram of the preparation of LFDCS. (B) The morphology of SerMA hydrogel microspheres observed by the light microscope. (C) The representative SEM images of SerMA hydrogel microspheres. (D) The gross observation of GelMA and SerMA hydrogel microspheres adhension to porcine cartilage. (E) FTIR of DPG@Chs/SerMA, Chs/SerMA-NH, and Chs/SerMA. (F) The representative SEM image of SerMA and LFDCS. (G) COF histograms of PBS, SerMA, LFDS, and LFDCS (n = 3). (H) The responsive release of liposomes in LFDCS observed by the fluorescence microscope. (I) Release of Chs in LFDCS (n = 3). *p < 0.05, *** p < 0.001
Biocompatibility of LFDCSTo assess the biocompatibility of the microspheres, rat chondrocytes were successfully isolated evidenced by toluidine blue staining (Figure S8) and cultured in the leachate from each group (SerMA, LFDS, and LFDCS, respectively). Calcein/PI staining and CCK-8 were applied to determine the toxicity of the microspheres to chondrocytes at day 1, 2, and 3, respectively (Fig. 3A). Calcein/PI staining and quantification results demonstrated that there was no significant difference between the groups at the same timepoints (Fig. 3B, C). The CCK-8 assay displayed that the optical density values of the biomaterial group were comparable to those of the control group (Fig. 3D), further confirming that the biocompatibility of LFDCS was good and suitable for applying in vivo.
Fig. 3
Biocompatibility of LFDCS. (A) Scheme diagram of material biocompatibility. (B, C) Calcein/PI staining and quantitative analysis of chondrocytes on day 1, 2 and 3 (n = 3). (D) CCK8 assay of chondrocytes viability on day 1, 2 and 3 (n = 3). ns, no significant difference
LFDCS inhibited macrophage polarization toward M1 phenotypeSynovial macrophages are pivotal in generating pro-inflammatory factors (IL-1β and TNF-α) following joint injury [54]. In the synovium of the knee joints of patients with OA, there is a significant activation of M1-mediated inflammation compared with healthy individuals [55]. Despite the secretion of IL-4 and IL-10 by M2 macrophages, these factors are insufficient to counteract inflammatory infiltration, cartilage degradation, and bone regrowth caused by M1 macrophages [22, 56]. Therefore, modulation of intra-articular M1-mediated inflammation is an important strategy for managing OA. As mentioned previously, the inhibition of macrophage CD38 expression effectively inhibited macrophage polarization toward M1 phenotype (Figure S1A).
To examine the influence of LFDCS on macrophage polarization, 100 ng/mL LPS was applied to induce polarization toward M1 phenotype (Fig. 4A). As shown in the Fig. 4B, the proportion of CD11b+CD86+ (M1 phenotype) BMMs in the LFDS and LFDCS groups decreased by approximately 17.4% and 27.5%, respectively, in comparison to the LPS group, whereas the percentage of CD11b+CD206+ (M2 phenotype) BMMs was below 6% in both groups.
The expression of Inos in the LFDS and LFDCS groups decreased by 0.43 times and 0.46 times, the expression of Il-1β by 0.39 times and 0.49 times, and the expression of Tnf-α by 0.48 times and 0.62 times, respectively, in comparison to the LPS group (Fig. 4C). Additionally, the proportion of M1 macrophages and the expression of related genes in the LFDCS group were higher than that in the LFDS group, which may be attributable to Chs inhibiting inflammation in M1 macrophages by eliminating ROS [53].
Fig. 4
LFDCS inhibited macrophage polarization toward M1 phenotype. (A) Scheme diagram of microspheres intervention on macrophage polarization. (B) The portion of CD11b+CD86+ (M1 phenotype) and CD11b+CD206+ (M2 phenotype) detected by flow cytometry at 24 h (n = 3). (C) The gene expression of M1 polarization-related genes (Inos, Il-1β and Tnf-α) assayed by qRT-PCR at 24 h (n = 3). *p < 0.05, ***p < 0.001, and ns, no significant difference
LFDCS ameliorated IL-1β-induced chondrocyte dysfunctionInflammation-induced hypertrophic deformation of chondrocytes is an important indicator of OA [57]. Therefore, 10 ng/mL IL-1β was used to elicit inflammation-induced chondrocyte deformation in vitro [58]. ACAN, Col2, and SOX9 are critical factors in chondrocyte regeneration and ECM synthesis, whereas MMP3, MMP13, and ADAMTS4 regulate chondrocyte catabolism [59].
Firstly, rat chondrocytes were cultured for 24 h in the leachate from each group, and functional indicators in the chondrocytes were detected by IF staining and qRT-PCR (Fig. 5A). The Fig. 5B demonstrated a gradual increase in ACAN expression and a gradual decrease in MMP13 expression in the chondrocytes in the SerMA, LFDS and LFDCS group, compared with that of the IL-1β group. Quantitative results displayed the expression of ACAN up-regulated 1.06-, 5.84-, and 7.1-fold, while the expression of MMP13 down-regulated by 28%, 59%, and 144%, in the SerMA, LFDS, and LFDCS groups, compared with that in the IL-1β group, respectively (Fig. 5C and D).
In addition, chondrocyte synthesis and catabolism were further assessed by qRT-PCR. In contrast to the results from the IL-1β group, there was a significantly declined gene expression of chondrocyte catabolism-related markers, including Mmp3 (decreased by 14% and 70%, respectively), Mmp13 (decreased by 48% and 74%,, respectively), and Adamts4 (decreased by 52% and 76%, respectively) and a significantly enhanced gene expression of chondrocyte synthesis-related markers including Sox9 (increased 4.27- and 10.36-fold, respectively), Col2 (increased 5- and 10.54-fold, respectively), and Acan (increased 2.05- and 2.44-fold, respectively) in the LFDS and LFDCS groups. Chs is an important structural component in cartilage and plays an important role in maintaining the cartilage-forming phenotype [53]. The above results indicated that the slow release of Chs in LFDCS group significantly alleviated chondrocyte dysfunction compared to LFDS group.
Fig. 5
LFDCS up-regulated ACAN and down-regulated MMP13 expression in chondrocytes. (A) Scheme diagram of LFDCS intervention in IL-1β-induced chondrocytes. (B) The expression of ACAN and MMP13 in the chondrocytes detected by IF. (C, D) Quantification of ACAN and MMP13 expression in the chondrocytes (n = 3). *** p < 0.001
Meanwhile, the inflammatory response was also evaluated. Compared to the IL-1β group, a decrease in the gene expression of Il-6 (decreased by 53% and 73% in the LFDS and LFDCS groups, respectively) was observed by qRT-PCR (Fig. 6A–C). In the initial phases of OA, chondrocytes reactively secrete TNF-α and IL-6 to exacerbate OA progression [60]. Furthermore, ELISA results revealed that the secretion of IL-6 and TNF-α of chondrocyte were dropped in the LFDS and LFDCS groups, compared to that in the IL-1β groups (Fig. 6D). Interestingly, the LFDS group had the ability to promote cartilage function compared to the SerMA group (Fig. 5B). This may be due to the fact that the 78c released from the leachate of the LFDS group directly acted on the chondrocytes to ameliorate chondrocyte function [29, 30].
Fig. 6
LFDCS ameliorated IL-1β-induced chondrocyte dysfunction. (A) The expression of chondrocyte catabolism-related genes (Mmp3, Mmp13 and Adamts4) detected by qRT-PCR. (B) The expression of chondrocyte anabolism-related genes (Sox9, Col2 and Acan) detected by qRT-PCR. (C) The expression of chondrocyte inflammatory gene Il-6 detected by qRT-PCR. (D) IL-6 and TNF-α concentration detected by ELISA. * p < 0.05, ** p < 0.01, *** p < 0.001, and ns, no significant difference
LFDCS attenuated fluid-phase signaling and reduced osteoid formation in the joints of OA ratsIn vitro, we verified that LFDCS promoted cartilage adhesion, attenuated M1 macrophage inflammation, and ameliorated chondrocyte dysfunction; therefore, we applied LFDCS in rats with anterior cruciate ligament transection (ACLT) [61]. One month after surgery, rats were randomly divided and injected with PBS and the microspheres (SerMA, LFDS, and LFDCS, respectively) in the articular space and recorded as the PBS, SerMA, LFDS, and LFDCS groups, while the rats with sham surgery were set as the control group. After 4 weeks of treatment, the rats were scanned with MRI and µCT, and their joints were collected for histological staining (Fig. 7A). The in vivo compatibility test revealed that the injection of microspheres had no significant effect on the internal organs in each group (Fig. S9A).
To explore the retention of LFDCS in the joint cavity, Cy5.5 was loaded onto LFDCS, and the change of fluorescence signal in the joint cavity after surgery was observed by an in vivo imaging system. One month after ACLT, with intra-articular injection of Cy5.5-labled LFDCS, the fluorescence signal in the joint cavity was maintained at a relatively stable level at first, and gradually decreased with the gradual degradation of LFDCS. Till to the 14th day, a fluorescence signal was still visible in the joint cavity, indicating that LFDCS have an excellent slow-release capability in the joint cavity (Fig. S9B).
According to the MRI results, the fluid-phase signals in the joint cavities of the rats in the PBS, SerMA, LFDS, and LFDCS groups gradually decreased compared with that of the control group (Fig. 7B). And the fluid-phase signals of LFDCS were similar to that of the control group, which indicated that the administration of LFDCS greatly reduced joint edema. Narrowing of the joint space on radiographs usually indicates OA with progressive cartilage damage [62]. Lateral knee X-rays revealed that the articular space width in the PBS group decreased 2.13-fold compared with the control group, whereas the articular space width in the SerMA group increased 0.81-fold, the LFDS group increased 1.88-fold, and that in the LFDCS group increased 1.97-fold compared with the PBS group (Fig. 7C and F). According to the anteroposterior view of the knee joint, medial subchondral osteosclerosis was significantly more severe in the PBS group than in the control group. However, it was alleviated by being treated with SerMA, LFDS, and LFDCS, compared with that of the PBS group (Fig. 7D).
Intraarticular osteophyte formation is another pathogenic feature of OA [63]. The results of µCT and 3D reconstruction indicated that the degree of intra-articular osteophyte formation was greater in the PBS group than in the control group. However, the degree of osteophyte formation was alleviated in the SerMA, LFDS and LFDCS groups (Fig. 7E, G). According to the results shown in Fig. 7B-E, the improvement of OA by LFDCS was significantly better than that in the LFDS and SerMA groups, which was consistent with the results in the in vitro experiments. It suggested that LFDCS not only prevent further joint damage by reducing joint friction, but also promotes the repair of already damaged cartilage by slowly releasing Chs.
Fig. 7
LFDCS reduced fluid-phase signaling and osteoid formation in the joints of OA rats. (A) Scheme diagram of LFDCS treatment. (B) Edema in the joint cavity detected by MRI scanning. (C) Articular surfaces detected by X-ray scanning, LAT: lateral. (D) Articular surfaces detected by µCT scanning, AP: anteroposterior. (E) 3D reconstruction of the knee joint by µCT scanning. (F) X-ray quantification of the medial cartilage gap width in rats (n = 5). (G) Quantification of total osteophyte in the rat knee joint (n = 5). *** p < 0.001
LFDCS reduced cartilage damage in OA ratsFor histological analysis of the cartilage, the control group had smooth cartilage surfaces and uniform ECM. The PBS group had severe cartilage defects and abnormal cellular arrangement. In contrast, these impairments were mitigated in the SerMA, LFDS, and LFDCS groups compared with the PBS group (Fig. 8A). Notably, although the degree of cartilage wear was similar in the SerMA and PBS groups, the SerMA group had a more complete cartilage structure and more neatly arranged cells than the PBS group did. Thus, SerMA hydrogel microspheres injection is beneficial for delaying OA progression.
Safranin O staining was performed on rat cartilage sections to differentiate cartilage and bone. More severe cartilage defects and fibrous hyperplasia around the articular surfaces were observed in PBS group than in the control group. Corresponding to the results of radiology and H&E staining, cartilage wear significantly improved in the SerMA, LFDS, and LFDCS group compared with the PBS group (Fig. 8B). Compared to the PBS, SerMA and LFDS groups, the cartilage around the articular surfaces in the LFDCS group was more evenly aligned, with less cartilage wear and less fibroplasia (Fig. 8B). The microstructure of the repaired cartilage was graded by means of a histological score to quantify the degree of cartilage healing. The results demonstrated a gradual increase in cartilage repair scores with treatment in the SerMA, LFDS, and LFDCS groups compared to the PBS group (Fig. 8C). The OARSI scores for the PBS, LFDS, and LFDCS groups were approximately 5.73, 2.73, and 0.8, respectively, confirming that LFDCS can significantly delay OA progression (Fig. 8D).
Fig. 8
LFDCS attenuated cartilage wear in OA rats. (A) H&E staining of articular surface wear in OA rats. (B) Safranin O staining of cartilage surface in OA rats. (C) Heatmap of variables of histological scoring (n = 5). (D) OARSI grades of rat joints (n = 5). *** p < 0.001
LFDCS ameliorated cartilage dysfunction and attenuated synovial inflammation in OA ratsWe further analyzed the expression of ACAN and MMP13 on the cartilage surface by IHC analysis. As shown in Fig. 9A, B, D, E, there was a 1.39-fold increase in the expression of ACAN in the SerMA group, a 5.5-fold in the LFDS group, and a 7.21-fold in the LFDCS group, whereas the expression of MMP13 was reduced by 8% in the SerMA group, 38% in the LFDS group, and 65% in the LFDCS group compared to the PBS group. Intraarticular injection of LFDCS substantially promoted the expression of ACAN and suppressed the expression of MMP13 on the joint surface (Fig. 9A, B). This is consistent with our speculation in the in vitro part of the experiment. 78c in the LFDS group mostly acted on M1 macrophages, and the slow release of Chs in LFDCS further amel
Comments (0)