Materials
DPPC, DSPE-PEG2000, and SPIO (Fe3O4, 2 mg·mL− 1, 10 nm) were purchased from Xi’an RuiXi Biological Technology Co., Ltd. (Xi’an, China). DSPE-PEG2000-CREKA was purchased from Bioworld Technology Co., Ltd. (Shanghai, China). PFP, Calcein-AM, and propidium iodide (PI) were acquired from Sigma-Aldrich (Shanghai, China). cGAMP was purchased from APExBIO Technology (USA). Cell Counting Kit-8 (CCK-8) was purchased from Dojindo (Japan). TGF-β was obtained from Abbkine (Wuhan, China). Anti-CD3+-FITC, anti-CD4+-PerCP, anti-CD8+-APC, anti-CD11c+-FITC, anti-CD80+-APC, and anti-CD86+-PE antibodies were purchased from Thermo Fisher Scientific Inc. (Shanghai, China). ELISA kits for TNF-α, IL-12, and IFN-γ were purchased from Huyu Biological Technology Co., Ltd. (Shanghai, China). ELISA kits for IFN-β and CXCL10 were purchased from Enzyme-linked Biotechnology Co., Ltd. (Shanghai, China). FITC-fibrinogen and Cy5-albumin were obtained from Solarbio Science & Technology Co., Ltd. (Beijing, China). All reagents used in this work were of analytical grade.
Synthesis of SSCOL
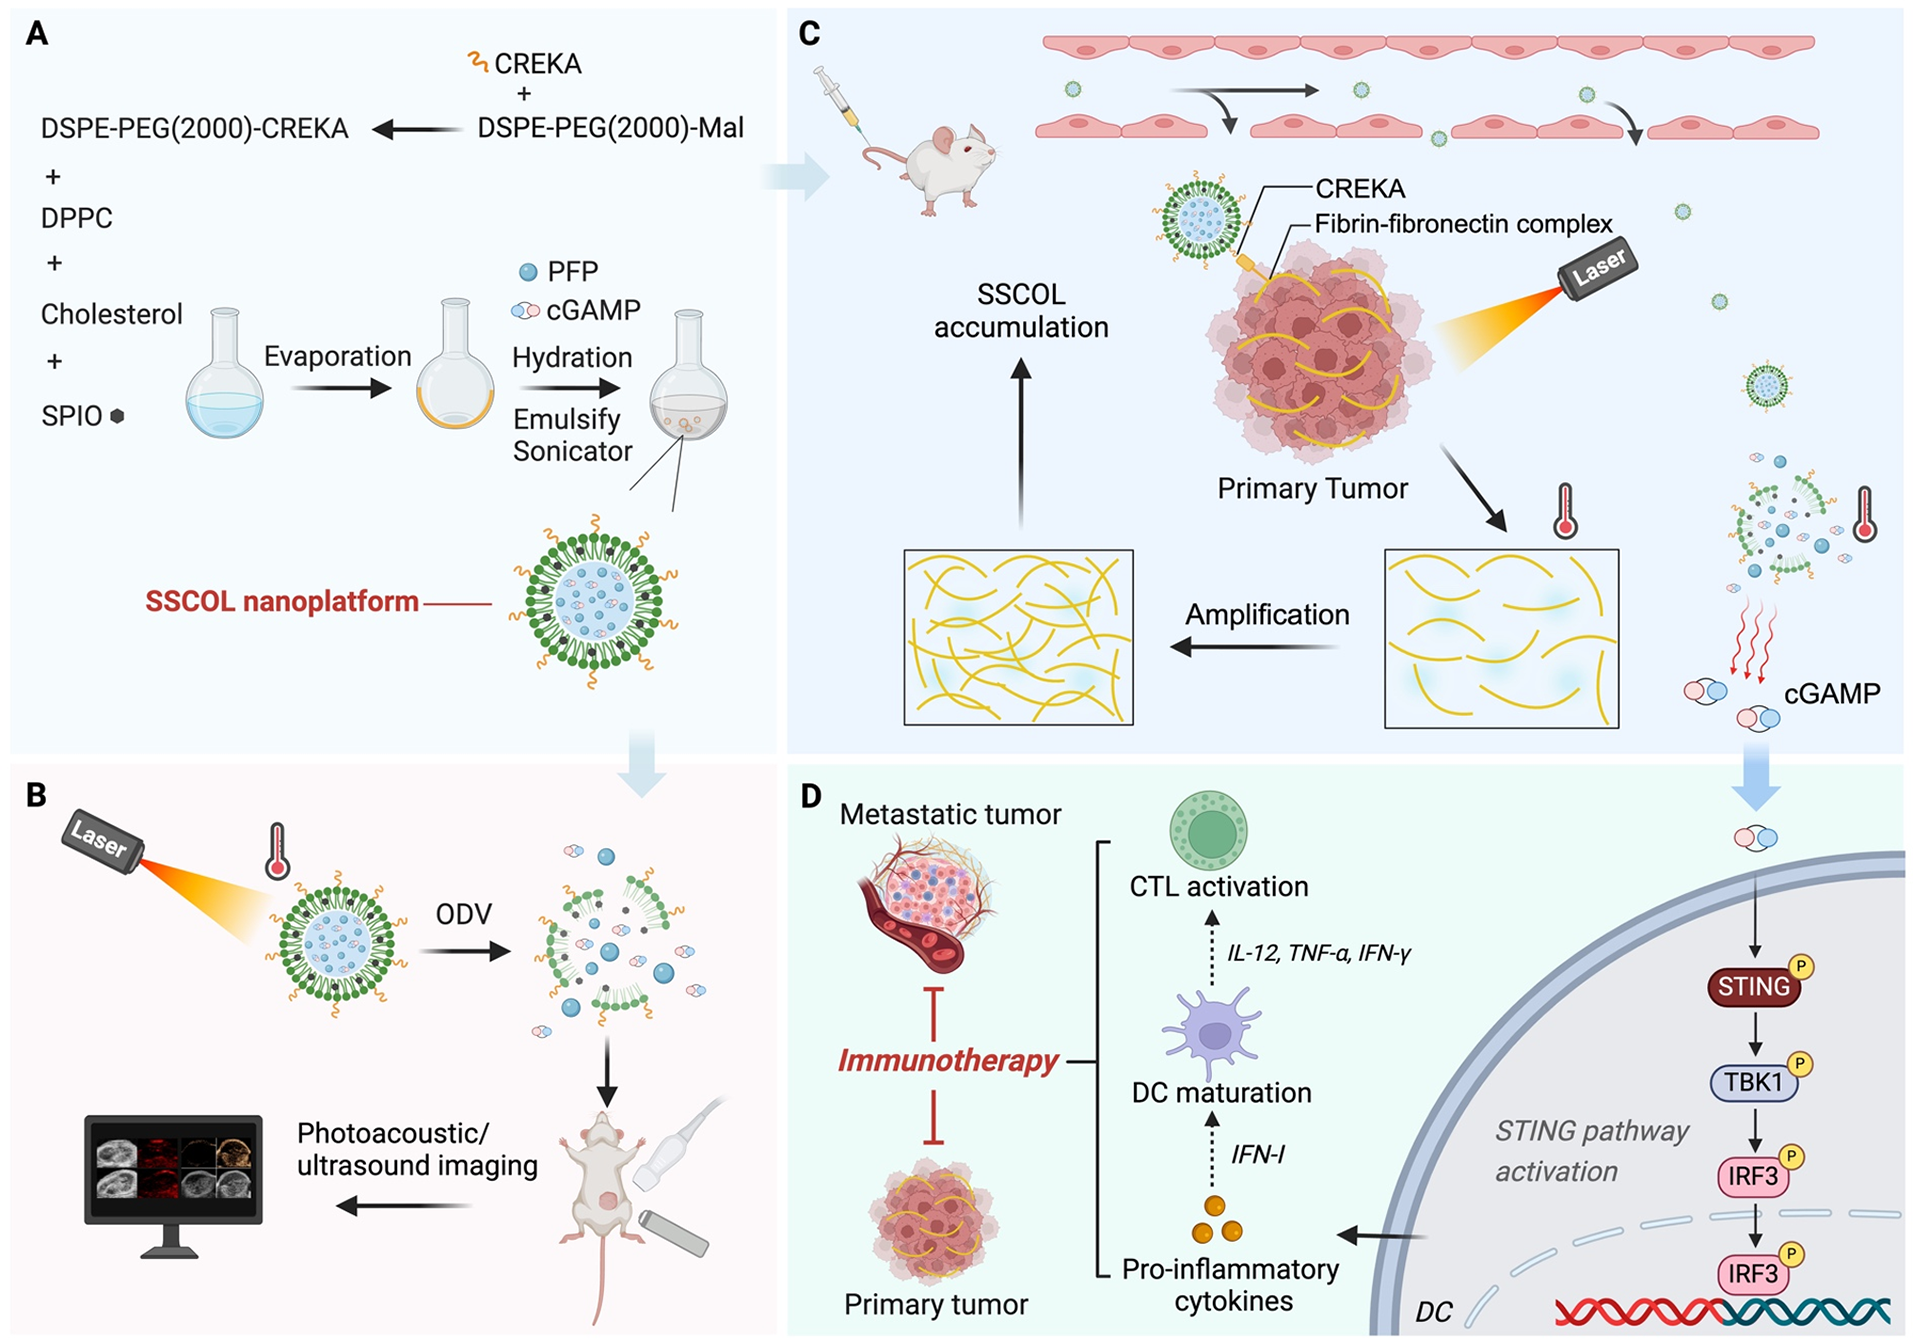
The STING-ODVLipo/SPIO-CREKA nanoparticle (SSCOL) was fabricated by using the thin-film hydration method. Briefly, 6 mg of DPPC, 2 mg of DSPE-PEG2000-CREKA, 2 mg of cholesterol, and 300 µL SPIO were dissolved in 10 mL of trichloromethane. Under a water bath at 45 °C, a thin lipid film was formed by vacuum rotary evaporation. PBS buffer was added to hydrate the film, and the flask was shaken to form a homogeneous suspension. Under an ice bath, 200 µL of PFP and 1 mg of cGAMP were added to the suspension, which was then emulsified using an ultrasonic homogenizer (52 W, 3 min). The mixture was subsequently stirred magnetically at room temperature to ensure complete evaporation of the organic solvent. Finally, the suspension was subjected to low-temperature centrifugation to remove free PFP, SPIO, and cGAMP, yielding the SSCOL. By following the same procedure and substituting DSPE-PEG2000 for DSPE-PEG2000-CREKA, SSOL (without CREKA) was prepared.
Characterization of SSCOL
The microstructure and dispersion of the SSCOL were characterized using an optical microscope and transmission electron microscopy (TEM, Hitachi H-7600, Japan). The particle size distribution, zeta potential, and polymer dispersity index (PDI) were measured using dynamic light scattering (DLS, ZEN3600, Malvern Instruments, UK) with a Malvern particle size analyzer. Continuous monitoring of changes in the distribution, zeta potential, and PDI of SSCOL dispersed in fetal bovine serum (FBS) was performed over a 6-day period. DSPE-PEG2000-CREKA and DSPE-PEG2000 were analyzed using matrix-assisted laser desorption/ionization time-of-flight mass spectrometry (MALDI-TOF-MS). The entrapment efficiency of SPIO was assessed via inductively coupled plasma optical emission spectrometry (ICP-OES, ThermoFisher, USA). The peak areas of cGAMP solutions at various concentrations (10, 20, 30, 40, and 50 µg mL− 1) were measured using high-performance liquid chromatography (HPLC, Shimadzu LC-20AD, Japan). Subsequently, the cGAMP standard curve was constructed, and the entrapment efficiency of cGAMP was evaluated. The loading capacity of the nanoparticles was calculated by the following formulae:
Loading capacity (%) = (mass of SPIO or cGAMP/total mass of nanoparticles) × 100%.
Photothermal conversion of SSCOL
SSCOL solutions at various concentrations were exposed to NIR laser irradiation (2 W·cm− 2, 10 min). Variations in temperature were monitored by infrared thermal imaging during 808 nm NIR laser irradiation at variable power intensities.
Optical droplet vaporization performance of SSCOL
SSCOL solution (50 µg·mL− 1) was dropped onto a glass slide and heated using a heating plate. During the heating process, the liquid-gas phase transition of PFP was monitored in real time under an optical microscope. Subsequently, to investigate the effect of laser irradiation on the optical droplet vaporization (ODV) performance, the SSCOL (2 µg·mL− 1) was added to a 96-well plate and irradiated with an 808 nm laser (2 W·cm⁻²). The number of microbubbles generated at different temperatures was immediately observed under an optical microscope.
Drug-release profile of cGAMP from SSCOL
The 2 mg of SSCOL and 2 mg of SSCL were individually added to sealed dialysis bags and placed in a pre-prepared PBS sustained-release solution (containing 30% v/v anhydrous ethanol, 0.1% v/v Tween-80, and 0.02% w/v sodium azide). The nanoparticles were irradiated with an 808 nm laser (2 W·cm⁻², 5 min). After laser irradiation, the dialysis bags were incubated in a 37 °C shaker (rotation speed 150 rpm). During the drug release process, solution samples were collected from each group at 0, 1, 2, 4, 6, 8, 12, 24, and 48 h, and an equal volume of fresh solution was added to maintain a constant volume. The cGAMP release amounts from the nanoparticles were quantified by HPLC, and the cumulative release percentage of cGAMP was calculated.
In vitro cytotoxicity and biosafety of SSCOL
A standard CCK-8 protocol was used to evaluate the in vitro cytotoxicity of SSCOL. Endothelial cells were seeded in 96-well plates and allowed to adhere until stable. The cells were then co-incubated with varying concentrations of SSCOL (100, 200, 300, 400, 500, and 600 µg·mL− 1). After incubation, the medium was replaced with fresh cell culture medium, and CCK-8 solution was added to each well. Absorbance (OD) was measured at 490 nm using an automatic microplate reader, and the cell survival rate was calculated based on the absorbance values.
For in vivo biocompatibility, healthy female BALB/c mice were intravenously administered SSCOL (2 mg·mL− 1, 200 µL). At different time points (1, 3, 7, 14, 21, 28 d), the mice were euthanized by cervical dislocation. Blood samples were collected for complete blood counts (CBC) and biochemical analysis. Major organs (heart, liver, spleen, lung, kidney) were harvested and fixed in 4% v/v paraformaldehyde. The tissue sections were subjected to hematoxylin − eosin (H&E) staining. Untreated mice were used as blank controls.
Cell culture and animal models
The 4T1 murine breast cancer cell line was originally obtained from JXQ Technology (Chongqing, China) and cultured in RPMI-1640 medium supplemented with 10% v/v FBS and 1% v/v penicillin-streptomycin under standard conditions (5% CO2, 37 °C). Bone marrow-derived dendritic cells (BMDCs) were generated from murine bones according to an established method. In brief, healthy female BALB/c mice (6–8 weeks old) were euthanized via cervical dislocation, and their bilateral femurs and tibias were harvested. The bone marrow cavities were flushed with RPMI-1640 medium, and the flushing solution was collected. Following centrifugation, the supernatant was discarded, and the pellet was resuspended in red blood cell lysis buffer and incubated in the dark to lyse erythrocytes. The lysed cells were washed with culture medium and resuspended to form a cell suspension. GM-CSF and IL-4 were added to the cell suspension at a ratio of 1:10000 to prepare DC-specific culture medium. The BMDCs were seeded into 6-well plates using this medium and cultured at 37 °C with 5% CO2 for 2 days. On day 3, the supernatant was removed and replaced with an equal volume of fresh DC-specific medium. On day 5, half of the supernatant was replaced with an equal volume of fresh DC-specific medium. On day 7, the floating cells were harvested, representing immature BMDCs.
All experimental protocols were approved by the Animal Ethics Committee of the Second Affiliated Hospital of Chongqing Medical University (Coren Trial(265), 2021) and conducted at the Laboratory Animal Center of Chongqing Medical University. Female BALB/c mice (aged 6–8 weeks) were obtained from Enswell Biotechnology Ltd. (Chongqing, China). To establish a 4T1 orthotopic murine breast cancer model, 4T1 cells in the logarithmic growth phase were diluted with sterile PBS (2 × 10⁶ cells per mouse). The cell suspension was then slowly injected into the bilateral mammary fat pads of BALB/c mice to simulate primary and metastatic lesions. Tumor size was monitored every 1–2 days using calipers. When the tumor volume reached approximately 60 mm³, the mice were used for therapeutic studies; when the tumor volume reached approximately 100 mm³, the mice were used for imaging studies. In in vivo studies, mice were anesthetized intraperitoneally with 1% pentobarbital sodium, and were euthanized by cervical dislocation.
Photoacoustic/ultrasound dual-modal imaging
To evaluate the ultrasound imaging performance in vitro, the nanoparticle solutions from each group (2 mg·mL− 1, 200 µL) were added to the wells of a 3% w/v agarose gel and subsequently irradiated with an 808 nm laser (2 W/cm², 10 min). Immediately following irradiation, ultrasound images of each group were acquired using the MyLab90 ultrasound diagnostic system (Esaote, Italy), and the intensity values of the ultrasound echo signals in the regions of interest (ROIs) were quantitatively analyzed. Additionally, ultrasound images were collected at various time points post-irradiation (4, 6, 8, and 10 min) for further analysis. To evaluate the photoacoustic (PA) imaging performance in vitro, SSCOL solutions (2 mg·mL− 1, 200 µL) were added to the wells of a 3% w/v agarose gel. Using the Vevo LAZR PAI device (VisualSonics, Toronto, Canada), PA scans were performed within the excitation wavelength range of 680–970 nm to determine the excitation wavelength corresponding to the maximum PA signal intensity of the nanoparticles. This optimal excitation wavelength (700 nm) was then used for subsequent PA imaging experiments. Under this optimized excitation wavelength, in vitro PA images of the different nanoparticle solutions from each group were acquired, and the PA signal intensities of each group were quantitatively measured.
To evaluate the in vivo photoacoustic/ultrasound dual-modal imaging performance of SSCOL, a unilateral orthotopic cancer model was employed. Following intravenous injection via tail vein of SSCOL into tumor-bearing mice (200 µL per mouse), PA images of the tumor were acquired at various time points before and after injection (2, 4, 6, 24, and 48 h). The PA signal intensity within the tumor region was quantitatively measured for each group to determine the optimal time point corresponding to the best PA imaging effect. This optimal time point was then used as the timing for subsequent targeted PTT. The tumor was irradiated with an 808 nm laser (2 W·cm− 2, 10 min), while simultaneously acquiring ultrasound images. The ultrasound echo signal intensity in the tumor region was quantified.
The expression of fibronectin in the tumor
In vitro, 4T1 cells were routinely cultured in 6-well plates. Once the cells had stably adhered, TGF-β was added for co-incubation. In the control group, 4T1 cells were cultured under identical conditions without TGF-β treatment for the same duration. The mesenchymal phenotype transformation of each group of 4T1 cells was observed using an optical microscope, and the expression levels of fibronectin (Fn) in the two groups of 4T1 breast cancer cell samples were quantified by RT-PCR.
In the in vivo experiments, a unilateral orthotopic tumor was employed. Tumor and major organ tissues (liver, kidney, brain) from tumor-bearing mice were collected. These tissues were homogenized in RIPA lysis buffer containing protease inhibitors at 4℃ and then centrifuged. The supernatants of each sample were collected, and rabbit anti-mouse fibronectin polyclonal antibody was added to the lysates. Western blot analysis was performed to detect the expression levels of fibronectin in both tumor tissues and major organ tissues.
In vitro and in vivo photothermal therapeutic effects of SSCOL
In vitro, 4T1 cells were seeded in 96-well plates and co-incubated with nanoparticles from each experimental group. Following this, the cells were exposed to laser irradiation at an intensity of 2 W·cm− 2 for 5 min. Cell viability was subsequently assessed through the CCK-8 assay. 4T1 cells were routinely cultured in confocal microscopy-compatible dishes. After treatment with each group’s nanoparticles, Calcein-AM and PI dyes were added to the respective samples, and cell apoptosis and necrosis were evaluated using confocal laser scanning microscopy (CLSM). Additionally, 4T1 cells were also seeded in 24-well plates. Post-treatment, the cells were trypsinized with 0.25% trypsin, labeled with Annexin V-FITC and PI, and analyzed for apoptosis via flow cytometry.
In the in vivo experiments, a unilateral orthotopic tumor model was utilized. nanoparticle solutions (200 µL, 2 mg·mL− 1) from each group were administered via tail vein injection. Twenty-four hours after injection, tumors were irradiated with an 808 nm laser at a power density of 2 W cm−² for 10 min for PTT. Surface temperature changes of the tumors during irradiation were monitored using an infrared thermal camera (Fotri226, Shanghai, China). Following PTT, tumor tissues from each group were harvested and subjected to H&E staining.
In vivo biodistribution of SSCOL
To assess tumor accumulation and biodistribution of SSCOL before PPT, DiR fluorescent dye-labeled targeted SSCOL and non-targeted SSOL were prepared. A unilateral orthotopic cancer model was used, with tumor-bearing mice anesthetized via isoflurane inhalation. Fluorescence images of tumor sites were captured using an imaging system at different time points post-injection (2, 4, 6, 24, and 48 h) of nanoparticles (2 mg·mL− 1, 200 µL). Fluorescence intensities at tumor sites were quantified for both groups. At 48 h, tumor tissues and major organs (heart, liver, spleen, lung, kidney) were harvested for fluorescence intensity analysis of nanoparticles in excised tissues.
To evaluate tumor accumulation and biodistribution of SSCOL after PTT, a bilateral carcinoma in situ model was used. Unlabeled SSCOL or SSOL (200 µL, 2 mg·mL− 1) were injected via tail vein into tumor-bearing mice. Based on in vivo PA imaging, the optimal time point for imaging was identified, and one tumor site was irradiated with a laser (2 W cm−², 10 min). Following PTT, 200 µL of DiR-labeled SSCOL or SSOL was re-injected via tail vein. Six hours post-injection, fluorescence images of bilateral tumors were captured, and signals were quantified to compare SSCOL and SSOL accumulation. Additionally, FITC-labeled fibrinogen and Cy5-labeled albumin were injected post-PTT. Tumors were harvested, and fluorescence of FITC-fibrinogen and Cy5-albumin was observed ex vivo.
To further evaluate the targeting efficacy of SSCOL towards the fibrin-fibronectin complex within the tumor stroma, tumor-bearing mice were injected with DiR-labeled SSCOL or SSOL (200 µL, 2 mg·mL− 1) via the tail vein. After 24 h, tumors were harvested and subjected to immunofluorescence staining to detect fibronectin. Fibronectin was identified using an alpha-chain antibody and TYR-570 secondary antibody, and the co-localization of nanoparticles with fibronectin in the tumor microenvironment was analyzed using a laser confocal microscope. Furthermore, under the same PTT conditions as previously described, DiI-labeled SSCOL or SSOL were re-injected via the tail vein. Tumors and major organs (heart, liver, spleen, lung, and kidney) were harvested to examine the distribution of DiI-labeled nanoparticles. This analysis was also performed using a laser confocal microscope to evaluate nanoparticle accumulation in tumors and non-target organs.
In vitro and in vivo activation of the STING pathway
In in vitro experiments, immature BMDCs were isolated from mice and seeded into 6-well plates. The SSCOL or SSOL solutions (1 mL, 600 µg·mL− 1) were added to the corresponding wells for co-incubation with DCs. The expression levels of interferon (IFNb1, IFNa1), tumor necrosis factor (TNF), interleukin (IL1b, IL6, IL12b), and chemokine (CXCL9, CXCL10) in the DCs were quantified using RT-PCR. The phosphorylation levels of TBK1 and IRF-3 in the DCs were assessed by Western blot analysis.
In in vivo experiments, a unilateral orthotopic carcinoma model was utilized. The SSCOL and SSOL solutions (200 µL, 2 mg·mL− 1) from each group were administered to tumor-bearing mice via tail vein injection, and the tumor was subjected to laser irradiation (2 W·cm− 2, 10 min). On the second day after PTT, the blood from the eye sockets of the mice was collected. The expression levels of IFN-β and CXCL10 in the serum were determined using an ELISA kit.
In vitro and in vivo DC maturation and related cytokine secretion
A Transwell system was used to co-culture 4T1 cells and BMDCs. Briefly, 4T1 cells were seeded in the upper chamber until adherent and then incubated with SSCOL, SCOL (without cGAMP), SCOL with free cGAMP and free cGAMP solutions (SSCOL = 600 µg·mL− 1, SCOL = 600 µg·mL− 1, cGAMP = 16 µg·mL− 1), respectively. After 8 h of incubation, the medium was replaced with fresh medium, and the 4T1 cells were irradiated with a laser at 2 W·cm−2 for 5 min. Subsequently, the treated 4T1 cells were transferred to the lower chamber of the plates containing DCs for co-culture. After 24 h, DCs were collected and stained with anti-CD11c FITC, anti-CD80 APC, and anti-CD86 PE antibodies. The proportion of CD11c⁺CD80⁺CD86⁺ DCs was analyzed by flow cytometry. Additionally, the levels of cytokines (IFN-γ, TNF-α, and IL-12) in the DC suspension were quantified using an ELISA kit according to the standard protocol.
In vivo anti-tumor immunity
The 4T1 cells were subcutaneously inoculated into left mammary pads of each BALB/c female mouse as the primary tumor (1st tumor). An equivalent volume of 4T1 cells was injected into the right mammary pad as a distant tumor (2nd tumor) on the 7th days after inoculation of the primary tumor. The mice were randomly divided into six groups: control, SCOL (without cGAMP), free cGAMP, SCOL + Laser, SCOL + free cGAMP + Laser, and SSCOL + Laser (SSCOL = 600 µg·mL− 1, SCOL = 600 µg·mL− 1, cGAMP = 16 µg·mL− 1). Once the tumor volume reached approximately 50 mm³, mice in each group received injections of different solutions. Laser treatment groups underwent laser irradiation (2 W·cm− 2, 10 min) on the primary tumor at 24 h post-injection. In each group, the same treatment for the primary tumors was repeated on the 3rd and 6th days following the initial therapy.
The maturation status of DCs and the activation status of CTLs were determined by flow cytometry. On day 7 post-treatment, tumor tissues, inguinal draining lymph nodes, and spleens were harvested from each group and processed into single-cell suspensions. The suspensions were then stained with anti-CD11c FITC, anti-CD80 APC, and anti-CD86 PE antibodies to evaluate the expression levels of co-stimulatory molecules CD11c+, CD80+, and CD86+ on DCs. Additionally, the single-cell suspensions of tumors and spleens were stained with anti-CD3 FITC, anti-CD4 PerCP, and anti-CD8a APC. The serum concentrations of IFN-γ, TNF-α, and IL-12 in tumor-bearing mice in each group were detected by using an ELISA kit. Furthermore, tumor tissues were harvested and subjected to immunofluorescence staining using anti-CD8 FITC and anti-IFN-γ Cy3 antibodies. Co-expression of the fluorescent markers was analyzed under a laser confocal microscope to assess IFN-γ secretion and CD8⁺ T cell infiltration within the tumors.
In vivo anti-tumor efficacy
During the treatment period, mouse body weight was recorded every other day, and the long and short diameters of bilateral tumors were measured. Tumor volume was calculated using the formula: [(width)² × length]/2. On day 19 of treatment, mice were euthanized via cervical dislocation. The primary tumor tissues from each group were harvested for H&E staining and terminal deoxynucleotidyl transferase dUTP nick end labeling (TUNEL) assay to assess tumor cell necrosis. The metastatic tumor tissues were collected for proliferating cell nuclear antigen (PCNA) staining to evaluate tumor cell proliferation.
Statistical analysis
Data are presented as mean ± SD. Comparisons between groups were performed using Student’s t-test, one-way ANOVA, or two-way ANOVA, as appropriate. Statistical significance was defined as *p < 0.05, **p < 0.01, ***p < 0.001, and ****p < 0.0001. All experiments were performed independently at least three times.


Comments (0)