Study design and population
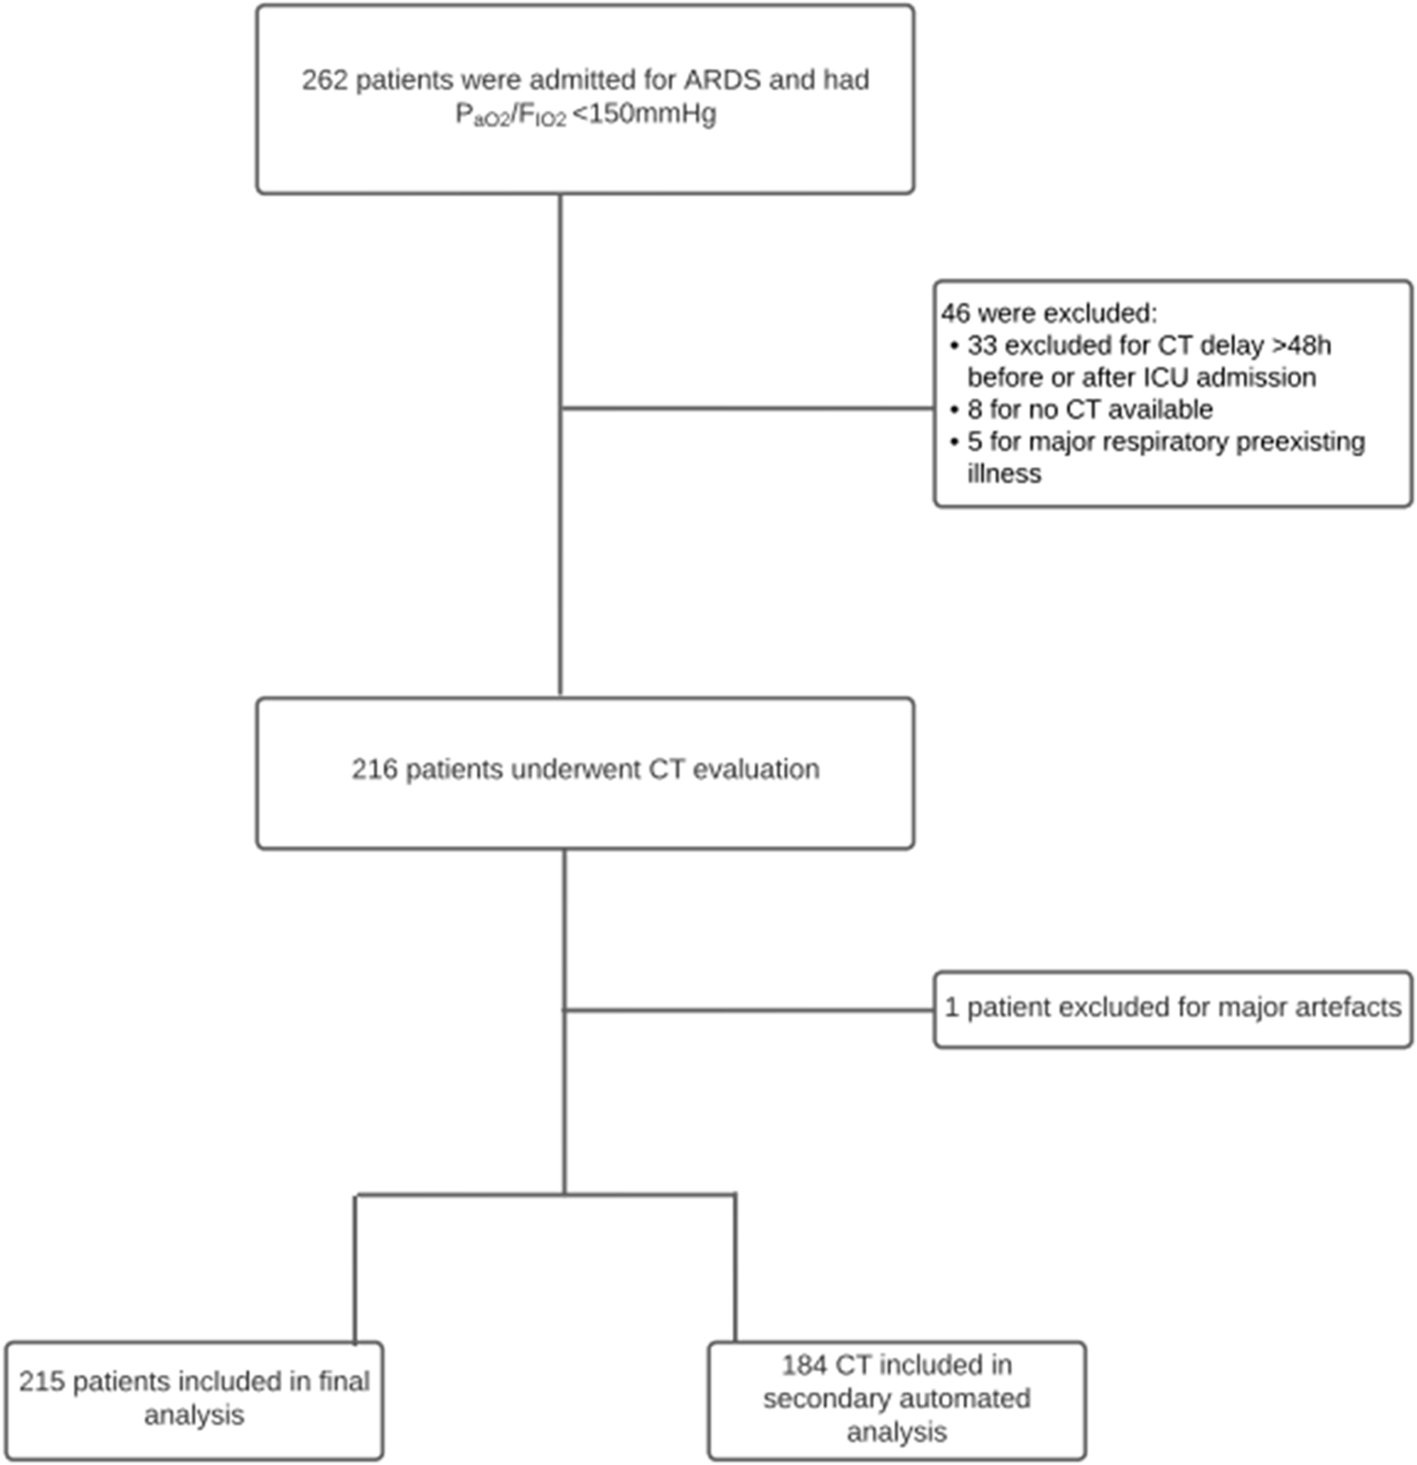
This retrospective study was conducted at Rennes University Hospital and approved by the local ethics committee (Rennes University Hospital Ethical Committee, approval number 22.183). Patients were eligible for inclusion if they were over 18 years of age, admitted between March 2020 and November 2022 with a confirmed COVID-19 infection (positive reverse transcription-polymerase chain reaction [RT-PCR] test on respiratory samples), and had an arterial oxygen tension/inspiratory oxygen fraction (PaO2/FiO2) ratio below 150 mmHg. This threshold is significant as prone positioning, and neuromuscular blockade are proven to be effective in patients with PaO2/FiO2 ratios below 150 mmHg [8,9,10].
ARDS was defined according to the Berlin criteria [11]. Moderate ARDS was classified by a PaO2/FiO2 ratio between 100 mmHg (exclusive) and 200 mmHg (inclusive), while severe ARDS was classified as a PaO2/FiO2 ratio ≤ 100 mmHg. All patients received protective ventilation in accordance with published guidelines [12].
Exclusion criteria included the absence of a chest CT scan within 48 h of ICU admission, prior pulmonary lobectomy, or known interstitial lung disease, as these could confound imaging patterns associated with COVID-19. Day 1 of the study was defined as the first day a patient’s PaO2/FiO2 ratio fell below 150 mmHg.
CT protocol and analysis
All patients underwent chest CT imaging either 48 h before or after ICU admission, with or without contrast injection. CT scans were performed using a 160-slice CT scanner (Canon Aquilion Prime®, Canon®, Otawara-shi, Tochigi, Japan) in volumetric mode with submillimeter collimation from the thoracic inlet to the lung bases. Scans were conducted in the supine position and, where possible, during suspended full inspiration (details in Supplementary Material file 1: Appendix 1).
Initial interpretations noted the presence or absence of pulmonary embolism, if data were available. Subsequently, CT scans were reviewed by a junior intensivist, a senior intensivist, and a thoracic radiologist according to a predefined evaluation grid and reconstruction protocol. Scans with significant artefacts that impeded visual interpretation were excluded. All analyses were performed using Telemis® (version 4.96 – January 2021, Telemis S.A., Belgium). Lung lesions were described following international guidelines from the Fleischner Society Glossary [13].
Lung disease extent was assessed using the CT Severity Score (CT-SS; range 0–25), a semi-quantitative scoring system developed by Chang et al. in 2005 [5, 14, 15]. Each lung lobe was scored based on the percentage of affected area:
0 points: no lung damage
1 point: <5% involvement
2 points: 5–25% involvement
3 points: 25–50% involvement
4 points: 50–75% involvement
5 points: >75% involvement
The total score, representing the sum of all lobe scores, ranged from 0 to 25. Lesions included ground-glass opacities, crazy paving patterns, and various consolidations, without distinction between types. Final scores were determined by consensus among the three reviewers, who were blinded to clinical outcomes.
Additionally, an automated, computer-aided analysis was conducted using artificial intelligence software (CT Pneumonia Analysis®, Siemens Healthcare, Erlangen, Germany). This software automatically assessed the percentage of affected lung area in each lobe and provided scores based on AI-driven segmentation (see Supplementary Material file 1: Appendix 2 for details on CT-SS calculation). An example of CT analysis by human and AI is also available in Supplementary Material file 1: Appendix 3.
Data collection
Clinical and demographic data were collected through a standardized questionnaire. Recorded variables included age, gender, chronic use of angiotensin-converting enzyme inhibitors or angiotensin receptor blockers, and main clinical parameters at ICU admission, such as body mass index (BMI), COVID-19 symptom duration, Glasgow Coma Scale score, blood pressure, heart rate, respiratory rate, body temperature, and 24-hour urine output.
Biological data collected at ICU admission and on the first day of ARDS included serum creatinine, urea, leukocyte and platelet counts, bilirubin, serum sodium and potassium levels, and arterial blood gas values (pH, PaO2, PaCO2, and HCO3−). Severity scores, including the Simplified Acute Physiology Score II (SAPS II) and Sepsis-Related Organ Failure Assessment (SOFA), were calculated [16, 17].
Comorbidities were defined as follows:
Respiratory illnesses: chronic obstructive pulmonary disease (COPD) or chronic respiratory failure
Cardiac illnesses: chronic heart failure, coronary artery disease, or treated hypertension
Immunocompromised status: use of immunosuppressive therapies, active cancer, or primary immunodeficiency diseases
Obesity: BMI ≥ 30 kg/m2
Diabetes mellitus
The Charlson Comorbidity Index was also calculated [18].
During the ICU stay, data were collected on corticosteroid use, neuromuscular blockade, inhaled nitric oxide, and ventilator parameters at Day 1 of ARDS (tidal volume [VT], respiratory rate [RR], positive end-expiratory pressure [PEEP], static compliance [Cstrs], and plateau pressure [Pplatrs]). Infectious complications, pulmonary embolism events, and co-infections were recorded and categorized into bacterial, viral (e.g., CMV and HSV), and fungal (e.g., Aspergillus) pneumonia [19]. Patients with co-infection were included in each sub-group.
The duration of mechanical ventilation, length of ICU stay, prone-positioning sessions, and use of extracorporeal membrane oxygenation (ECMO) were also documented. Mortality data were obtained from hospital records or the French National Institute of Statistics and Economics (INSEE) database.
Endpoints
CT scans were classified as severe (CT-SS ≥ 18) or non-severe (CT-SS < 18) based on the calculated CT-SS [7, 20].
Primary objective: To compare 90-day mortality following ICU admission between patients with severe and non-severe CT scores.
Secondary objectives: To evaluate ICU mortality, complications (e.g., pulmonary embolism and pneumonia), ventilator-free days at 28 days, and ICU length of stay.
Statistical analysis
Continuous variables are presented as means ± standard deviations (SDs) if normally distributed or medians (interquartile ranges [IQRs]) if non-normally distributed. Categorical variables are presented as numbers (percentages). Normality was assessed using the Shapiro-Wilk test. Comparisons between categorical variables were performed using the χ2 test or Fisher’s exact test, as appropriate, and continuous variables were compared using the Mann-Whitney U test.
For survival analysis, ICU admission was defined as time zero. Kaplan-Meier survival and cumulative incidence curves were constructed up to Day 90 and compared using the log-rank test. Patients alive at Day 90 were censored. Ventilator-free days were defined as the number of days within the first 28 days post-admission during which the patient was alive and not receiving mechanical ventilation. Patients who died within this period were assigned zero ventilator-free days.
Multivariate logistic regression was performed to analyse associations between severe CT scores, clinical scores, and major ventilatory parameters.
To evaluate AI performance, Spearman correlation was used to compare AI-generated scores with human assessments, considered the gold standard. Sensitivity, specificity, positive predictive value (PPV), and negative predictive value (NPV) were calculated from a 2 × 2 table.
All p-values were two-sided, with significance set at p < 0.05. Statistical analyses were conducted using R software (version 4.2.1, R Foundation for Statistical Computing, Vienna, Austria).


Comments (0)