This study builds on the approach taken by Oddershede and Petersen but we have used more advanced regression, sampling, and validation techniques on large datasets with the aim of predicting mean Danish EQ-5D-5L utilities based on mean UK EQ-5D-3L utilities. The study used trial data as the basis for model fitting and validation and is different from the approach applied by Nemes et al., who investigated adjustment algorithms between mean UK and Swedish EQ-5D-3L utilities based on an artificial dataset [21].
2.1 Datasets
The study utilized datasets from 11 oncology clinical trials assessing nivolumab versus comparators in various indications. A pooled dataset was formed from eight of the trials to include a total of 30,755 EQ-5D-3L observations. The pooled dataset included studies of treatments for metastatic non–small-cell lung cancer (NSCLC) (CheckMate 017, ClinicalTrials.gov identifier: NCT01642004 and CheckMate 057, NCT01673867), metastatic melanoma (CheckMate 037, NCT01721746; CheckMate 066, NCT01721772; and CheckMate 067, NCT01844505), resected stage IIIB/C or stage IV melanoma (CheckMate 238, NCT02388906), metastatic renal cell carcinoma (CheckMate 025, NCT01668784), and recurrent or metastatic squamous cell carcinoma of the head and neck (CheckMate 141, NCT02105636). The same pooled dataset was previously used to compare generic and condition-specific preference-based measures [22].
Three separate datasets with a total of 21,587 EQ-5D-3L observations were used for external validation. The external validation datasets included studies of treatments for malignant pleural mesothelioma (MPM) (CheckMate 743, NCT02899299), NSCLC (CheckMate 9LA, NCT03215706), and esophageal cancer (CheckMate 577, NCT02743494). Information about the pooled dataset as well as the validation datasets is included in the Supplementary Appendix Tables 1 and 2 (see electronic supplementary material [ESM]).
2.2 Assessments
All the included trials collected EQ-5D-3L data from patients and analyses were performed on all randomized subjects (i.e., all subjects who were randomized to one of the treatment arms in the study) at all available assessment time points, excluding data from screening. The EQ-5D-3L utilities were calculated with the UK population value set with theoretical health state utility values ranging from − 0.594 to 1 [7]. The EQ-5D-3L responses were mapped to EQ-5D-5L responses using the van Hout and Shaw preferred mapping algorithm, which is based on an ordinal logistic regression accounting for the effects of adjacent dimensions as well as a latent factor but excluding the effects of age and gender [10]. Mapped EQ-5D-5L values were based on the Danish value set, which has a theoretical range from − 0.757 to 1 [14].
2.3 Study Design
The study design incorporated a secondary analysis of the EQ-5D-3L utility scores. Model fitting and internal cross-validation were completed on the pooled dataset. The top-performing model was externally validated against the remaining three separate datasets. External validation is an important step in predictive modeling, as the apparent performance of the model in the pooled dataset may be optimistic [23,24,25]. External validation can be thought of in terms of reproducibility and transportability [26]. Reproducibility concerns model performance across new samples from the same population of model development, which is the case for CheckMate 9LA in NSCLC (as CheckMate 017 and 057 in the pooled sample are also NSCLC). Transportability concerns model performance across samples from different but related source populations, which is the case for CheckMate 743 (first-line MPM) and CheckMate 577 (adjuvant esophageal or gastroesophageal junction cancer). Assessment of predictive model transportability is important as it reflects the intended eventual use of the predictive algorithm across disease areas.
2.4 Statistical Analyses
Analyses were conducted using SAS (version 9.4, SAS Institute, Cary, NC, USA) and R (version 4.0.3).
2.5 Derivation of Dataset for Model Fitting
As this was a secondary analysis, the primary objective analyses were not based on formal significance tests; therefore, the power or sample size for the study was not determined for this purpose. However, based on guidelines to estimate minimum sample size for prediction models for continuous outcomes, 235 observations were deemed minimally sufficient assuming a conservatively low R2 value of 0.64 [27, 28], corresponding to a Pearson’s correlation of 0.8.
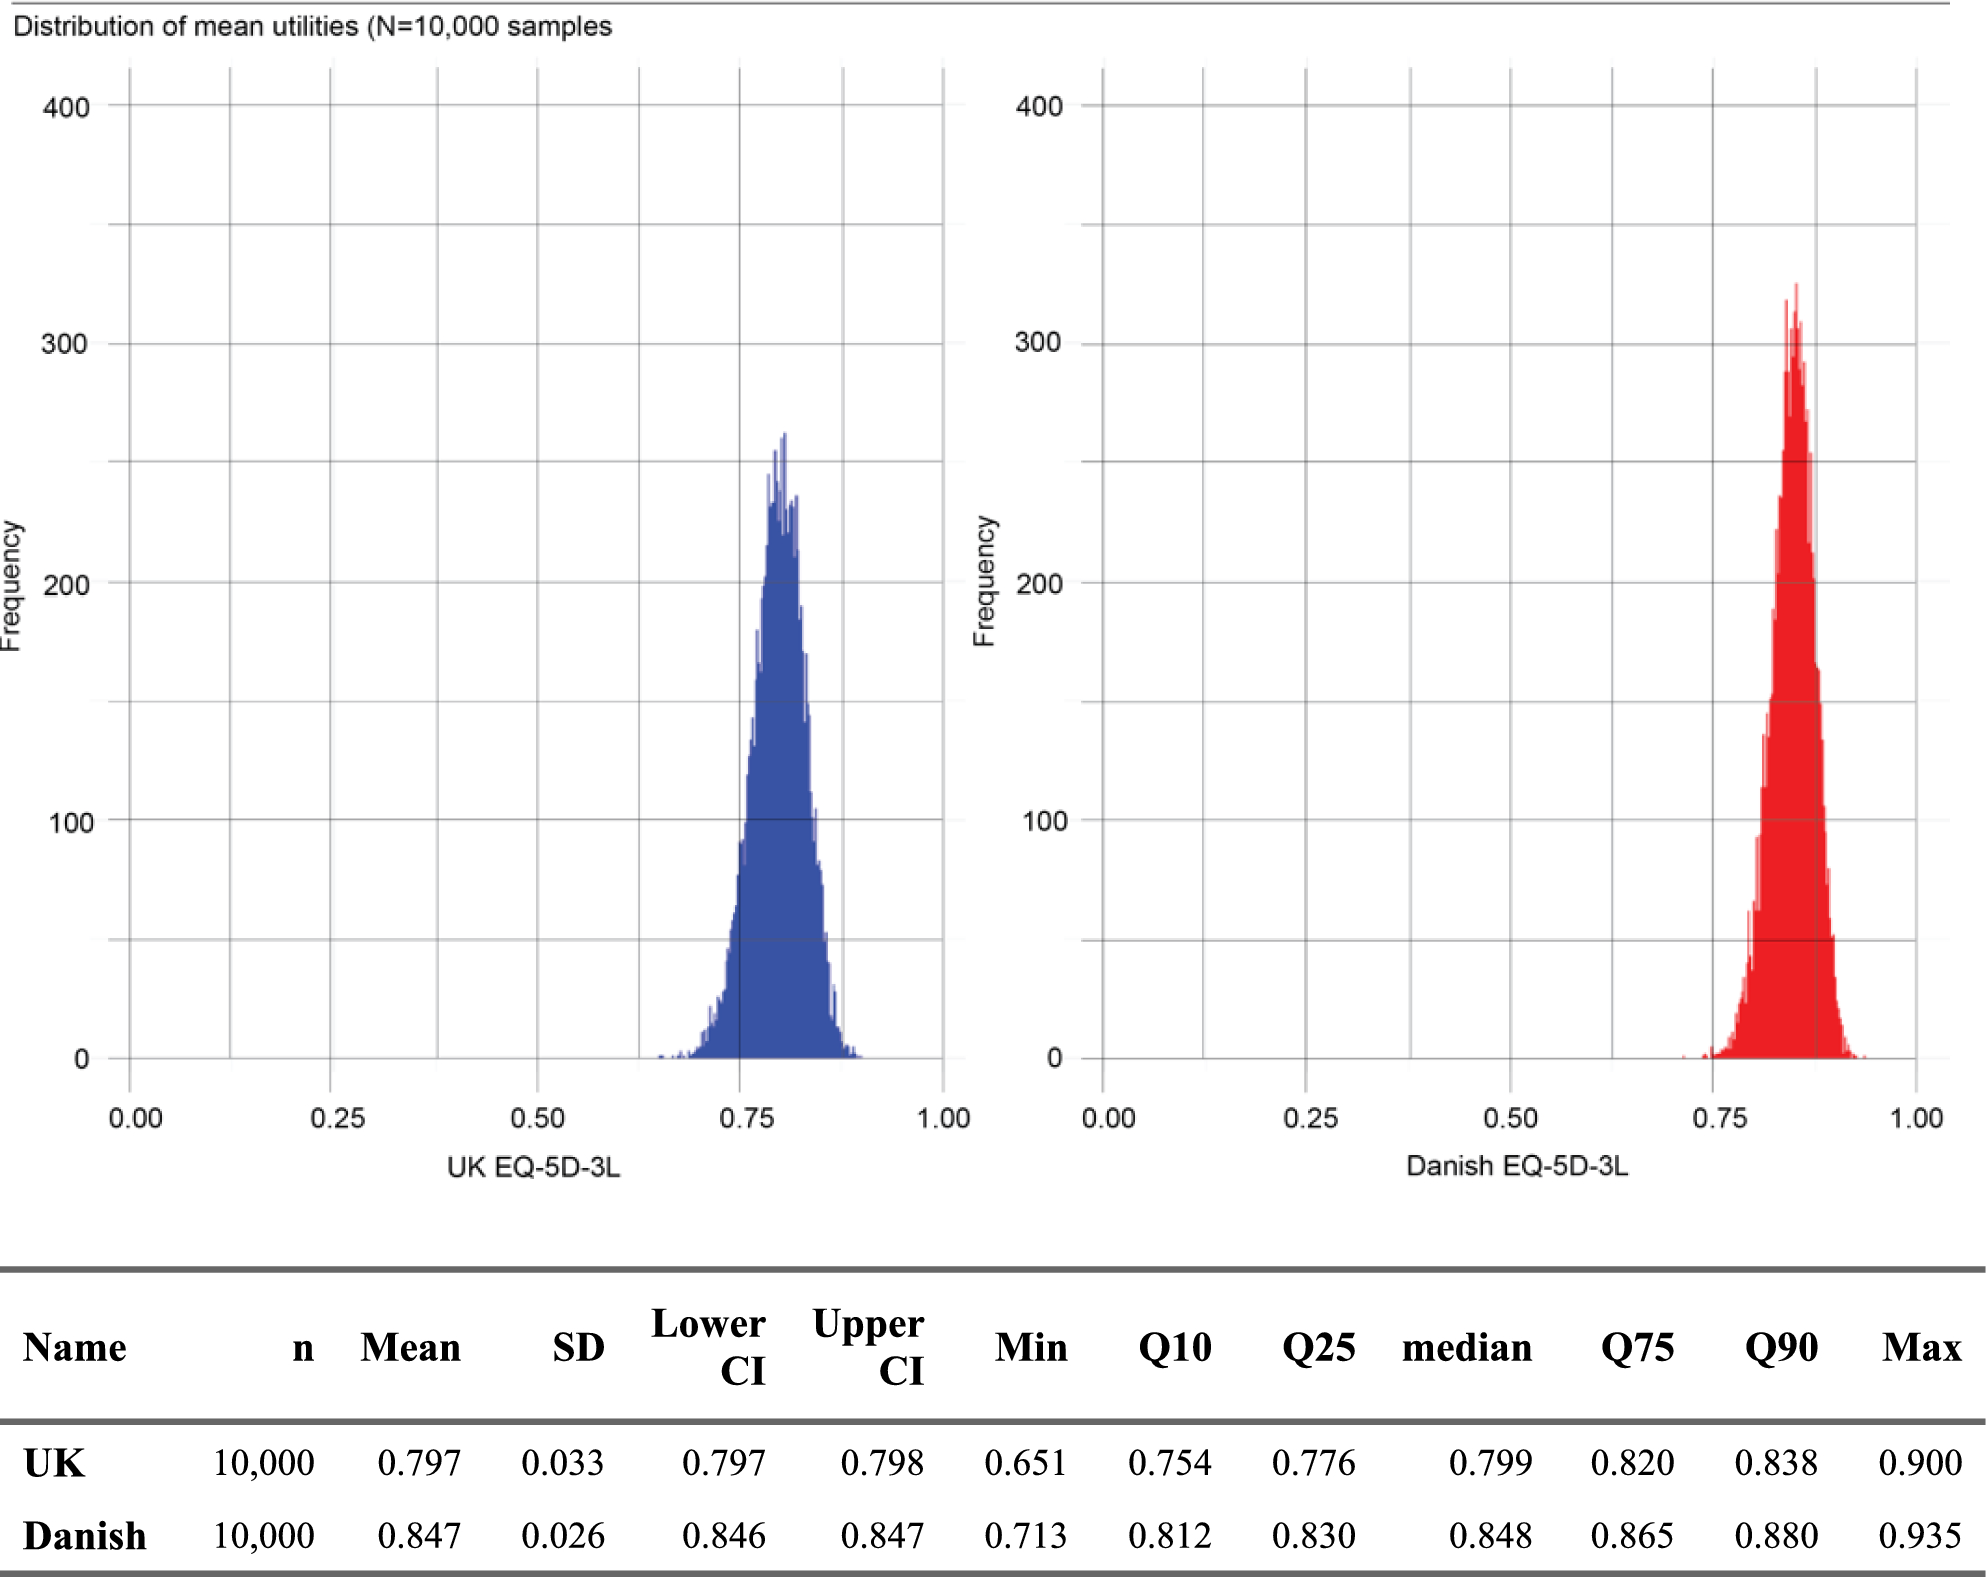
A bootstrap procedure was followed to derive a development dataset for model fitting. First, a random sample of 50 observations from the pooled dataset was obtained. The mean and standard deviation of this n = 50 sample was calculated for UK EQ-5D-3L and the corresponding mapped Danish EQ-5D-5L utilities. This process was repeated 10,000 times with replacement, resulting in a development dataset of 10,000 matched mean utility values.
Initial descriptive analyses were conducted on the development dataset, to better understand the distribution of the mean utilities. The mean, standard deviation, 95% confidence intervals, minimum, maximum, median and 10th, 25th, 75th, and 90th percentiles for the mean utility values were calculated. Histograms of the mean utilities were plotted. Spearman’s correlations between the mean UK and Danish utilities were presented alongside a scatter plot and line of best fit (locally estimated scatterplot smoothing [LOESS]).
2.6 Model Fitting
A series of candidate regression models were fitted, with mean EQ-5D-5L Danish utilities as the outcome variable and mean UK EQ-5D-3L utilities as predictor. The choice of regression model was guided by the distribution of both input variables and included simple linear regression (linear model), quadratic polynomial regression (quadratic model), cubic polynomial regression (cubic model), linear regression with restricted cubic splines (spline model) [29], and finite mixture models [30]. The spline model required specification of the number of ‘knot’ points (a minimum of three knot points is required); a range of spline models that included three to six knot points were specified, with the best fitting model selected according to lowest Akaike information criterion (AIC) value. The best fitting spline model was found to be a three-spline model. The mixture model required specification of the number of ‘clusters’ (i.e., assumed mixtures of underlying probability distributions); a range of Gaussian mixture models that included one to five clusters was specified, with the best fitting model selected according to lowest AIC value. The best fitting mixture model was found to be a two-cluster mixture model. Although models to predict EQ-5D utility values in the literature include those for censored outcome variables (i.e., cannot exceed ‘full health’ at 1), no models for censored outcome variables were employed because this is unlikely to be the case for mean utility values [31].
2.7 Internal k-Fold Cross-Validation
The performance of each model was assessed internally through k-fold cross-validation with ten folds [32]. The process was as follows:
1.
The development dataset was randomly split into ten equally sized subsamples.
2.
One subsample was held as a validation set, and the regression model fitted to the other nine subsamples.
3.
The performance in the validation set was evaluated.
4.
Point two and three were repeated with each of the remaining nine subsamples held as an alternative validation set.
5.
The average value for performance statistics across the ten iterations was the overall statistic for the model.
The performance statistics for each model comprised AIC, Bayesian information criterion, R2 (R2 proxy was calculated for the two-cluster mixture model, i.e., the correlation between response and predicted response) [33], mean absolute error, mean squared error, and root mean squared error (RMSE). RMSE was prioritized as a measure of performance because it is measured in the same units as the data, is representative of the size of a ‘typical’ error and is more sensitive than other measures to the occasional large error. The choice to prioritize a measure of prediction error over model fit is also recommended for predictive modelling studies of EQ-5D data [34].
2.8 External Validation
Predictions from the best performing model were applied in each of the separate external validation datasets. The prediction error was calculated as the predicted Danish EQ-5D-5L mean minus the observed Danish EQ-5D-5L mean. This was conducted for individual utility observations as well as a series of mean values, including arithmetic mean at baseline, post-baseline and least-squares means from a linear mixed model incorporating all baseline and post-baseline visits, including follow-up irrespective of treatment arm.


Comments (0)