
Remember me
A previously published Markov model [27] was adapted to estimate the course of HF and CKD disease progression in patients with HK, treated with either patiromer or standard of care (SoC), using data from the DIAMOND trial [27]. The aim was to estimate the costs and benefits associated with utilising patiromer for HK management from an Italian NHS perspective.
2.1 Trial Design and Patient PopulationThe DIAMOND trial was a prospective phase 3b multinational, multicentre, double-blind, randomised withdrawal, parallel-group, placebo-controlled trial that was designed to evaluate whether patiromer treatment in patients who developed HK while receiving RAASi medications would result in improved K+ concentration and in turn lead to optimisation of RAASi use, consistent with guidelines [30] (ClinicalTrials.gov: NCT03888066).
The patient population for this analysis was adults ≥ 18 years old with New York Heart Association (NYHA) class II–IV, heart failure and left ventricular ejection fraction (LVEF) of ≤ 40% and HK defined as serum K+ of > 5.0 mmol/l with diagnosed CKD and receiving a stable RAASi dose [31]. Baseline patient demographics and clinical characteristics of DIAMOND have been described previously [24, 31]. Subjects were required to have HK at screening (defined by two K+ values of > 5.0 mEq/L) while receiving an angiotensin-converting enzyme inhibitor (ACE)/angiotensin receptor blocker (ARB)/angiotensin receptor/neprilysin (ARN) inhibitor, and/or a mineralocorticoid receptor antagonist (MRA).
Following screening, eligible subjects were enrolled into a single-blinded run-in phase with weekly visits. The purpose of the run-in phase was to control K+ levels with patiromer while simultaneously optimising the use and doses of RAASi medications, including MRA (titrated to 50 mg/day). Patiromer was titrated up to a maximum of three packs/day (8.4 g/pack). After the run-in phase, lasting up to 12 weeks, subjects underwent a double-blind randomisation in a 1:1 ratio, to receive either continued patiromer or placebo (patiromer withdrawal). The K+ levels were measured at screening, at baseline (after the run-in phase, prior to being assigned to a treatment arm), at day 3, at weeks 1, 2, 6 and 18 and every 3 months until the end of the study. The median follow-up time was 27 weeks.
The primary analysis endpoint for the DIAMOND RCT was the mean change in serum K+ levels between day 1/baseline (end of run-in phase) and study completion (end-of-study visit). Secondary outcome measures included the total number of cardiovascular hospitalisations and mortality.
2.2 Economic ModelThe Markov cohort model was used to predict the natural course of CKD and HF progression over a lifetime horizon, in line with Health Information and Quality Authority technology assessment guidelines [32]. The model followed a monthly cycle and disease progression simulated over a lifetime. Costs and quality-adjusted life years (QALYs) were discounted at 3% per annum.
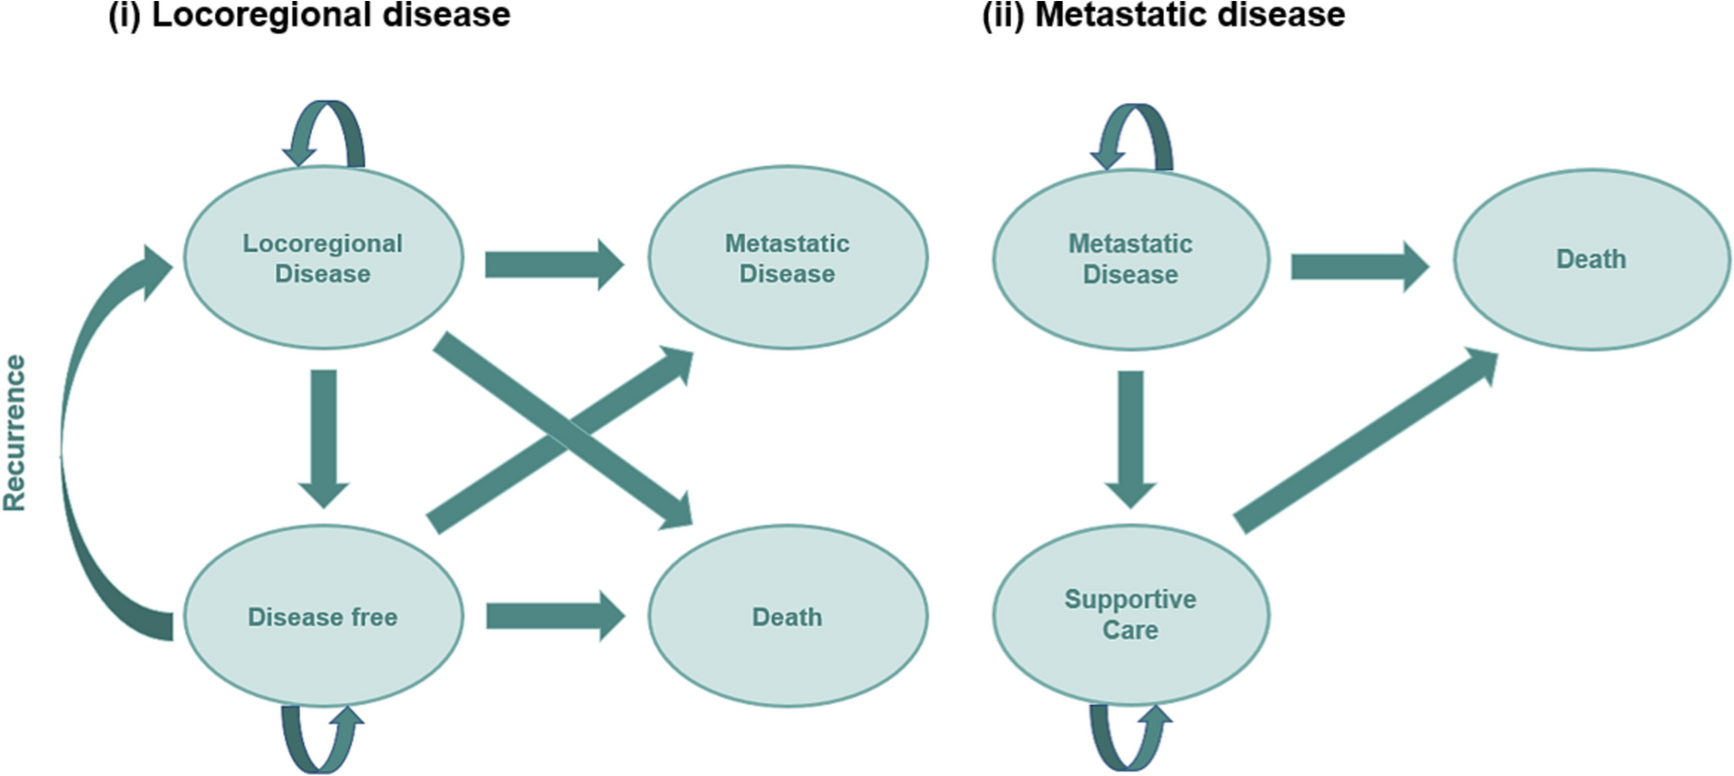
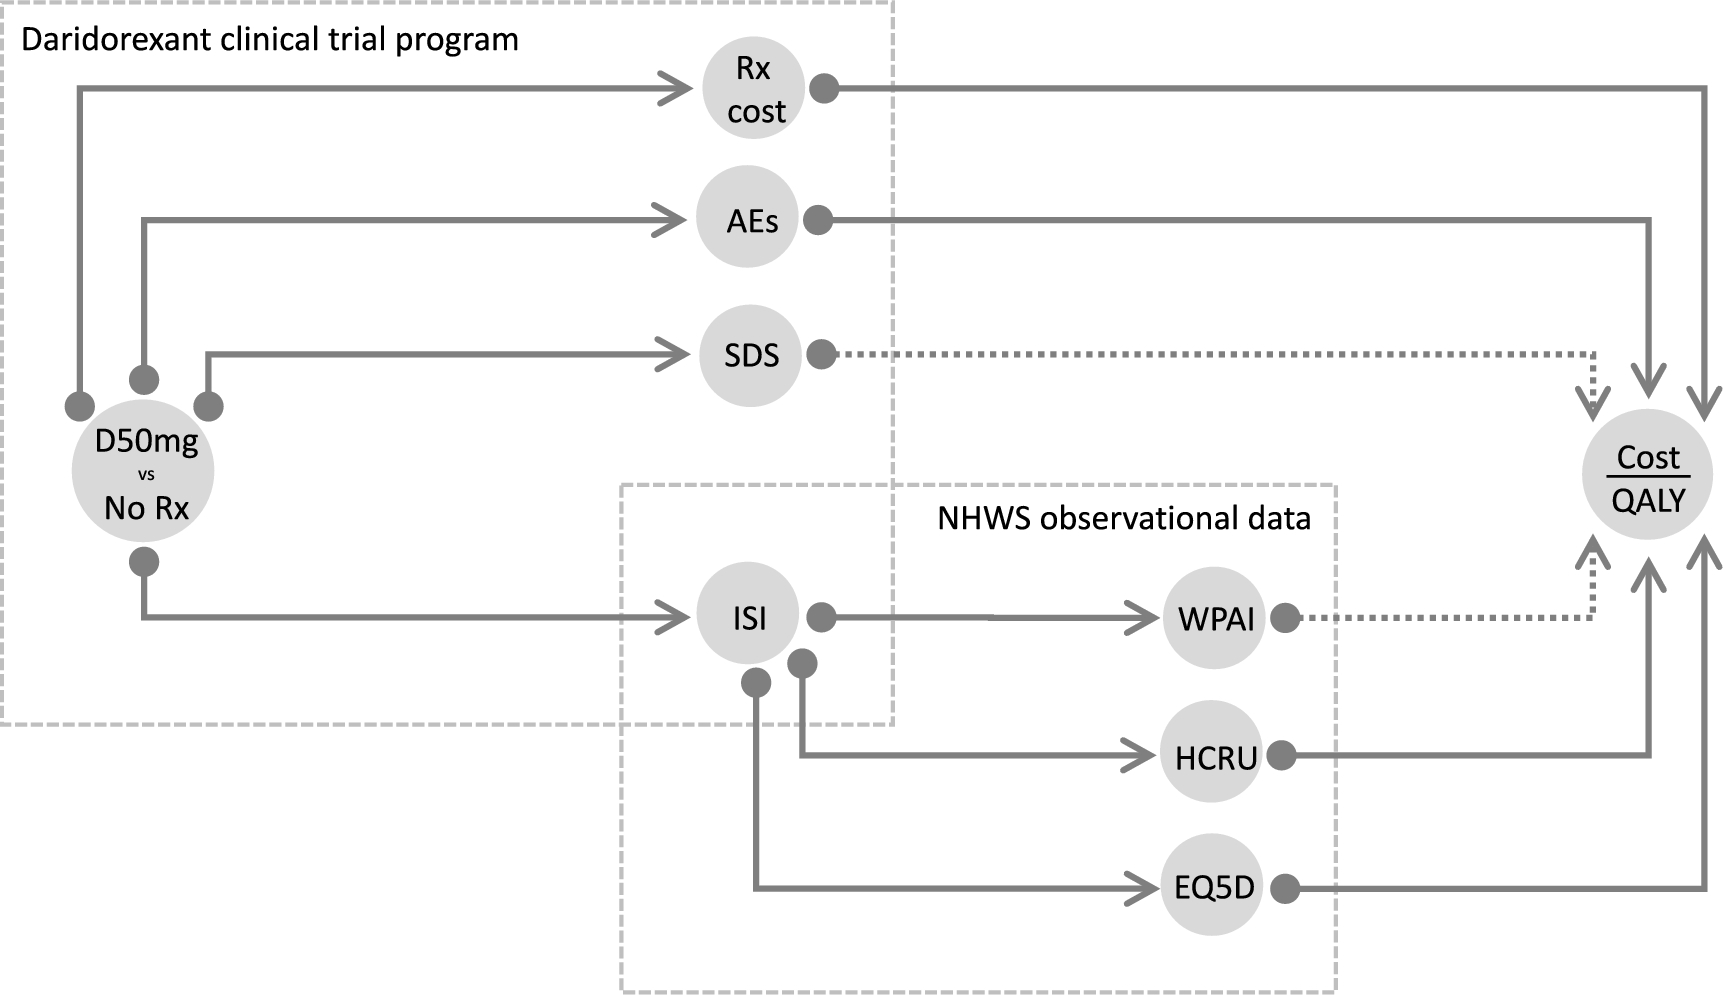
2.2.1 Disease ProgressionAll patients entered the model with both HF and CKD (Fig. 1), with baseline characteristics and details of modelled cohort characteristics provided in Online Resource 1. The model progressed patients through estimated glomerular filtration rate (eGFR) stages 1 to 5 and HF progression through NYHA categories I to IV, independently of one another, according to health state transition probabilities (Table 1). Transition probabilities within CKD stages were dependent on RAASi usage, and major adverse cardiovascular event (MACE) risk was applied depending on CKD stage, RAASi usage and K+ level. Patients left the model when the death health state occurred; mortality rates were influenced by dialysis, transplant, CKD stage, K+ level and RAASi usage [33,34,35,36,37]. Additional information on mortality rates is provide in Online Resource 1.
Fig. 1
Model structure. States highlighted in grey represent starting health states. CKD chronic kidney disease, HF heart failure, HK hyperkalaemia, MACE major adverse cardiovascular event, NYHA New York Heart Association, RAASi renin-angiotensin-aldosterone system inhibitor
Table 1 Model inputs controlling initiation and management of RRT (RRT module)The model captured the value of each treatment as each patient progressed by recording the incidence of HK and RAASi down-titration or discontinuation. Three levels of RAASi usage were included: maximum (optimal), down-titrated (sub-optimal) and off. At cohort initialisation, RAASi use for patiromer was based on DIAMOND trial data and for SoC it was approximated based on published RAASi discontinuation rates and HK baseline distribution. Additionally, monthly probability of RAASi discontinuation, down-titration for different K+ levels (≤ 5, > 5 to ≤ 5.5, > 5.5 to ≤ 6, > 6) and returning to RAASi max following discontinuation or down-titration was assessed on the basis of Linde et al.’s RWE study [14]. The probability of CKD progression, death in CKD patients, MACE in CKD and HF patients, hospitalisations in CKD and HF patients, and HK events was influenced by RAASi usage. In addition, hospitalisations (defined as any hospitalisation) and major adverse cardiovascular events (MACE; defined as HF, ischaemic stroke, coronary heart disease and peripheral arterial disease, leading to hospitalisation) were also recorded within the model as transient events with patient health state (CKD and HF), RAASi treatment and HK severity influencing the probability of each outcome. The rate of hospitalisation was dependent on CKD and NYHA stage, and RAASi usage and K+ level. There was no maximum number of MACE events an individual could experience; the incidence of MACE events was influenced by RAASi usage (optimal, sub-optimal, off), K+ level and CKD stage. Subsequent MACE events were not influenced by previous MACE. For MACE and mortality events, if a patient has both CKD and HF, the higher risk is taken. In the blinded treatment phase and including assessments recorded after the end of DIAMOND trial, AEs including hypokalaemia (mild-severe), hypomagnesemia, diarrhoea, constipation, nausea, any AE leading to withdrawal and any serious AE were recorded. Owing to the low incidence of AE leading to withdrawal and severe AEs in the DIAMOND clinical trial (similar proportions were recorded in both the patiromer and placebo groups; AEs leading to withdrawal were 2.7% and 2.5%, respectively, and there was a 0.2% rate of severe AE events in both groups) [24], AEs were not modelled in the present analysis. Additional model details are provided in Online Resource 2.
2.2.2 CostsEach modelled health state and event was associated with direct medical costs, as shown in Online Resource 3. Costs were applied from the perspective of the Italian healthcare system and inflated to 2022 values [38,39,40,41].
A literature search was undertaken to identify costs estimates for HF and CKD health states [42,43,44]. For each patient, RAASi status (optimal, down-titrated and discontinued) and severity of HK events (mild HK: K+ 5.0–5.5 mmol/L; moderate HK: K+ 5.5 to ≤ 6 mmol/L; and severe HK: K+ > 6 mol/L) were used to inform healthcare resource usage. In addition, costs for different events including end-stage kidney disease (ESKD)-related events (dialysis complications, transplant procedures and dialysis access), major events (MACE and hospitalisations) and medical visits and tests associated with HK management were taken from published literature and country reference unit costs. Health state costs associated with HF disease management were estimated as zero to avoid double counting (costs for HF event costs, MACE and hospitalisation were included). Patient death was assumed to incur no cost. A recent National Institute for Health and Care Excellence (NICE) technology appraisal for the treatment of HK (TA599) was used to inform resource use for HK management [45].
The acquisition cost of patiromer was €10.81 per 8.4 g per day. Three annual costs for RAASi use were calculated by per patient and subgroup: €175.89 for optimal, €87.95 for sub-optimal (down-titrated) and €0.00 for discontinued RAASi, based on the average patient drug usage (informed by the Italian clinical members of the study team on the basis of their clinical expertise and knowledge). There was no stopping rule (stopping after a predefined time period) for patiromer, and it was assumed it would be continued throughout the patient’s lifetime or until discontinuation occurs.
2.2.3 Utility InputsUtility weights were applied to calculate QALYs, with one QALY representing 1 year of life in perfect health. Italian age-dependent utility estimates informed the baseline utility of the trial population. Both CKD and HF health state utilities and event disutilities were applied to calculate QALYs per arm for each cycle, but to avoid double counting, HF health state utilities were assumed to be unity. Italian utility data for health state and event components was used where available. Where Italian-based data were unavailable, estimates based on other country settings were applied. Full details on the applied utility weights are detailed in Online Resource 4.
2.2.4 Mean K+ ConcentrationAll participants (treatment and SoC) of the DIAMOND trial received, by protocol, patiromer therapy during an initial 12-week run-in phase, to standardise baseline RAASi therapy and K+ levels. This approach meant that, after randomisation and up until the end of the DIAMOND study, the mean K+ concentration of the placebo arm is influenced by the legacy effect of patiromer treatment received during the run-in phase [24]. However, this does not provide a realistic mean K+ value for informing the SoC arm of the cost-effectiveness model. Instead, the clinical outcomes from SoC reflect the continual beneficial effect from the previous patiromer treatment, as shown in Butler et al. [24].
To better represent the mean K+ levels for SoC in this analysis, data from a RWE study by Linde et al. [14], with a comparable patient profile to DIAMOND, with a large cohort size of 21,334 UK HF/CKD patients with K+ ≥ 5.0 mmol/L, was used to better represent the performance of mean K+ levels in SoC in this cost-effectiveness analysis.
Owing to differing population characteristics between DIAMOND and the RWE study, an indirect treatment comparison (ITC) was conducted to inform mean K+ values for the baseline and patiromer arm of the cost-effectiveness model. This calculated adjusted estimates of serum K+ concentrations, at screening phase and end of run-in phase, respectively, for the DIAMOND [24] study population that would be expected if the population were identical to that observed in the comparator RWE study [14]. Note that the mean K+ value at the screening phase of the trial was used as the “baseline” in the model while that at the end of the run-in phase of the trial was used as the “after patiromer treatment” value in the model.
A matching adjusted indirect comparison (MAIC) was deemed to be the most appropriate ITC methodology, as outlined in NICE DCU27 [46] and Signorivitch et al. [47]. It allows individual patient-level data from an index study to be reweighted to match aggregate patient characteristics of a comparator study [45, 47]. Study outcomes are subsequently reweighted in a comparable manner, allowing the effect of the intervention in the index study to be estimated in a population similar to that of the comparator study. Here, individual patient data from the index trial were reweighted to provide weighted patient characteristics of the trial that matched patient characteristics of the RWE cohort [14].
For the unanchored MAIC analyses (i.e. where there is no connected network of evidence for the treatments of interest), all prognostic factors (PFs) and treatment effect modifiers (TEMs) variables were included as covariates for adjustment. Variables were identified from a review of patiromer literature and considered to be PFs or TEMs [14, 24]. Subsequently, these variables were used as the matching variables in the analysis, and included age, region (proportion in European region), sex (proportion male), diabetes (proportion with diabetes flag) and eGFR. Since baseline serum K+ was the outcome of interest in the MAIC, it was not included as a matching variable.
Population reweighting (Online Resource 5) indicated that there was sufficient overlap between the DIAMOND and Linde et al. study populations and that it was feasible to use MAIC to derive adjusted serum K+ concentrations. The MAIC produced an effective sample size of 254, based on the matching variables listed above; this was a reduction from the 878 patients from the DIAMOND trial.
Baseline characteristics before and after matching were similar; the reweighting of the patiromer population was successful for the five variables on which the populations were matched (Table 2). To further investigate the matching of covariates, which were not adjusted, a Love plot was created (Online Resource 5). The proportions of patients using ACEIs, ARBs and MRAs differed at baseline. However, since all patients in the DIAMOND study received RAASi at baseline, adjustment of RAASi use was not possible. Similarly, it was not possible to match the populations using MRAs, as 99.9% of the patients in DIAMOND used MRAs at baseline. Whilst the two populations are well matched on variables such as age, sex, region, eGFR and diabetes, there were some differences between the RWE and adjusted populations.
Table 2 Baseline characteristics of DIAMOND trial before and after adjustment compared with baseline characteristics of RWE studyTo enable the calculation of mean serum K+ concentrations at screening (used as the baseline K+ level in the model) and baseline (end of run-in, used as the “after patiromer treatment” value in the model) for patients from the DIAMOND trial, MAIC weights were applied to the patients in DIAMOND [24], adjusted to a population similar to the RWE study [14]. The mean serum K+ concentration values at baseline (after run-in) and after patiromer are presented in Table 3.
Table 3. Mean serum K+ level inputs2.3 Analysis2.3.1 Base CaseThe model was utilised to assess the lifetime impact of patiromer use compared with SoC for the treatment of HK in patients with HF and CKD. The primary model outcome was the incremental cost-effectiveness ratio (ICER) and represents the extra cost per QALY gained. The ICER was calculated as the difference in cost between the treatment (patiromer) and SoC arms divided by the differences in QALYs. The treatment was considered cost-effective if the ICER was less than the willingness-to-pay (WTP) threshold of €40,000/QALY gained [48,49,50,51,52].
2.3.2 Sensitivity AnalysesDeterministic sensitivity analysis and probabilistic sensitivity analysis were conducted to quantify the level of confidence in the ICERs, and incremental net monetary benefit (INMB) and analyse uncertainty in clinical and economic outcomes. A deterministic sensitivity analysis assessed the impact of individual parameters on the model outcomes, using lower and upper values (bounds of 95% confidence intervals or minimum and maximum values). For the probabilistic sensitivity analysis, patient characteristics and demographics were sampled using a normal distribution; transition probabilities, utility and disutility values were sampled using a beta distribution; costs were sampled using a gamma distribution; and hazard ratios and odds ratios were sampled using a log-normal distribution.
2.3.3 Scenario AnalysesA scenario analysis was performed to determine the effect if both the patiromer and SoC cohorts were to have the same RAASi usage distribution at model entry. The values for patiromer from the DIAMOND clinical trial were applied to the SoC cohort. Additional scenario analyses were performed to explore the effect of varying baselines characteristics of the model population. These included patients grouped according to CKD severity, denoted by baseline eGFR. Patients with CKD stage 3a (eGFR 45–59 mL/min/1.73 m2) and stage 3b (eGFR 30–44 mL/min/1.73 m2) and stage 4 (eGFR 15–29 mL/min/1.73 m2) were analysed for the cost and benefit implications of patiromer at different stages of the CKD pathway. Furthermore, patients with history of HK were adopted as a subgroup, in which patients reporting at baseline with normokalaemia (serum K+ ≤ 5) were excluded from the model analysis. A final scenario analysis was performed to determine the impact of including HF disease management costs alongside the CKD disease management costs; the NYHA-dependent costs were sourced from Rognoni 2019 [53].
Comments (0)