
Remember me
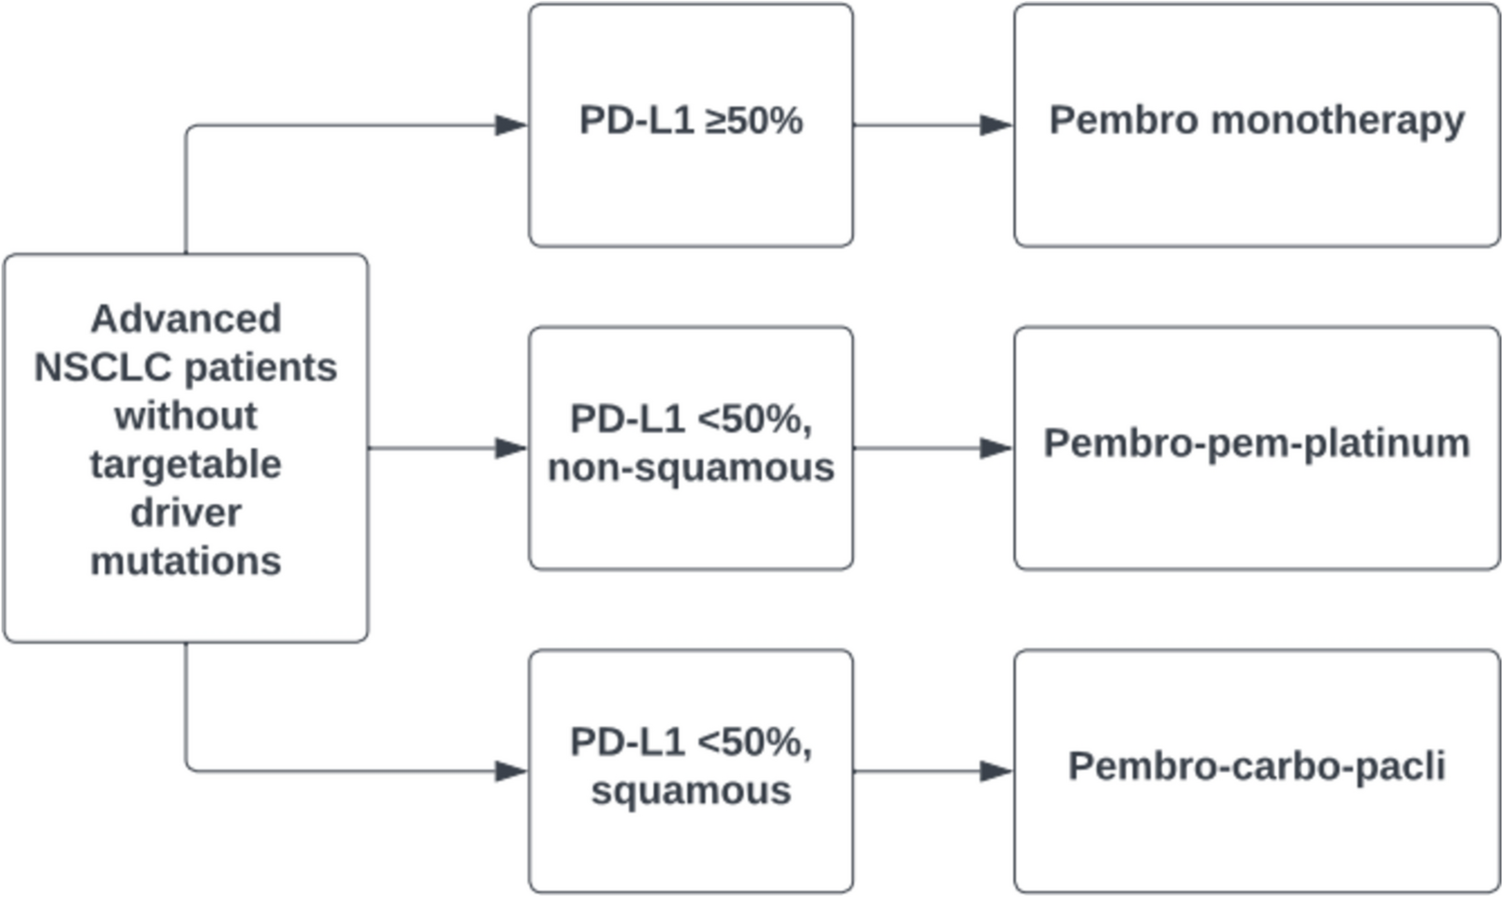
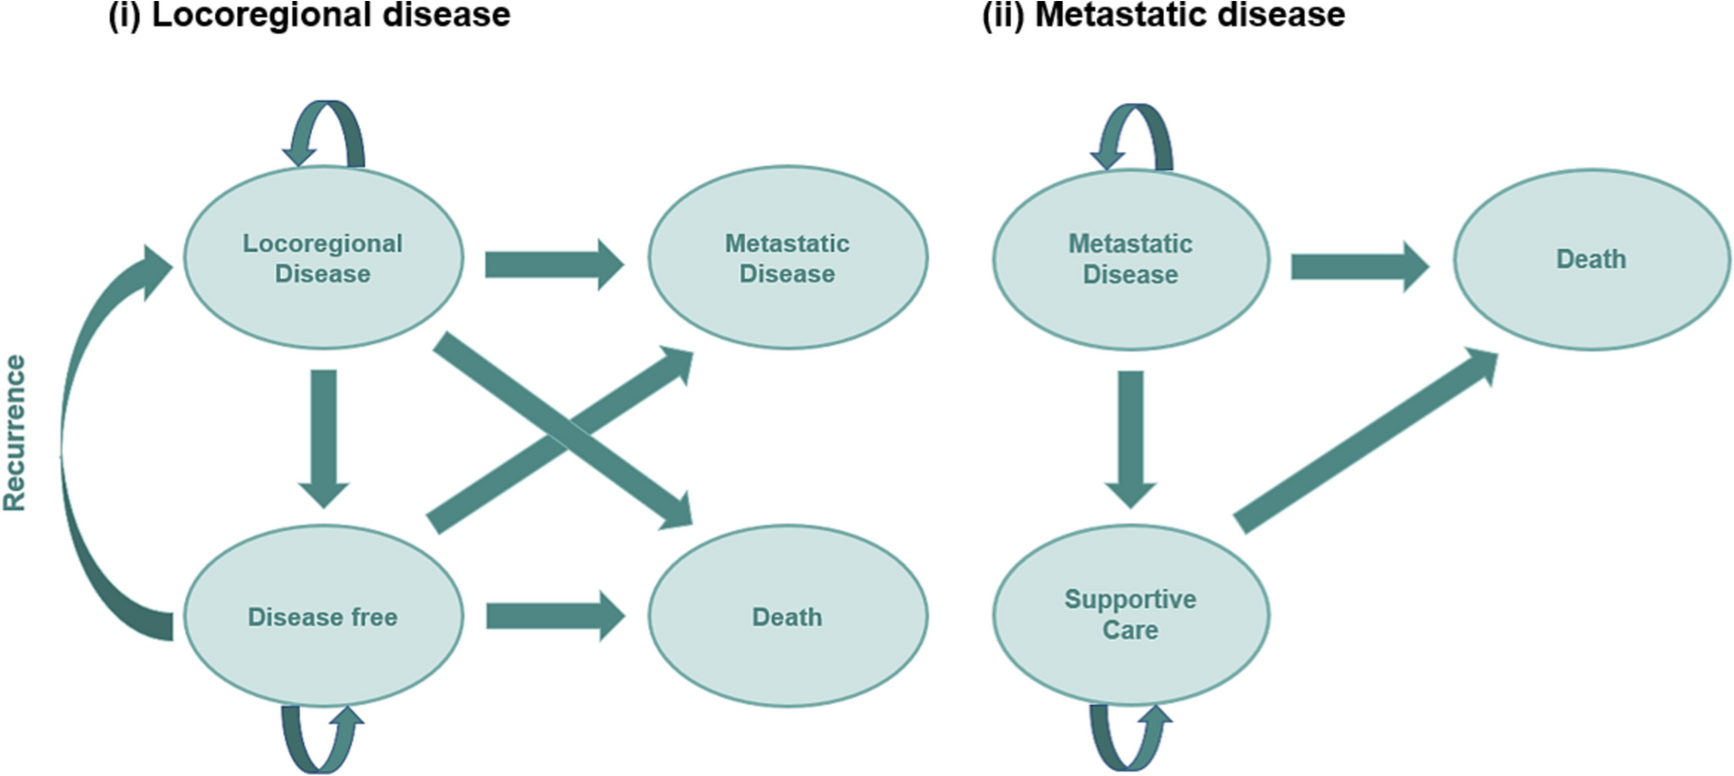
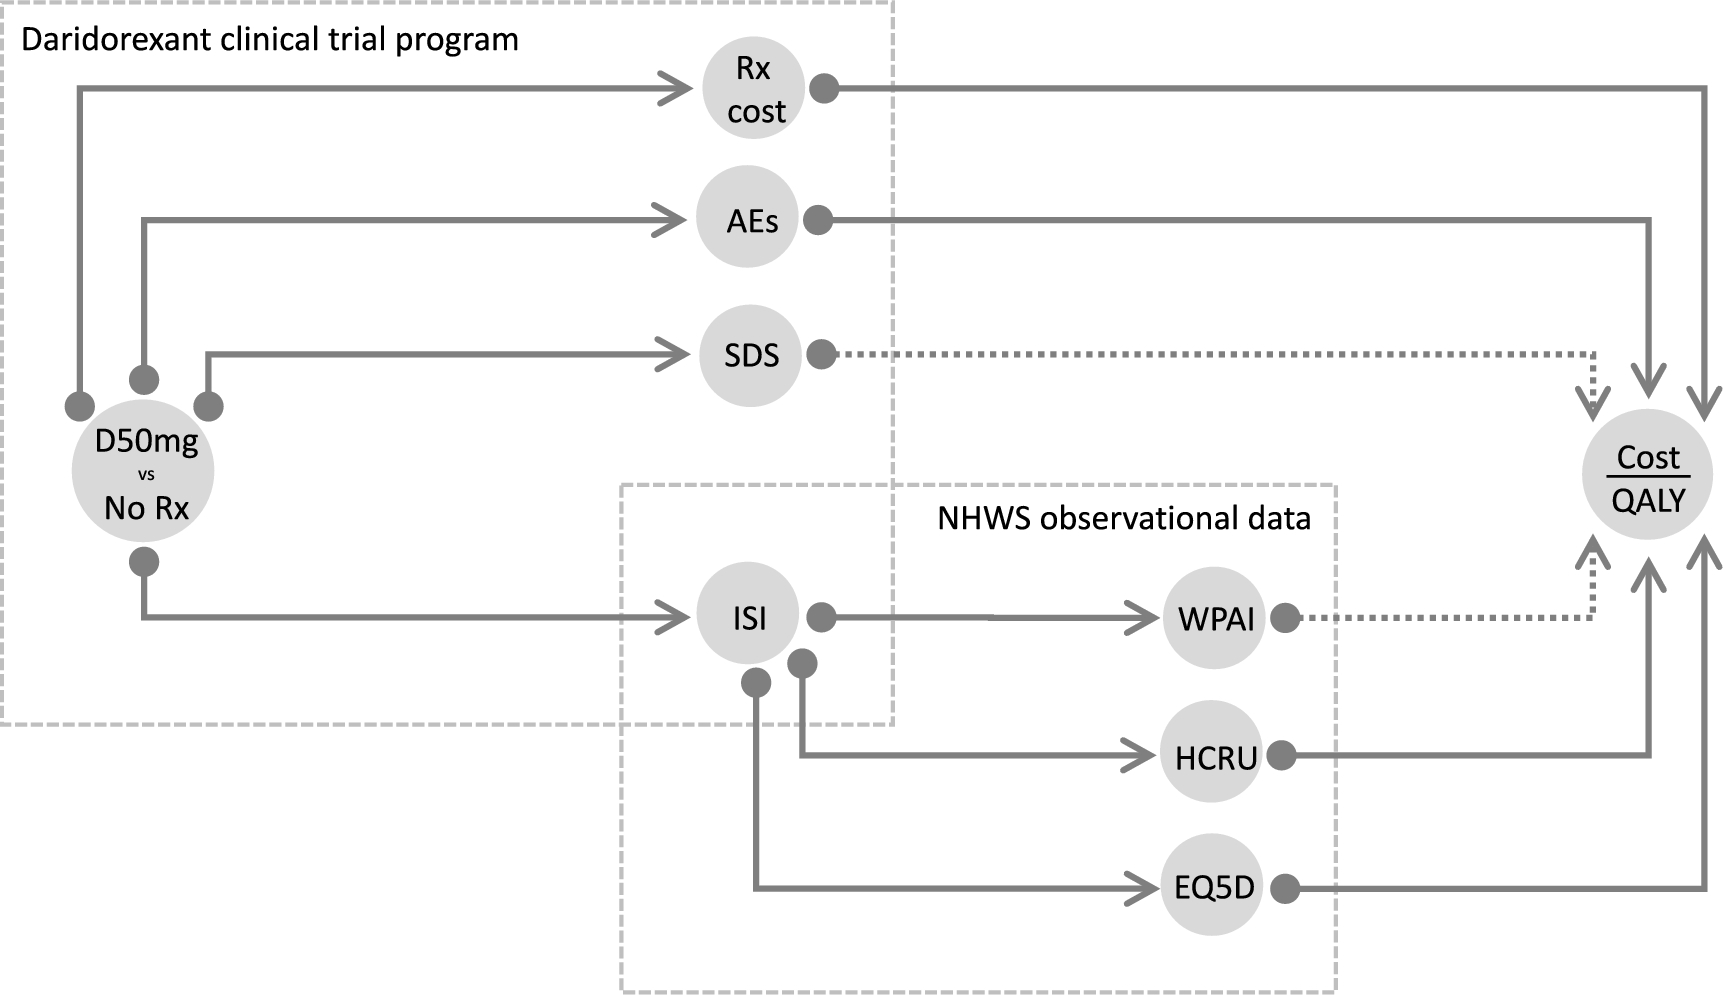
A previously published exploratory model that was developed in Microsoft Excel following NICE guidelines to assess the cost-effectiveness of a novel bioprosthetic valve in the UK compared with mechanical valves [17] was adapted to the Spanish healthcare landscape (Fig. 1). The model was built from a healthcare perspective. Given the chronic component of the pathology studied, a lifetime horizon was considered for the analysis. Costs were analyzed from the Spanish NHS perspective and included only direct medical costs. A discount rate of 3% per year was applied to account for future cost and effects. A detailed description of the model structure can be found in Supplementary Methods.
Fig. 1
Model structure. A Decision tree for short-term events. B Partitioned survival model for long-term recurrent events. NYHA, New York Heart Association
2.2 Model InputsA pragmatic literature review was conducted to extract clinical data suitable for the model. A detailed description of this review methodology can be found in Supplementary Methods and a list of relevant studies are included in Supplementary Tables S1 and S2.
2.2.1 Patient PopulationAll patients with AS eligible for SAVR entered the model. The starting age of the population was 55 or 65 years depending on the analysis and a hypothetical cohort of 1000 patients was evaluated per age group. The 65 years or older age group reflected the current guideline recommendations, while the 55–64 years age group addressed the therapeutic potential of the new valve in a younger population as an alternative to mechanical valves, which necessitate lifelong anticoagulation therapy. Life expectancy in the general population was adapted to the Spanish context [18].
2.2.2 MortalityParametric survival analyses based on previously published data were used to estimate mortality for each treatment, as described previously [17]. For mechanical valves, Kaplan–Meier curves available from two studies were used for the 55–64 years and 65 years or older age groups [19, 20]. According to Attia et al. [21], no differences in mortality between bioprosthetic and mechanical valves were considered in the base-case scenario. Moreover, it was assumed that the novel bioprosthetic valve would have the same mortality risk as other bioprosthetic valves; hence a hazard ratio (HR) of 1 was applied for both the novel bioprosthetic valve and the generic mechanical valve. Further, mortality was adjusted in the model to ensure it did not drop below the population numbers in Spain.
2.2.3 Adverse EventsThirty-day events applied for the decision tree are listed in Supplementary Table S3.
Longer term probabilities of thromboembolic events were estimated for each valve according to Kaplan–Meier curves from relevant studies. The number of thromboembolic events with the novel bioprosthetic valve was assumed to be equal to that reported for the Magna Ease valve [11, 22], considering there are little-to-no differences in 5-year outcomes between valves [14]. A HR of 0.78, favoring the bioprosthetic valve, was considered for both age groups, based on a propensity score-matched study in a population of 50–70 years [23]. Further, the model estimates the number of patients that eventually suffer a debilitating ischemic stroke as a proportion of those who have had a thromboembolic event. This proportion was assumed to be the same independently of the valve type (27.6% and 18.5% for 55–64 and ≥ 65 years groups, respectively) [11, 22]. A relative risk of dying due to stroke of 2.05 was applied on the basis of an average of the relative risk of death reported by Lobotesis et al. [24].
Reoperation and bleeding rates were extracted from studies relating to each valve type [11, 14, 19, 20, 22, 25, 26]. Annual rates were defined for 5-year intervals, up to 15 years post-intervention, with higher risk identified over time. From 15 years onwards, the rates remained constant for both valves owing to the absence of long-term data (Supplementary Table S4).
The risk of endocarditis is reported to be the same across valve types [27]. Long-term occurrence for this event was established at 0.75% per year and was assumed constant over time (Supplementary Table S4) [27]. The risk of requiring pacemaker implantation was only considered for the short term, although related complications were represented in the model as long-term events.
2.2.4 NYHA ClassesSpecific healthcare costs and utility scores were linked to different levels of heart failure symptoms (New York Heart Association [NYHA] classes), for patients in the functioning heart valve state. Due to lack of data regarding NYHA class beyond baseline, equal proportions were applied to both valves and were obtained from the COMMENCE trial for each year post-intervention up to 5 years [14]. Class distribution was assumed to remain constant beyond this period [28, 29] (Supplementary Table S5).
2.2.5 Costs and Resource UseCosts were collected from official Spanish sources where available, including the Minimum Basic Data Set (MBDS) [30], regional NHS prices, and health technology assessment (HTA) bodies, as well as the General Council of Pharmaceutical Colleges Drug Database BOTPLUS [31] (Table 1). The remaining costs were extracted from a literature review, in which Spanish-specific studies reporting costs, economic models, and healthcare resource use, published from 2010 until present were analyzed (Table 1). All costs were expressed in euros (as of 2023) or updated to euros (as of 2023) according to the consumer price index. Specific use of resources associated with patients with AS pre-, peri-, and post-SAVR in Spain was validated by clinical experts in the field.
Procedural costs were included in the model as micro-costs (Supplementary Table S6). The same preprocedural costs were assumed for both valve types and included consultations (cardiology, cardiac surgery, and anesthesia) and clinical tests. Periprocedural costs comprised the valve, complements, and materials costs, together with the operation room and medical staff. As with preprocedural costs, it was considered that there would not be any relevant variation in healthcare resource consumption related to the type of valve used, beyond the valves themselves that are priced differently. Postprocedural costs considered intensive care unit (ICU), and cardiac ward stay after SAVR. ICU stay was again assumed to be similar across valve types (average of 1 day [32,33,34]). However, based on the revised literature, there is reason to assume that mechanical valve recipients would require an extra day in hospital for international normalized ratio (INR) dosage regulation and follow-up [32,33,34,35,36]. Therefore, in the base-case analysis, it was considered that patients requiring a bioprosthetic valve would stay 1 day less in the cardiac ward (5.35 [35, 36] days versus 6.35 [32,33,34] days for mechanical valves). In a scenario analysis, two variations of this input were explored. One of the alternative scenarios assumed no differences in length of stay (LoS) in the cardiac ward [36, 37]; the other considered that patients with mechanical valves would stay in the cardiac ward 2 days longer than patients with the novel bioprosthetic valve. This was based on a study by Lopez-Marco et al. [35], which described that mechanical valve recipients stay 1 additional day in hospital, and a real world evidence study performed in the USA (n = 1124), which reported that patients with the novel bioprosthetic valve require 1 day less of hospital stay versus other bioprosthetic valves [38]. According to clinical experts in Spain, patients on mechanical valves may often require additional hospital stay for anticoagulation management and preparation. Procedure costs also comprised pacemaker implantation costs, which were assumed to be the the same for both valve types, and aspirin costs for the novel bioprosthetic valve. Weighted total costs of pacemaker implantation were calculated considering that 5.3% of patients would require this intervention, as reported in the COMMENCE trial [14].
On the basis of expert opinion, it was considered that all patients, regardless of valve type, were subject to follow-up consultation and echocardiogram tests (at 6 and 12 months) for their first year post-procedure, followed by similar yearly check-ups [5, 32].
Similarly, according to expert opinion and for modeling purposes it was assumed that all patients would receive a generic bioprosthetic valve in case a reoperation was needed, hence the same one-off cost per reoperation was applied for both valves. One-off costs associated with the remaining events were estimated on the basis of the corresponding diagnosis-related group (DRG) in the MBDS database [30] (Table 1). Recurrent monthly costs derived from disabling stroke and pacemaker implantation were extracted from the literature [39, 40] (Table 1).
Oral anticoagulation treatment is recommended by VHD guidelines after SAVR [5], with distinct time periods depending on the type of valve. Accordingly, 4.7% of novel bioprosthetic valve recipients were estimated to require anticoagulation (acenocoumarol) for the first 3 months post-procedure due to atrial fibrillation, and mechanical valve patients were assumed to require lifelong anticoagulation treatment, as stated by VHD guidelines [5]. Patients with novel bioprosthetic valves were treated with aspirin for 1 year if oral anticoagulation was not required for other reasons. Drug dosage and costs were obtained from the BOTPLUS database [31] (Table 1). Monthly care consultations (primary care and specialist) for INR management were included for patients with mechanical valves, according to experts.
Mechanical valve recipients are subject to a life-long risk of complications associated with anticoagulation. The probability of these events were extracted from an observational study on mechanical valves [35] and adapted to compensate for the 8.7% of patients with AS that were already on anticoagulation treatment due to atrial fibrillation, described by Glaser et al. [19]. Anticoagulation complication rates were defined as 1.8% of patients requiring re-admission and 7.3% requiring an average of 3.5 additional visits to the primary care center ward for INR check-up. Dosage adjustment and admission owing to subtherapeutic INR were only considered for patients receiving a mechanical valve that initiated treatment with anticoagulants.
Finally, costs and resource use associated with health states were defined in the model. Functioning heart valve costs were classified based on NYHA status, which comprised distinct medication and hospital requirements for each class. Spanish-specific costs by NYHA status were obtained from a previous study by Delgado et al. [41] (Table 1).
2.2.6 Health-Related Quality of LifeUtility values applied to baseline population were collected from a national survey on Spanish health-related quality of life in adults [42]. Utility decrements were captured for each NYHA class within the functioning heart valve state, as well as for the disabling stroke state and adverse events from the available literature, which did not report Spanish-specific data [43,44,45,46]. A utility decrement of 0.02 related to anticoagulation complications was applied [35] only during the first 3 months after the intervention [45], owing to limited data published for longer follow-up. Specific utility values were then calculated by subtracting each decrement from Spanish population norms. Utility model inputs are provided in Supplementary Table S7.
2.3 Economic AnalysisThe outcomes obtained from the cost-effectiveness analysis were incremental costs, incremental quality-adjusted life years (QALYs), incremental cost-effectiveness ratios (ICERs), and net monetary benefit (NMB). A detailed description of these measures can be found in Supplementary Methods. For NMB estimates, a willingness-to-pay threshold of €21,000/QALY was considered [47].
Deterministic and probabilistic sensitivity analyses (DSA and PSA, respectively) were further performed to test the robustness of the model. DSA was conducted to determine the impact of varying the value of individual parameters in the model and results were depicted as a tornado diagram. PSA was performed to evaluate the uncertainty in the model results, allowing quantification of the level of confidence. This uncertainty was collected for each input where available, otherwise assuming a 10% of standard error for each value. Distributions used in the PSA were: beta for probabilities, gamma for costs and utilities, and normal for mortality. PSA was run for 1000 iterations and the results were presented as a cost-effectiveness plane and acceptability curve.
In addition, several exploratory scenarios evaluated different assumptions regarding LoS in cardiac wards and variations in Spanish clinical practice for follow-up and anticoagulation monitoring.
Comments (0)