
Remember me
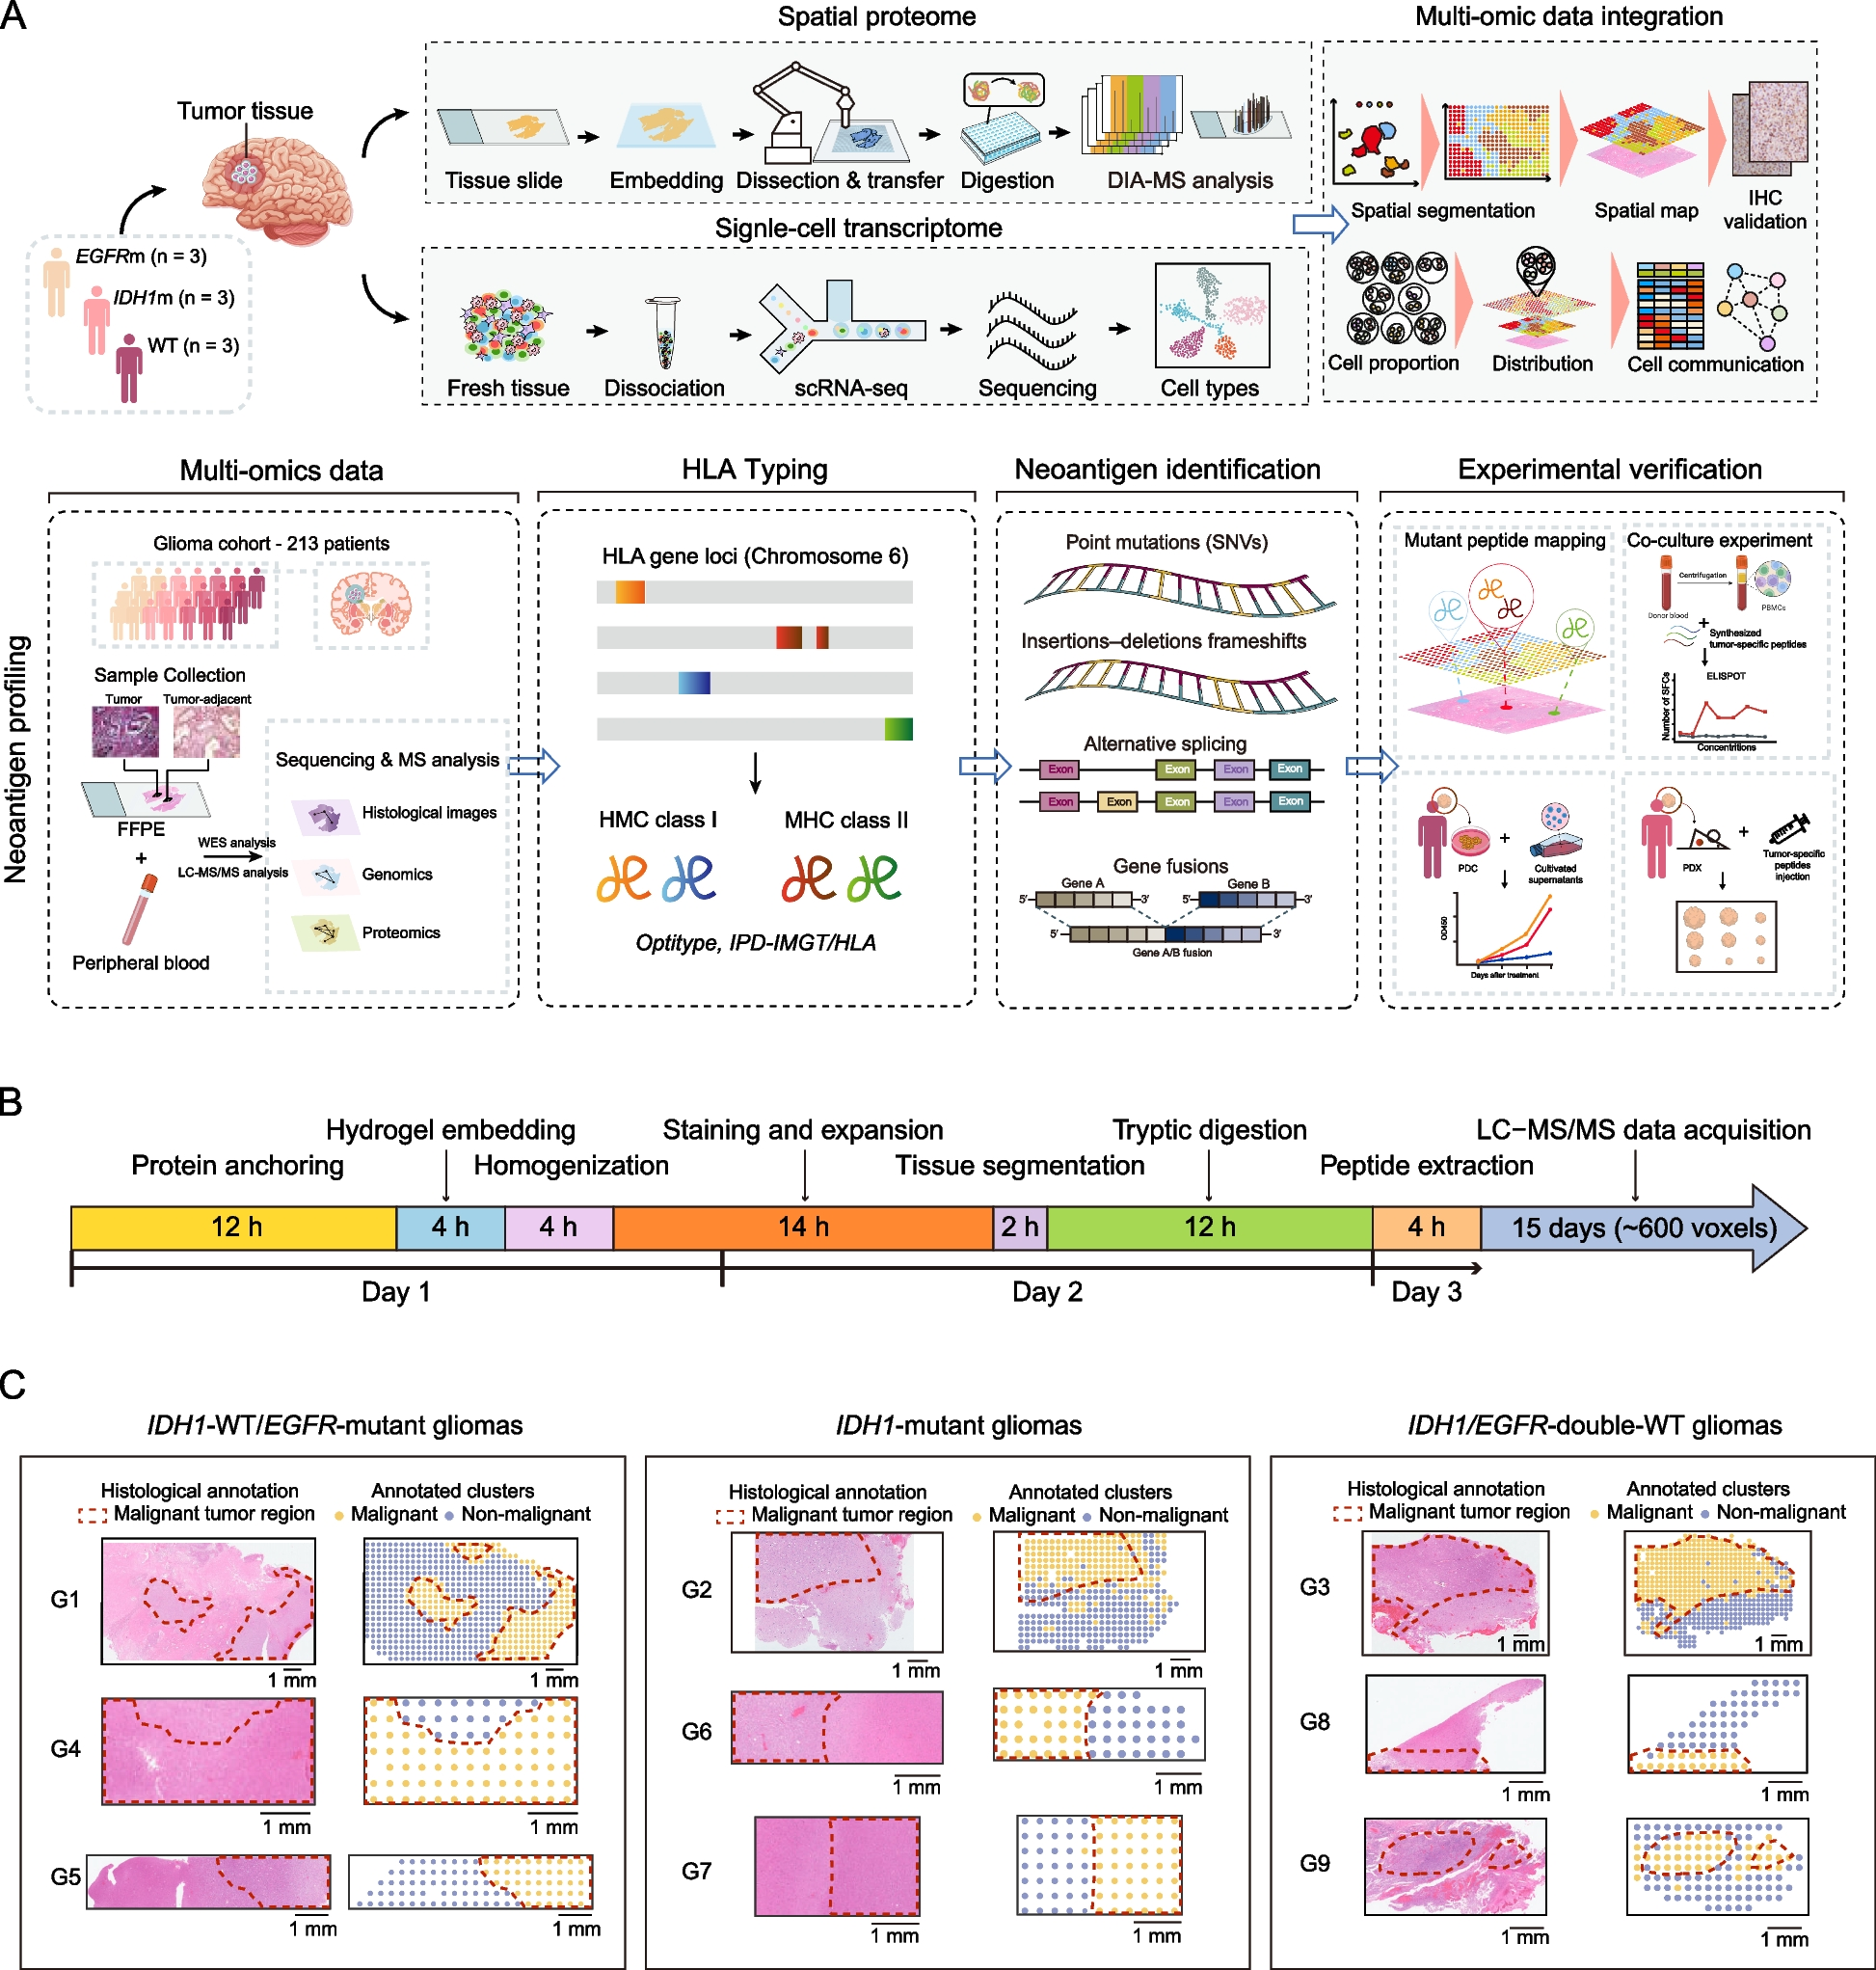


To achieve high-resolution spatially resolved proteomics in tissue samples, we developed the PSERP approach, comprising the following systematic steps (Fig. 1A and S1 A, Methods). In Step 1, we performed tissue expansion process, enabling the physical enlargement of the tissue while preserving protein localization (Methods). In Step 2, we employed the custom-designed 3D-printed cutting toolkit, allowing the expanded tissue to be precisely sectioned into thousands of “voxels” of defined dimensions (Figure S1B-D, Methods). In Step 3, these divided voxels were transferred into 96-well plates, with their spatial coordinates meticulously recorded to maintain positional context (Figure S1E, Methods). Step 4 involved in-gel digestion and peptide extraction from each voxel, preparing the samples for downstream analysis. Finally, in Step 5, the extracted peptides were subjected to high-throughput data-independent acquisition (DIA) liquid chromatography-tandem mass spectrometry (LC–MS/MS) for comprehensive spatial proteomic profiling, phosphoproteomic profiling, and neoantigen profiling (Fig. 1A, Methods). To facilitate a comprehensive understanding of the PSERP workflow, we have included a detailed timeline from tissue preparation to LC–MS/MS analysis in Fig. 1B. This approach was optimized for time efficiency, and the majority of the workflow can be automated on a robotic workstation (Figure S1 A, Methods).
Fig. 1
Overview of the panoramic spatial enhanced resolution proteomics (PSERP) workflow and its application. A A schematic representation of the PSERP workflow, encompassing the steps involved in neoantigen profiling. B Timeline illustrating the duration of each step in the PSERP process, from sample processing to LC–MS/MS data acquisition. C Hematoxylin and eosin (H&E) stained images and histological annotations of samples obtained from glioma patients. The samples include: G1, G4, and G5 (IDH1-WT/EGFR-mutant); G2, G6, and G7 (IDH1-mutant); G3, G8, and G9 (EGFR & IDH1 wild-type). The dotted line delineates the malignant tumor regions
The primary objective of this proof-of-principle study was to validate the capabilities of our PSERP-based spatial proteomics method to capture the spatial heterogeneity of tumors and their corresponding microenvironments. The mutual exclusivity and microenvironment diversities of EGFR- and IDH1-mutant gliomas are well-documented in previous studies [17]. EGFR mutations predominantly occur in IDH1-wildtype (WT) tumors. Thus, we focused on IDH1-mutant and two types of IDH1-wildtype (WT) gliomas: IDH1-WT/EGFR-mutant (G1, G4 and G5), IDH1-mutant (G2, G6 and G7), and IDH1/EGFR-double-WT (G3, G8 and G9) gliomas.
For this proof-of-principle study, we sampled sections from a total of nine samples (G1-G9), and processed them with PSERP procedures (Fig. 1C, Methods). The isolated voxels were then processed following the PSERP workflow and analyzed using the DIA strategy (Methods). A total of 12,190 proteins were identified across 2,230 voxels from all glioma samples. The median number of proteins identified was 1,650 and the standard deviation was 562 across samples. Herein, we obtained the panoramic spatial proteomic profiles with comprehensive coverage of whole sections of glioma samples.
The fidelity, quantification and reproducibility of PSERPIn this proof-of-principle study, we consistently applied a sixfold expansion factor across all samples, resulting in an isotropic increase in length, width, and height. This corresponded to a 216-fold (6 by 6 by 6) volumetric increase in the sample. To illustrate the changes in tissue size before and after expansion, we have provided representative images of the samples in their pre-expanded and post-expanded states (Figure S2 A). Additionally, we applied PSERP to consecutive replicate sections of glioma tissue, and provided the images of the corresponding replicate samples after expansion to show the consistency (Figure S2B). The replicate samples expanded uniformly by the same expansion factor, indicating a high degree of consistency between replicate samples before and after expansion. Furthermore, to validate the consistency of the expanded tissues, we performed isotropic distortion analysis to assess the expansion distortion. Specifically, the pre- and post-expanded tissue images were recorded using the Biorad imaging system (ChemiDoc, Biorad), a B-spline-based image registration MATLAB package was used to register post-PSERP to pre-PSERP image by landmark selection [15]. The root-mean-square (RMS) length measurement error of feature measurement was calculated to quantify the percentages of the distortion in the expanded tissue. In this way, we found that in our study, after tissue expansion over length scales up to 1,500 μm with the linear expansion factor of six fold, the average of feature RMS errors in our samples was 5% (Figure S2 C and S2D), demonstrating high fidelity in the preservation of tissue architecture.
All samples in our study were processed using the same protocol, ensuring comparability and reliability across different samples. To evaluate the reproducibility, we utilized two consecutive tissue slides from one sample block (G1 sample) for the replicate experiment. These two consecutive slides were named G1-R1 and G1-R2, respectively (Figure S3 A and S3B). We processed these two tissue slides following the same protocol, including gel embedding, expanding, cutting, transferring, peptide extraction, and MS detection steps. During transferring process, we recorded the (x,y) coordinates of all voxels for both G1-R1 and G1-R2 samples to map them back to their original positions of the tissue slide (Methods). Then, we specifically selected 12 voxels within the malignant regions and 15 voxels within the non-malignant regions of the G1 and G1 replicate samples, respectively. The corresponding voxels with the same (x,y) coordinates in G1-R1 and G1-R2 samples were utilized to assess the reproducibility between samples (Figure S3 A and S3B). We generated proteomic data from selected voxels in G1-R1 and G1-R2 samples for further analysis (Figure S3 C). For the G1-R1 sample, we identified an average of 1,440 proteins per voxel in the non-malignant region, and 1,722 proteins per voxel in the malignant region. For the G1-R2 sample, we identified an average of 1,518 proteins per voxel in the non-malignant region, and 1,729 proteins per voxel in the malignant region. Additionally, 93% of the proteins identified in the non-malignant voxels of G1-R1 were consistently identified in their corresponding replicates of G1-R2, while 97% of proteins overlapped between malignant voxels. This substantial overlap supported the reproducibility of our method. We observed high correlation coefficients (R > 0.92) between corresponding voxels in G1-R1 and G1-R2 samples in both the malignant region and non-malignant region (Figure S3D). Clustering analysis revealed a clear distinction between voxels from malignant and non-malignant regions (Figure S3E). This finding indicated that the differential proteomic patterns were consistently preserved in both G1-R1 and G1-R2 samples.
Additionally, the evaluation of protein diffusion between voxels was necessary for assessing the reliability of the method. In light of this, we assessed protein diffusion by sampling a homogeneous glioma tissue. After the same processing protocol mentioned above, we collected proteomic data from voxels containing the tissue sample and adjacent blank gel voxels without any tissue. Then, we compared the results between the tissue gel voxels and the adjacent blank gel voxels. The results showed that an average of 2,641 proteins were identified in tissue gel voxels (n = 10), while only an average of 57 proteins were identified in blank gel voxels (n = 10) (Figure S3 F). We observed that marker proteins, such as GFAP, EGFR, VIM, and PARP1, were significantly more abundant in glioma tissue voxels, while they were barely detectable in the blank gel voxels (Figure S3G). Although several proteins were identified in both blank gel voxels and tissue voxels, the abundance of proteins identified in blank voxels was significantly lower than that in tissue voxels (lower than 1%) (Figure S3H). These results further suggested that protein diffusion between voxels was nearly negligible. Moreover, voxels with fewer than 500 identified proteins were excluded from further analysis in our study (Methods).
Collectively, by utilizing the PSERP procedure, we could obtain the panoramic spatial proteomic profiles covering whole pathological sections with deep coverage and high quantitative reproducibility, accurately illustrating the diverse proteomic features of malignant and nonmalignant regions within one tumor section.
Spatial proteomic profiling of malignant and non-malignant regions in gliomaTo assess whether the PSERP method could capture spatial heterogeneity, we first conducted an unsupervised Louvain clustering analysis using the spatial proteomic data from the IDH1-WT/EGFR-mutant G1 sample (Methods). The results revealed six Louvain clusters among all voxels (Fig. 2A). These six clusters could be further partitioned into two major groups by applying hierarchical clustering (Fig. 2B and C). The principal component analysis (PCA) revealed clear separation between the malignant and non-malignant clusters (Fig. 2D). To explore the relationship between the clusters and the glioma sample’s spatial information, we mapped the clusters to their original tissue positions (Fig. 2E). Interestingly, when combined with H&E staining, the clusters corresponded precisely to the malignant and non-malignant regions of the sample. Specifically, cluster 2 (C2) and cluster 3 (C3) were identified as malignant clusters, while cluster 0 (C0), cluster 1 (C1), cluster 4 (C4), and cluster 5 (C5) were designated as non-malignant clusters (Fig. 2E). These results demonstrated the capability of identifying distinct spatial regions within a single sample section based solely on the spatial proteome.
Fig. 2
Spatial proteomic dissection of malignant and non-malignant regions in IDH1-WT/EGFR-mutant gliomas using PSERP. A Uniform Manifold Approximation and Projection (UMAP) plots of spatial spots from the IDH1-WT/EGFR-mutant G1 sample, colored according to their Louvain clustering identities. B Phylogenetic tree illustrating proteomic similarities across clusters in the IDH1-WT/EGFR-mutant G1 sample. C UMAP plots of spots from the IDH1-WT/EGFR-mutant G1 sample, with colors representing malignant and non-malignant regions based on histological annotations. D Principal Component Analysis (PCA) plot comparing the proteomic profiles of malignant and non-malignant spots from the IDH1-WT/EGFR-mutant G1 sample. E H&E staining (left), spatial cluster distribution (middle), and spatial annotations of malignant versus non-malignant regions (right) for the IDH1-WT/EGFR-mutant G1 sample. F Volcano plot depicting differentially expressed proteins between malignant and non-malignant clusters from the IDH1-WT/EGFR-mutant G1 sample (FDR < 0.05). G Bar plots showing the enrichment pathways of upregulated proteins (FDR < 0.05, Log2 FC > 1.5) in malignant (left) and non-malignant (right) clusters from the IDH1-WT/EGFR-mutant G1 sample. H Heatmaps illustrating the spatial distribution of differentially expressed proteins between malignant and non-malignant regions in the IDH1-WT/EGFR-mutant G1 sample
Further comparative analysis and enrichment analysis revealed that upregulated proteins in malignant clusters were enriched in cancer hallmark pathways, including MYC targets, MTORC1 signaling, E2 F targets, and mitotic spindle pathways (Fig. 2F-G, Table S1). In contrast, proteins upregulated in non-malignant clusters were enriched in coagulation, adipogenesis, and metabolism pathways (Fig. 2F-G, Table S1). In addition, spatial differential expression analysis revealed that glioma malignancy-related proteins, such as VIM, GFAP, PARP1 and EGFR, were significantly upregulated in the malignant regions. Conversely, immune-associated proteins, such as C1QB, and adipogenesis-associated proteins, such as APOA2, APOA4, and APOC2, were significantly upregulated in the non-malignant regions of the IDH1-WT/EGFR-mutant sample (Fig. 2H). Moreover, comparative and enrichment analyses validated the reproducibility of spatial expression profiles between corresponding voxels in G1-R1 and G1-R2 samples (Figure S3I and S3 J; Table S1). Specifically, proteins upregulated in the malignant region of replicates showed enrichment in the Myc target V1 and G2M checkpoint pathways (Figure S3 J). In contrast, proteins upregulated in the non-malignant region showed enrichment in coagulation and complement pathways (Figure S3 J). These findings demonstrated that the differential expression of proteins and pathways observed in the IDH1-WT/EGFR-mutant G1 sample was consistent and reproducible across replicates. Overall, the strong quantitative reproducibility across replicates underscored the robustness and reliability of our PSERP approach.
To minimize the impact of interpatient heterogeneity on the diverse proteomic features of malignant and non-malignant regions identified by PSERP, we further analyzed the differences between malignant and non-malignant regions in three IDH1-WT/EGFR-mutant samples (G1, G4 and G5). The results of enrichment analysis and differentially expressed proteins were consistent across three distinct IDH1-WT/EGFR-mutant samples (Figure S4 A-B). We also performed paired comparisons between malignant and non-malignant clusters across the three IDH1-WT/EGFR-mutant samples (G1, G4, and G5 samples). As a result, the expression levels of tumor-related pathways, such as Myc targets, E2 F targets, and mitotic spindle, were increased in the malignant regions, while the expression levels of immune or metabolism-related pathways, such as coagulation, inflammatory response, and adipogenesis pathways, were increased in the non-malignant regions (Figure S4 C), indicating a consistent pattern of pathway alterations between malignant and non-malignant regions. The consistency of these findings across distinct IDH1-WT/EGFR-mutant samples highlighted the robustness of our PSERP method in capturing tumor heterogeneity, and further supporting the reproducibility of spatial proteomic variations in IDH1-WT/EGFR-mutant gliomas.
High-resolution spatial proteomic heterogeneities in different regions of gliomasTo evaluate whether our PSERP approach could comprehensively characterize the molecular diversity of distinct tumor regions at high resolution, we conducted a comparative analysis of the six clusters in the IDH1-WT/EGFR-mutant G1 sample (C0-C5) and performed pathway enrichment analysis on proteins that exhibited differential expression patterns within each cluster (Fig. 3A-3E and S5 A-C, Methods). The results revealed that immune-related pathways were significantly enriched in cluster C0, heme metabolism pathways were enriched in cluster C1, and clusters C2 and C3 exhibited similar patterns of pathway enrichment, primarily involving the G2M checkpoint and mRNA metabolic process pathways (Fig. 3B). Clusters C4 and C5 displayed enrichment in complement and coagulation cascades, complement activation pathways, and other related pathways (Fig. 3B).
Fig. 3
Spatially resolved proteomic profiling of gliomas reveals intra-tumor heterogeneity. A H&E staining images and spatial proteomic cluster distribution in the IDH1-WT/EGFR-mutant G1 sample (left panel; scale bar, 1 mm). The details of each regions in the IDH1-WT/EGFR-mutant G1 sample (right panel; scale bar, 100 μm). B Dot plots illustrating the enrichment of pathways associated with significantly upregulated proteins across six spatial clusters in the IDH1-WT/EGFR-mutant G1 sample. C Heatmaps and boxplots illustrating significantly upregulated pathways in non-malignant clusters (C0, C1, C4, and C5) compared to malignant clusters (C2 and C3) in the IDH1-WT/EGFR-mutant G1 sample (adjusted p value < 0.05). D Heatmaps and boxplots showing significantly upregulated pathways in cluster C2 compared to cluster C3 in the IDH1-WT/EGFR-mutant G1 sample (adjusted p value < 0.05). E Heatmaps and boxplots showing significantly downregulated pathways in cluster C2 compared to cluster C3 in the IDH1-WT/EGFR-mutant G1 sample (adjusted p value < 0.05). F Heatmap demonstrating differentially expressed proteins related to key pathways between clusters C2 and C3 of the IDH1-WT/EGFR-mutant G1 sample (FDR < 0.05). G Heatmaps and boxplots illustrating significant differences in the immune score, immune cell types, and stromal score between clusters C3 and C2 in the IDH1-WT/EGFR-mutant G1 sample (FDR < 0.05)
Importantly, by integrating pathological information from H&E images, we found that the spatial distributions of the six clusters exhibited significant diversity: clusters C2 and C3 were enriched in malignant regions, whereas clusters C0, C1, C4 and C5 were enriched in the non-malignant regions (Fig. 3A). Consistent with their regional distributions, we observed that more tumor-related pathways were significantly upregulated in malignant regions (clusters C2 and C3) than in non-malignant regions (clusters C0, C1, C4, and C5), whereas the tumor microenvironment and immune-related pathways were significantly upregulated in non-malignant regions (clusters C0, C1, C4, and C5) (Fig. 3B, C and S5 A).
Although both clusters C2 and C3 were enriched in malignant tumor tissue regions, their separation into two distinct clusters suggested molecular heterogeneity between spatially different malignant tumor regions within the same sample. To further explore the heterogeneity between clusters C2 and C3, we compared the pathway ssGSEA scores of spots within these clusters to identify differentially enriched pathways (Figure S5B, Methods). The analysis revealed that Myc targets and G2M checkpoint pathways were significantly upregulated in cluster C2 (Fig. 3D), suggesting enhanced tumor cell proliferation in this cluster. This was further confirmed by the elevated multi-gene proliferation score (MGPS) in cluster C2 (Fig. 3D and F). In contrast, cluster C3 exhibited elevated expression of proteins involved in fatty acid metabolism, the interferon alpha response, and antigen processing and presentation pathways was detected (Fig. 3E and F). This result was consistent with the higher immune score and increased scores of immune cell types in cluster C3 (Fig. 3G, Methods). In parallel with the results of ssGSEA analysis, the upregulation of cell proliferation-associated molecules such as MRTOR4, CDK6, MCM5, MCM6, and AURKB was observed in cluster C2, while proteins related to fatty acid degradation (HADH, ACADVL, and ACAT2), the tricarboxylic acid (TCA) cycle (LDHA, PDHB, and ACO2), the interferon alpha response (PSMB8/9, PSME1/2, and STAT2), and antigen presentation (HLA-DQA1, DRA, and DRB1) were significantly upregulated in cluster C3 compared to those in cluster C2 (Fig. 3F, Methods). These results confirmed the spatial heterogeneity of glioma tumor regions, suggesting that cluster C2 might have a stronger proliferative capacity, whereas cluster C3 exhibited a more pronounced tumor immune response.
In summary, our findings revealed glioma spatial heterogeneity through PSERP. By integrating the H&E pathology slides, we observed distinct histological characteristics within different clusters. The analysis of significantly upregulated proteins and pathway enrichment allowed us to identify molecular features associated with each cluster. Notably, the differences observed in the malignant and non-malignant regions on the H&E images and the pathway enrichment patterns among clusters were highly consistent. Furthermore, the heterogeneity between the two malignant tumor clusters, C2 and C3, was characterized by differences in proliferation- and immune-related pathways, suggesting the presence of distinct molecular subtypes within spatially distinct malignant tumor regions. These findings provided valuable insights into the spatial complexity and molecular characteristics of glioma, and contributed to a deeper understanding of this heterogeneous disease.
Characterization of Tumor Border Characteristics and Interactions with the Tumor Microenvironment Using Spatial ProteomicsAdditionally, to illustrate the diverse proteomic features along the malignant-border-nonmalignant axis in the glioma sample, our high-resolution PSERP approach enabled a more precise exploration of unique protein expression patterns and microenvironmental features relative to the borders between malignant and non-malignant tumor regions. Based on the tumor borders identified by pathologists using the H&E-stained image of the IDH1-WT/EGFR-mutant sample, we divided all the voxels of the IDH1-WT/EGFR-mutant sample into three groups: tumor center, border, and paratumor (Fig. 4A, Methods). To assess the alignment between pathological-annotated tumor boundaries and those defined by PSERP data, we also applied Cottrazm (Construction of Tumor Transition Zone Microenvironment) [18] using the spatial proteomic data to further delineate the malignant region, tumor border, and non-malignant region of the IDH1-WT/EGFR-mutant sample (Figure S5 C and S5D, Methods). We then compared the tumor border identified through H&E histological annotation with the border determined by Cottrazm. The results demonstrated a high degree of consistency between the tumor borders predicted by Cottrazm and those annotated by pathology (Figure S5E and S5 F). To understand the proteomic feature related to the tumor core spots, we calculated pathway enrichment scores based on spatial proteomic data of the IDH1-WT/EGFR-mutant G1 sample, and assessed their correlations with inferred copy number variation (CNV) scores. The results indicated that the hypoxia signaling pathway was the most significant correlated with inferred CNV scores (p-value = 1.6e-7, Figure S5G). Consistently, the hypoxia pathway scores increased at the tumor core within the Cottrazm-identified malignant regions and gradually decreased with the increasing distance from the tumor core (Figure S5H).
Fig. 4
The spatial characteristics along the tumor border. A Strategy to quantify the Euclidean distance of spatial spots from the malignant tumor border. The red line delineates the malignant tumor border. B Heatmap illustrating the distance of each spot from the malignant tumor border. C Line graphs depicting distinct groups of proteins, clustered by Mfuzz, to show relative expression changes across the spatial proteomic landscape. D Enrichment analysis results of proteins within each Mfuzz cluster. E Variation in G2M checkpoint pathway scores of spatial spots with respect to the distance from the tumor region to the para-tumor region. F Variation in immune scores of spatial spots with respect to the distance from the tumor region to the para-tumor region. G Heatmap demonstrating the expression level changes of representative proteins significantly correlated with distance from the tumor border
These findings prompted us to then compute the Euclidean distances from tumor and paratumor spots to border spots (Fig. 5A and B, Methods). We then applied the Mfuzz algorithm [19] to identify different proteomic expression patterns associated with the distance from the border, and to explore potential crosstalk among the tumor, border and paratumor regions (Methods). This analysis revealed six distinct protein groups representing diverse distances from the border (Fig. 4C). Among these groups, group 2 represented proteins displaying specific higher expression levels at the tumor center region, and proteins enriched in group 4 exhibited the highest expression within the closest proximity to the border, implying that proteins in this group represent molecular features of tumor border regions. We subsequently performed gene set enrichment analysis (GSEA) on the proteins categorized within each group to characterize the proteomic features of the tumor center and tumor border (Fig. 4D). Specifically, proteins in group 2 were associated with cell cycle features, consistent with the elevated expression of G2M checkpoint pathway (Fig. 4E and G). In contrast, group 4 showed enrichment of proteins involved in coagulation, innate immune system and complement cascade pathways, suggesting a prominent role for immune-related processes in shaping expression dynamics at the tumor border (Fig. 4F and G). Based on these findings, we investigated immune cell infiltration in the IDH1-WT/EGFR-mutant sample using the xCell deconvolution algorithm (Methods). The results revealed a gradient of immune scores across the malignant and non-malignant regions of the tumor (Fig. 4F). As the distance from the border increased, the immune scores gradually decreased (Fig. 4F), suggesting the regulatory mechanisms in the border region contribute to an activated immune response. Furthermore, our analysis revealed that the expression levels of immune-related proteins such as C1QB, C3, IGHG1, IGLC2, F2, FGA, and FGB were upregulated with the increasing distance from the tumor region (Fig. 4G). These spatially dependent alterations in protein expression were shown on the spatial proteomic map of the IDH1-WT/EGFR-mutant sample (Figure S5 J).
Fig. 5
Spatial heterogeneities across glioma tissues with distinct mutations (IDH1-WT/EGFR-mutant, IDH1-mutant, and IDH1/EGFR-double-WT). A H&E staining images, and proteomic cluster maps in different samples from glioma samples with distinct mutations: G1(IDH1-WT/EGFR-mutant), G2 (IDH1-mutant), and G3 (IDH1/EGFR-double-WT) samples. B Significantly upregulated marker proteins in the malignant regions compared to non-malignant regions for each sample (FDR < 0.05). C Boxplots and heatmaps showing ssGSEA scores of pathways upregulated in the malignant regions compared to non-malignant regions of the IDH1-mutant G2 sample. D Boxplots and heatmaps showing ssGSEA scores of pathways upregulated in the malignant regions compared to non-malignant regions of the IDH1/EGFR-double-WT G3 sample. E Heatmaps depicting significantly upregulated proteins in the malignant regions c non-malignant regions in the IDH1-mutant G2 sample (FDR < 0.05). F Heatmaps showing significantly upregulated proteins in the malignant region comparedompared to non-malignant regions in the IDH1/EGFR-double-WT G3 sample (FDR < 0.05). G Heatmaps and boxplots illustrating significantly downregulated xCell scores for immune cell types in the malignant regions compared to non-malignant regions of the IDH1-mutant G2 sample. H Heatmaps and boxplots illustrating significantly upregulated xCell scores for immune cell types in the malignant region compared to non-malignant regions of the IDH1/EGFR-double-WT G3 sample
High-resolution spatial proteomic heterogeneities revealed intra- and inter-tumor heterogeneity in gliomaTo evaluate whether our PSERP approach could robustly reflect the diverse spatial proteomic heterogeneity of different samples, we conducted spatial proteomic profiling of glioma samples with distinct mutational statuses (IDH1-WT/EGFR-mutant, IDH1-mutant, and IDH1/EGFR-double-WT gliomas). We performed unsupervised Louvain clustering analysis for the IDH1-mutant G2 sample and EGFR & IDH1-WT G3 sample utilizing the same method as we used for the EGFR-mutant G1 sample (Methods). This analysis resulted in 7 clusters (G2 C0 to G2 C6) across 405 voxels of the IDH1-mutant G2 sample, and 6 clusters (G3 C0 to G3 C5) across 630 voxels of the IDH1/EGFR-double-WT G3 sample (Fig. 5A). Using the H&E image-based histological annotations of the G1, G2 and G3 samples, we found that in the IDH1-WT/EGFR-mutant G1 sample, clusters G1 C2 and G1 C3 were enriched in malignant regions. In the IDH1-mutant G2 sample, clusters G2 C1 and G2 C3 were enriched in malignant regions. In the IDH1/EGFR-double-WT G3 sample, clusters G3 C0, G3 C1, G3 C4, and G3 C5 were enriched in the malignant regions (Fig. 5A). These results indicated that the assigned clusters of the G1, G2, and G3 samples reflected the spatial diversity between malignant and non-malignant regions of gliomas. Previous proteogenomic studies have demonstrated that genomic alterations can influence downstream protein expression. For instance, IDH1 mutations can upregulate proteins related to the hypoxia and glutamate metabolism pathways [20, 21]. In parallel, mutations in EGFR can increase the expression of its cognate protein and proteins genes involved in the TCA cycle [22]. To explore the spatial distributions reflecting the distinctive or common proteomic features of gliomas with different mutational statuses, we examined the spatial expression patterns of proteins known to be altered, such as GFAP, EGFR, PARP1, and GLUD1 [23,24,25,26], among IDH1-WT/EGFR-mutant, IDH1-mutant and IDH1/EGFR-double-WT samples. Specifically, we observed significant upregulation of key proteins in the malignant regions across distinct samples (Fig. 5B), which could reflect the underlying mutation statuses and the tumor’s biological characteristics. A significant upregulation of EGFR was detected in the malignant regions of IDH1-WT/EGFR-mutant samples (G1, G4, and G5), consistent with the well-established role of EGFR mutations in glioma pathogenesis [27] (Fig. 5B and Figure S6 A). In IDH1-mutant gliomas (G2, G6, and G7), we observed a significant upregulation of GLUD1 in the malignant regions (Fig. 5B and Figure S6B). GLUD1, a key enzyme in the glutamate-glutamine cycle, plays a crucial role in maintaining cellular metabolic homeostasis. Its upregulation in IDH1-mutant gliomas suggested a compensatory mechanism to maintain metabolic flux, further supporting the metabolic reprogramming in these tumors [28, 29]. PARP1, a DNA repair enzyme involved in repairing single-strand DNA breaks, was significantly upregulated in the malignant regions of both IDH1-WT/EGFR-mutant gliomas (G1, G4, and G5) and IDH1/EGFR-double-WT gliomas (G3, G8, and G9) (Fig. 5B, Figure S6 A and Figure S6 C). The enhanced expression of PARP1 in these regions reflected the increased DNA damage and the reliance of tumor cells on DNA repair mechanisms to sustain their uncontrolled proliferation and survival [30]. These findings suggested a possible vulnerability in these gliomas, which could be targeted for therapeutic intervention. Additionally, GFAP, a key protein of astrocytic differentiation [31], was upregulated in the malignant regions of all three glioma mutation statuses, including IDH1-WT/EGFR-mutant, IDH1-mutant, and IDH1/EGFR-double-WT gliomas (Fig. 5B and Figure S6 A -S6 C). The increase in GFAP expression across all mutation statuses indicated its importance as a general marker of malignancy in gliomas, regardless of their mutational profiles. The upregulation of key proteins, such as EGFR, GLUD1, PARP1, and GFAP reflected critical aspects of glioma progression and tumor malignancy, including cell proliferation, metabolic reprogramming, DNA repair, and reactive gliosis.
In addition, we conducted pathway enrichment analysis to more comprehensively depict inter-tumor heterogeneity across gliomas with different mutations (Table S4). We compared the differential expression of proteins between the malignant and non-malignant regions of the glioma samples characterized by distinct mutational profile. Specifically, we found that oxidative stress-induced senescence and glutathione catabolic process pathways were upregulated in the malignant regions of the IDH1-mutant samples (G2, G6, and G7) (Fig. 5C and Figure S7 A-B). In contrast, coagulation, interferon α response, and interferon γ response pathways were upregulated in the malignant regions of the IDH1/EGFR-double-WT samples (G3, G8, and G9) (Fig. 5D and Figure S7 C-D). Consistently, the expression levels of proteins, such as H2BC5, H2BC1, MINK1, H2 AC4, MAPK8, H2 AX, and CEACAM8, were significantly higher in the malignant regions compared with the non-malignant regions of the IDH1-mutant samples (G2, G6, and G7) (Fig. 5E and Figure S7E). Immune-related proteins, including CD9, ANXA1, C3, C9, HLA-A, HLA-B and HLA-C, were upregulated in the malignant regions of IDH1/EGFR-double-WT samples (G3, G8, and G9) (Fig. 5F and Figure S7 F). Furthermore, the xCell deconvolution results (Methods) revealed that the spatial distribution of immune cells between the non-malignant and malignant regions was distinct in IDH1/EGFR-double-WT samples compared to IDH1-mutant samples. Specifically, immune cells, including M2 macrophages, cDC, iDC, and CD8 + T effector memory cells, were significantly upregulated in the malignant regions of IDH1/EGFR-double-WT samples (G3, G8 and G9) (Fig. 5G and Figure S8 A). In contrast, the immune score and scores for immune cells, including B cell and plasma cells, were significantly downregulated in the malignant regions of the IDH1-mutant samples (G2, G6 and G7) (Fig. 5H and Figure S8B), consistent with the inhibitory effect of IDH1 mutations on immune infiltration [32].
Given that PSERP approach can capture the proteomic characteristics of whole tissue sections without bias, we systematically compared the molecular features of both malignant and non-malignant regions in glioma samples with different genomic mutations. These results demonstrated that our PSERP approach accurately reflected the distinctive features of both intra- and inter-tumor heterogeneity in glioma samples. This approach also enabled us to analyze how different mutations influence the tumor and its surrounding microenvironment.
Spatial phosphoproteomic profiling of gliomas revealed spatial heterogeneity of kinase-substrate signal transductionBesides elucidating the spatial proteomic features, our PSERP can also portray the spatial distributions of phosphoproteomic features (Methods). Specifically, based on phosphoproteomic data from our previously published article [17], we built a phospho-spectral library using the FragPipe computational platform [33]. The raw DIA data generated in our research by PSERP were then searched against the phospho-spectral library. The results revealed an average of 1,177 phosphosites in the IDH1-WT/EGFR-mutant sample, 1,447 phosphosites in the IDH1-mutant sample, and 1,310 phosphosites in the IDH1/EGFR-double-WT sample (Figure S8 C-S8H). Intriguingly, compared to the non-malignant regions, more phosphosites were identified in the malignant regions (Figure S8 C-S8H).
To illustrate the most active kinases in the malignant regions among the three glioma samples, we conducted the KSEA analysis. The results revealed that, in the sample with EGFR mutation, the most significantly activated kinase in malignant regions was MAPK7 (Figure S8I and S8 J). Previously, we demonstrated that MAPK7 could promote IDH1-WT/EGFR-mutant gliomas’ tumor growth through phosphorylating enzymes (PRPS1, PRPS2) that catalyzed the phosphoribosylation of ribose 5-phosphate to 5-phosphoribosyl-1-pyrophosphate [17]. We then evaluated the spatial distribution of phospho-substrates of MAPK7 and observed that phospho-substrates of MAPK7, including PRPS1_T255 and PRPS2_S41, which were involved in the nucleotide metabolism pathway, showed consistent expression patterns with the kinase activity of MAPK7 (Figure S8 K and S8L).
Intriguingly, apart from MAPK7, CDK2 was also observed to be activated in the malignant regions of the IDH1-WT/EGFR-mutant sample. Importantly, we found that although both MAPK7 and CDK2 were activated in the malignant regions, they exhibited spatial heterogeneity in kinase activity and protein expression. Specifically, CDK2 was activated in the center of malignant regions, while MAPK7 was activated in the peritumoral regions. Along with these findings, the phospho-substrates of CDK2, including XRCC6_T455 and CDK7_T170, showed enhanced expression in the malignant regions, specifically in the tumor centroid of IDH1-WT/EGFR-mutant sample (Figure S8M and S8 N). Furthermore, the pathway enrichment analysis indicated that the tumor center exhibited heightened activity in CDK-related G2M cell cycle pathways, while the boundary regions showed increased activation of EGFR-MAPK-related pathways (Figure S8O and S8P).
For the sample with IDH1 mutation, the GSK3B kinase showed enhanced activity in the malignant regions compared to the non-malignant regions. Accordingly, the spatial kinase activity of GSK3B was also observed to show elevation in the malignant regions (Figure S9 A and S9B). To elucidate the phospho-signaling pathways activated by GSK3B, we investigated the spatial expression of its phospho-substrates. As a result, the phospho-substrate that presented the most significant consistent spatial expression patterns with GSK3B was HIF-1A_T554 (Figure S9 C). Consistently, the hypoxia pathway was also observed to be activated in the malignant regions of the IDH1 mutant sample at the spatial proteomic level (Figure S9D). Thus, spatial phosphoproteomic data generated by PSERP revealed a mechanism through which the activation of the GSK3B-HIF-1 A phosphorylation signaling pathway could lead to the hypoxia features in the malignant regions of the IDH1-mutant sample.
For the IDH1/EGFR-double-WT sample, we observed that the most significantly activated kinase in the malignant regions was PDGFRA (Figure S9E and S9 F). The activity of PDGFRA was also elevated in the malignant regions of the sample (Figure S9 F). Intriguingly, the phospho-substrates of PDGFRA, such as MUC1_Y1218 and ABL2_Y272, exhibited spatial expression patterns consistent with that of PDGFRA, and were enriched in the angiogenesis pathway (Figure S9G and S9H). Additionally, by calculating the micro-vessel density (MVD) score, we observed significantly higher MVD score in the malignant regions of the IDH1/EGFR-double-WT sample compared to the malignant regions of the IDH1-WT/EGFR-mutant and IDH1-mutant samples (Figure S9I), further confirming the angiogenesis characteristics of the malignant regions in the IDH1/EGFR-double-WT sample. In conclusion, our data revealed the concordance between spatial phosphoproteomic data and proteomic data in portraying the specific features of diverse tumor regions. These results underscored the ability of our PSERP method to systematically elucidate the spatial heterogeneity of tumors.
Profiling of the glioma ecosystem reveals region-specific cellular composition and cell‒cell communicationsPrevious single-cell transcriptomic studies of gliomas have provided insight into the intra-tumoral heterogeneity and dynamic cellular plasticity in gliomas [34,
Comments (0)