
Remember me
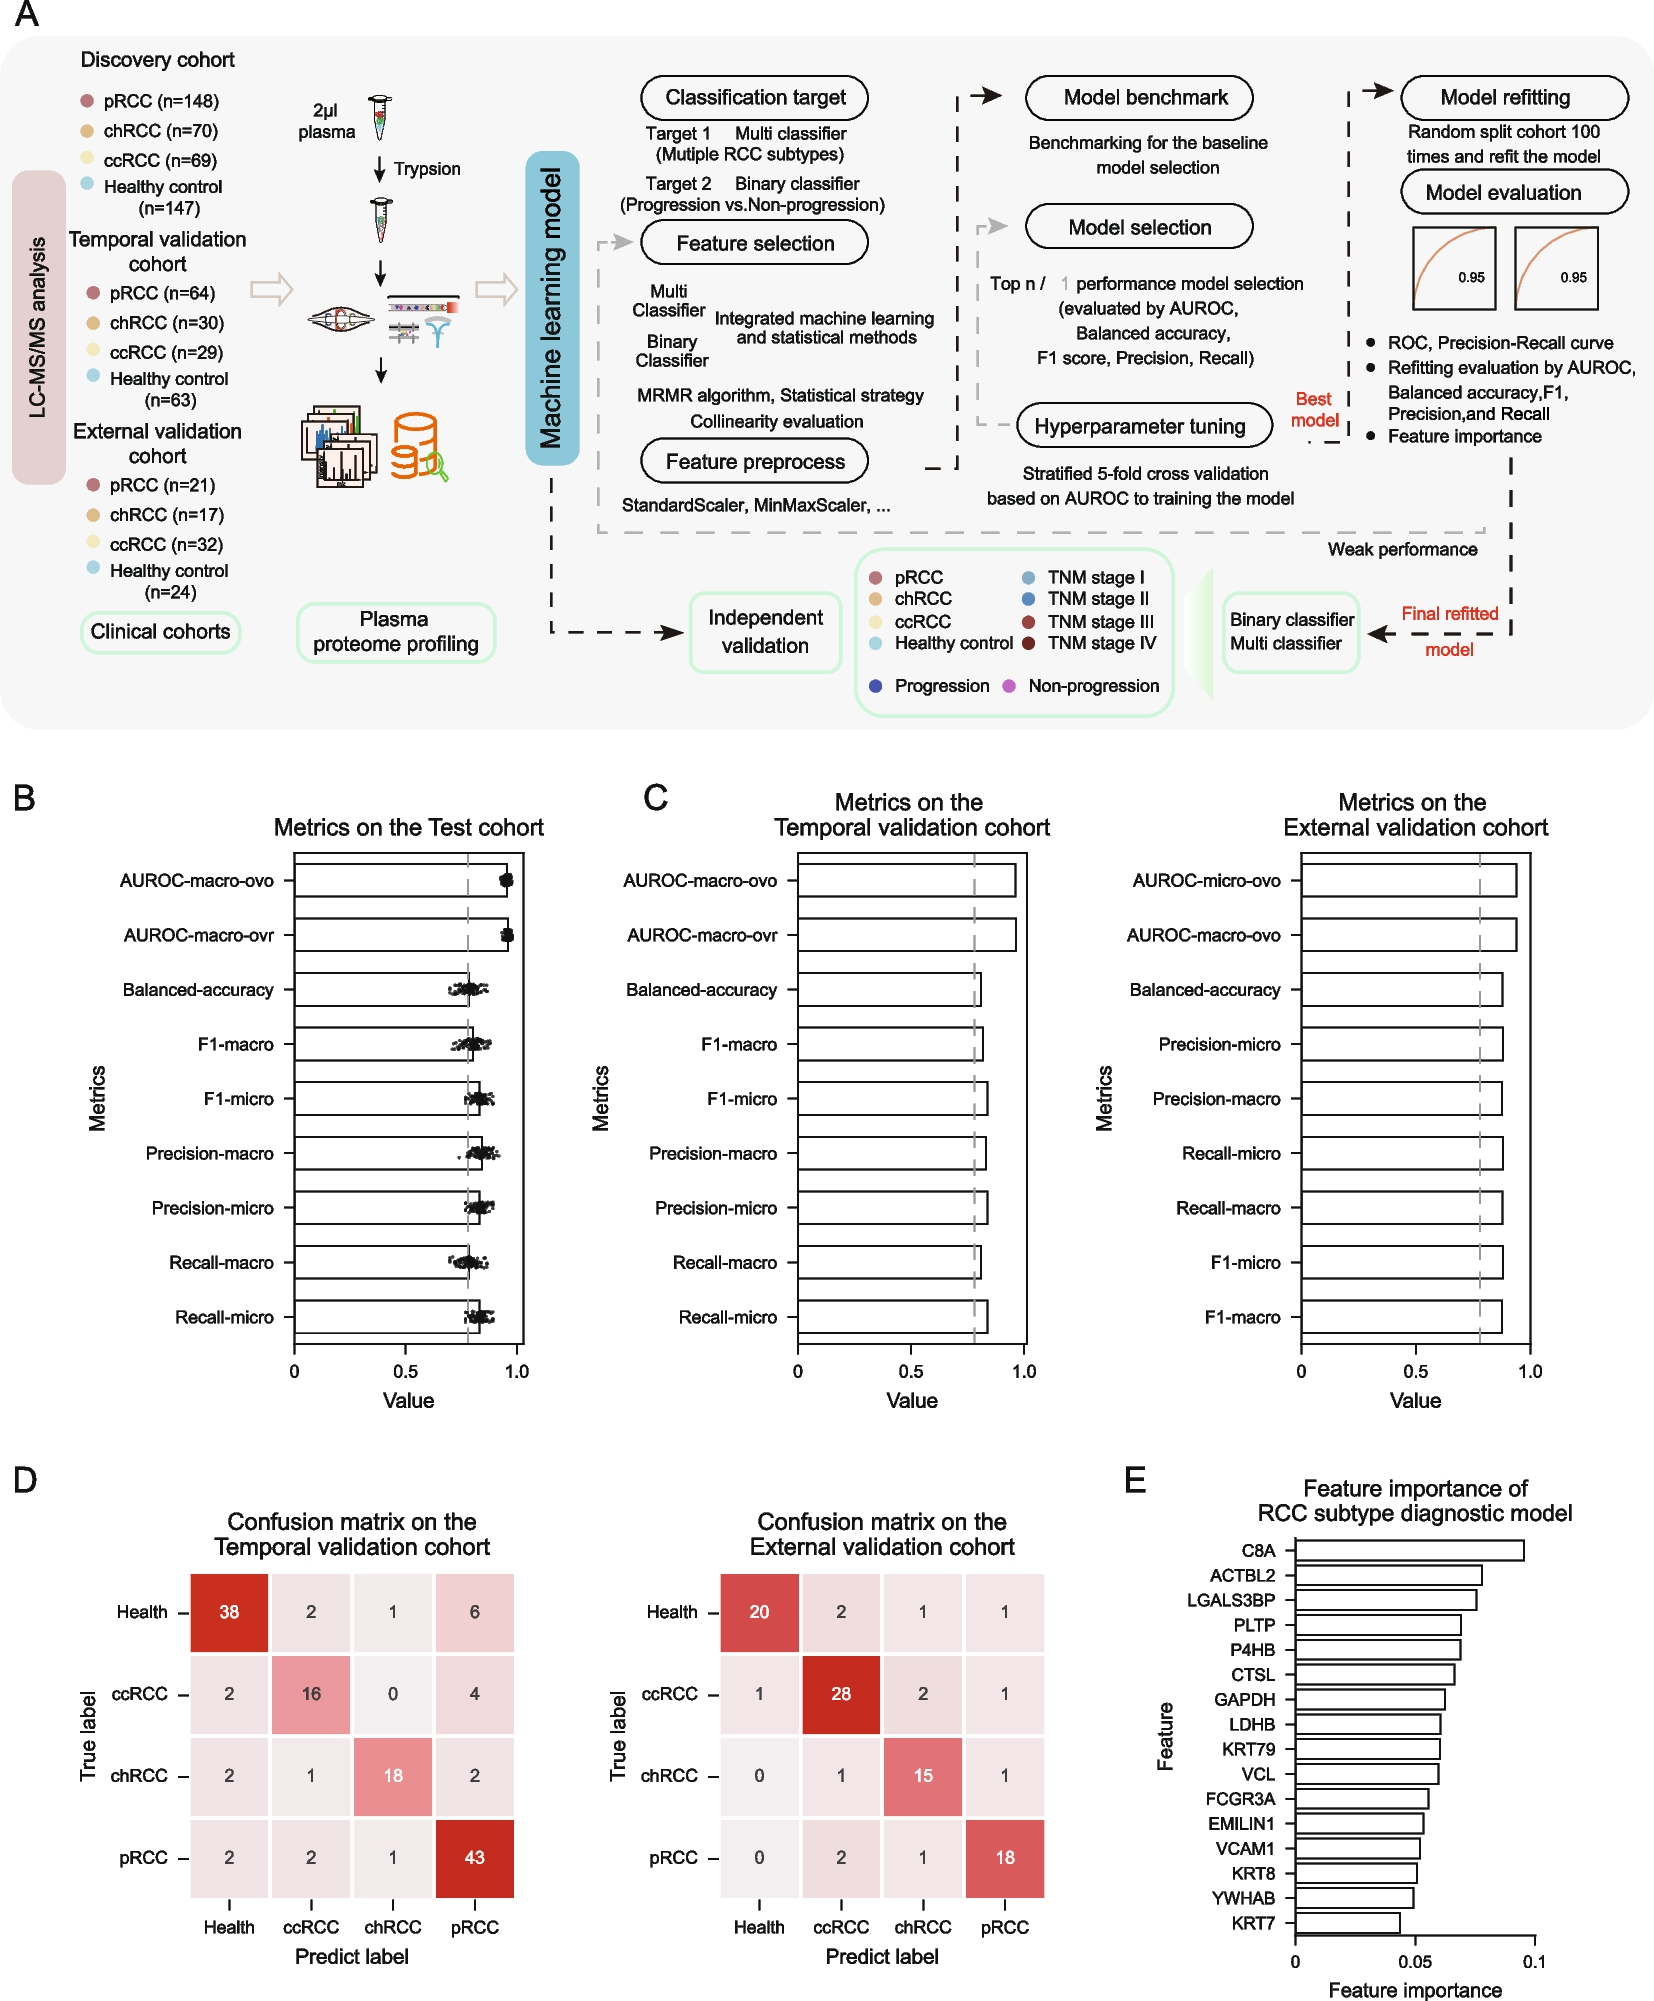


To build a predictive model, we designed a machine learning pipeline consisting of eight parts: classification-target, feature-selection, feature-preprocessing, model-benchmarking, model-selection, hyperparameter-tuning, model-refitting, and model-evaluation [8] (Fig. 1A).
First, based on this pipeline, we constructed a RCC subtype diagnostic model, which classifies RCC subtypes and healthy controls. Specifically, 16 proteins with low collinearity were selected as the features for the model construction (Fig. S2A and Table S1). As for the model evaluation, we employed multiple metrics including the area under receiver operating characteristic curve (AUROC), balanced accuracy, recall, precision, and F1. As shown in Fig. 1B, the bootstrapping strategy results indicated the model had the good performance on the discovery cohort (Table S2). Moreover, to reduce sample imbalance and enhance model stability, we applied a bootstrapping approach to adjust the sample ratio, making it more representative of real-world epidemiological trends. The model’s performance was outstanding with macro-average, micro-average, and weighted-average AUROC all exceeding 0.95, indicating the RCC subtype diagnostic model was robust under the different sample ratio (Fig. S2C). Furthermore, after refitting the model on discovery cohort, the model also showed good generalization ability on both independent temporal and external validation cohorts (AUROC > 0.9) (Fig. 1C, D and S2D). The average precision (AP) was 0.91 and 0.88, respectively. Notably, the APs for the three subtypes and healthy controls were all greater than 0.80 on both two validation cohorts (Fig. S2E). All evaluation results demonstrated that the model for diagnosing RCC subtypes had good predictive performance and generalization ability. Figure 1E showed the feature importance ranking of the RCC subtype diagnostic model (Table S3). To assess tissue-plasma consistency, we collected tumor and adjacent normal tissues from 15 pRCC patients and performed proteome profiling (Fig. S3A). We found the protein features with high ranking have the same tendency in both plasma and tissue proteome (Fig. S4). We further investigated clinical factors influencing pRCC prognosis by setting multiple potential risk factors as covariates including TNM stage, ISUP grade, sex, age, BMI, and WHO classification. The results revealed advanced TNM stage was significantly associated with survival (Fig. S5A), prompting the development of the TNM staging diagnostic model. The model showed the good performance on both discovery and validation cohort manifested as the AUROC > 0.90 for each of stages (Fig S5D and S5E). These results indicated the plasma proteome data could provide the complementary noninvasive strategy for the existed clinical diagnosis for TNM stage.
Additionally, considering the long-term clinical management owing to the advanced pRCC has the higher malignancy compared to other RCC subtypes, we developed a pRCC time-clock progression model to predict progression-free survival (PFS) status at different time points. Specifically, we selected four time points 2, 3, 4, and 5 years for the construction (Fig. 2A and S6A). The pRCC time-clock progression model has the good performance. Detailly, on the discovery cohort, the AUROC and AP at 2, 3, 4, and 5 years all exceeded 0.89 (Fig. S6B and S6C) and the bootstrapping results showed the robustness of the models (median value of AUROC > 0.80 and standard deviation < 0.05) (Fig. S7B). To assess the model’s generalization performance, we calculated the metrics on the independent temporal validation cohort and the AUROC and AP at all four time points were greater than 0.9 (Fig. 2B and C). The confusion matrices of all four models demonstrated good generalization performance (Fig. 2D). Furthermore, we evaluated the feature importance of the four models (Fig. 2E and Table S4). These results indicate that the models exhibit robust generalization performance and may be beneficial for prognostic management in the clinical practice of pRCC.
Fig. 2
Predicting the progression clock of pRCC. A Diagram describing the construction pipeline of the pRCC time-clock progression model used to predict progression and non-progression state in the pRCC population at 2, 3, 4, and 5 years, respectively. B The ROC curve of the four pRCC time-clock progression models on the independent temporal validation cohort. C The precision-recall curve of the four pRCC time-clock progression models on the independent temporal validation cohort. D Confusion matrix of the pRCC time-clock progression model at different time points in the pRCC population on the independent temporal validation cohort. E The bar chart depicting the important features of the different pRCC time-clock progression models
Overall, comprehensive proteomic analysis data combined with clinical indicators can facilitate the diagnosis of RCC subtypes (RCC subtype diagnostic model) and TNM staging (TNM staging diagnostic model), and the prediction of long-term PFS status (pRCC time-clock progression model), thereby enabling patient stratification and contributing to personalized treatment of RCC, particularly for pRCC patients.
Comments (0)