Study design and participants
This cross-sectional study was conducted at the headache clinic of the Fourth People’s Hospital of Shenzhen (Shenzhen Samii Medical Center, SSMC), a tertiary comprehensive hospital, between October 2022 and May 2024. Ethical approval was obtained from the Medical Ethics Committee (No.GDREC2020231H-1). All participants or their legal guardians provided written informed consent before the study procedures.
Participants were enrolled based on the following criteria: diagnoses of migraine and chronic migraine (CM) were established by trained neurologists following the criteria of the International Classification of Headache Diseases 3rd edition (ICHD-3) [2]. Given the potentially distinct pathophysiology [12], individuals with CM were not included in this study. The inclusion criteria specified that the subjects were: (1) aged 16 to 60 years; (2) not on any prophylactic medications or contraceptives before; (3) no documented history of other primary headaches; (4) free from a history of traumatic brain injury; (4) non-smoker with no history of alcohol or other addictive substance dependence; (5) in absence of major systemic diseases, including a medical history of cardiovascular disease or related risk factors (e.g., hypertension, diabetes, hyperlipidemia), or connective tissue disorders (e.g., rheumatoid arthritis); (6) without documented history of major neurological, or psychiatric conditions. Participants reporting any history of mental health concerns underwent psychiatric consultation when indicated. Only those with a specialist-confirmed absence of DSM-5 psychiatric disorders were enrolled. To minimize the impact of medications and pain, MRI scans were scheduled at least 72 h after the most recent migraine attack and at least 48 h after the last administration of abortive migraine medications. Additionally, the patients all had imaging data eligible for analysis and were capable of completing comprehensive headache questionnaires. Controls, matched for age and sex, had no documented history of primary headaches, were free from moderate or severe headache attacks for at least one year, free from clinical drug use within the preceding 3-month period, and had no history of medical, neurological, or psychiatric diseases.
Clinical and neuropsychological assessments
Demographic data and clinical features of migraine patients, including age, sex, and migraine duration, were documented. The participants completed online structured questionnaires and underwent thorough neurological examinations. The questionnaires assessed clinical characteristics of migraine over the preceding 3-month period, including attack frequency (monthly migraine days, MMDs, defined as an average of migraine days in the last three months, consistent with the method in the American Migraine Prevalence and Prevention [AMPP] study) [31], headache intensity (visual analogue scale, VAS, mean score of typical migraine attacks over the past 3 months), accompanying symptoms such as phonophobia and photophobia, cutaneous allodynia (Allodynia Symptom Checklist, ASC-12) [32], migraine-related disability (Migraine Disability Assessment, MIDAS) [33], headache impact (Headache Impact Test-6, HIT-6) [34], and depression symptoms (Patient Health Questionnaire-9, PHQ-9) [35], anxiety symptoms (Generalized Anxiety Disorder Questionnaire-7, GAD-7) [36], and sleep quality (Pittsburgh Sleep Quality Index, PSQI) [37]. Elevated scores on MIDAS, HIT-6, PHQ-9, GAD-7, and PSQI indicated increased headache-related disability, adverse impact, severe depression, severe anxiety, and poorer sleep quality, respectively. The presence of cutaneous allodynia was defined by an ASC-12 total score of 3 or more during migraine attacks [32]. Severe migraine-related disability was defined as a total score of MIDAS of 20 or above over the past 3 months [33].
Grouping of migraine participants
Preclinical studies suggest that migraine attacks disrupt glymphatic function. For instance, Aaron J et al. used two-photon microscopy in mice to show cortical spreading depression (CSD)-induced perivascular space closure and impaired glymphatic transport [16]. Similarly, a nitroglycerin-induced migraine model showed disrupted aquaporin-4 function, leading to reduced waste clearance and elevated CGRP levels [15]. These findings align with established migraine mechanisms involving CGRP dysregulation and neuroinflammation [8, 38], supporting transient glymphatic suppression during attacks. While the impairment may initially be reversible, frequent attacks could lead to irreversible glymphatic impairment due to toxic metabolite buildup. To translate these preclinical insights into humans, we compared glymphatic activity between low-frequency (LFEM) and high-frequency (HFEM) migraine patients. Clinical studies typically stratify EM into three frequency-based subgroups: low-frequency (LFEM, 0-3MHDs), medium-frequency (MFEM, 4-7MHDs), and high-frequency EM (HFEM, 8-14MHDs) [3, 31, 39]. Significant differences in headache-related disability, disease burden, and comorbidity profiles emerge primarily between HFEM and LFEM groups, with minimal distinction between HFEM and MFEM [5, 31]. Of note, we used the 4 MMDs cut-off based on the following considerations: (1) the prevalence of 8–14 MHDs is generally low, as evidenced in large American (8.3%) [31] and Chinese migraine study (3.59%) [39]. Our cohort showed similar HFEM prevalence (11.1%; 8/72 EM). (2) In real-world clinical practice, preventive treatment is typically initiated at ≥ 4 MMDs, which is a clinically meaningful cut-off [40]. Accordingly, patients with fewer than 4 MMDs were placed in the LFEM group.
MRI acquisition
MRI was conducted using a 3.0T MRI system (uMR 780, United Imaging Healthcare; Shanghai, China), with a minimum interval of 72 h from the last migraine attack. Telephone follow-ups within 3 days post-scan confirmed attack-free status to ensure the imaging data were collected in the interictal phase. The subjects were positioned supine within the scanner framework and padded with foam to minimize head movement. The MRI protocol included T1-weighted imaging (T1WI) using a 3D fast spoiled gradient echo (FSP) sequence (TR/TE = 7.2/3.1 ms, TI = 750 ms, FOV = 24 cm × 24 cm, voxel size = 1 × 1 × 1 mm3, slice thickness = 1 mm, FA = 9 degrees, 180 sagittal slices), T2-weighted imaging (T2WI: TR/TE = 5,152/90.3 ms), fluid-attenuated inversion recovery (FLAIR: TR/TE = 9,000/105.3 ms; voxel size = 0.95 × 0.76 × 5 mm3, FOV = 20 cm × 20 cm, slice thickness = 5 mm, slice spacing 2 mm, 22 axial slices), and diffusion imaging using a single-shot echo‒planar imaging (EPI) sequence (TR/TE = 11,621/93.4 ms, FOV = 24 cm × 24 cm, slice thickness = 2.0 mm, voxel size 2 mm isotropic, 81 axial slices, 32 diffusion-weighted directions, b = 1000 s/mm2, 1 b = 0 image, anterior-posterior phase encoding direction).
DTI data preprocessing and calculation of the DTI-ALPS index
We employed the DTI-ALPS model, initially proposed by Taoka et al. [23] and modified by Zhang et al. [22] in the present study. The rationale, DTI data preprocessing, and calculation of the DTI-ALPS index as a metric of glymphatic transport were described in detail in our previous work [41]. Preprocessing involved denoising, head motion correction, and eddy current correction via automatic image registration toolkits within DTI Studio (https://www.mristudio.org). Processed DTI data were then used to generate diffusivity maps along the direction of the x-axis (right-left), y-axis (anterior-posterior), z-axis (inferior-superior), and color-coded fractional anisotropy (FA) maps. At the ventricular body’s uppermost levels, where deep medullary veins were perpendicular to the lateral ventricle body, four 5-mm diameter spherical regions of interest (ROIs) were placed on bilateral projection and association fibers on FA maps. The DTI-ALPS index was calculated as [(Dxproj + Dxassoc)/(Dyproj + Dzassoc)] for each side, with the bilateral average serving as the glymphatic function measure. A higher DTI-ALPS index indicates better diffusivity along deep medullary veins, reflecting robust glymphatic activity. As isotropic diffusion intensifies within regions such as the subarachnoid space, ventricles, and white matter hyperintensity (WMH) in correlation with rising free water content, incorporating these areas into the regions of interest (ROIs) could lead to minimal differentiation between the numerator and denominator in the DTI-ALPS formula. To minimize this bias, each ROI was carefully delineated by a trained neurologist, who was blinded to the clinical data, for every patient. This process deliberately avoided areas identified as subarachnoid, ventricular, and WMH on FLAIR images. To evaluate intraobserver reliability, the same neurologist repositioned the ROIs and recalculated the DTI-ALPS index with a minimum interval of three days, resulting in an intraobserver Cronbach’s α of 0.950.
PVS segmentation
Preprocessed data from 3D T1-weighted images were utilized to generate a perivascular space (PVS) probability map using a previously validated deep learning model (https://github.com/pboutinaud/SHIVA _PVS), as detailed in prior publications [29, 42]. The preprocessing steps included tissue segmentation on T1 images using FreeSurfer to create masks for the basal ganglia, white matter, and ventricles. Voxel intensity values were linearly normalized to a range of 0–1, with the 99th percentile of the image set designated as the maximum value, and any intensities exceeding this value were capped. The T1 images were subsequently cropped to eliminate the neck region and background air signals. A PVS probability map was then derived by integrating the preprocessed T1 images into the PVS segmentation model, with voxel intensities ranging from 0 to 1, indicative of the likelihood of PVS presence. Following visual assessment and developer recommendations, a threshold of 0.4 was applied to the PVS probability maps to optimize precision and sensitivity, thereby generating a PVS mask for each subject. PVS masks within 1 mm of the ventricle were excluded to mitigate partial volume effects from cerebrospinal fluid. PVS volume was adjusted for intracranial volume. To ascertain the validity of the segmentation, Spearman’s correlation analysis was conducted between visual rating scores (a 4-point PVS visual rating scale: 0 score, no PVS; 1 score, 1–10 PVS; 2 score, 11–20 PVS; 3 score, 21–40 PVS; 4 score, > 40 PVS) and the volume of PVS in the basal ganglia (BG-PVS) and white matter (WM). The correlation coefficient for WM PVS was 0.426 (p < 0.001), suggesting a strong concordance between the quantitative segmentation and semiquantitative ratings. Conversely, the correlation for BG-PVS was 0.140 (p = 0.133), indicating no significant agreement. Of note, both visual rating and segmentation of PVS are valid and reliable, although only in the BG the two ratings are correlated [29]. This has been systematically described in a recent review [43].
WMH segmentation
White matter hyperintensity (WMH) volume were automatically determined from fluid-attenuated inversion recovery (FLAIR) and 3D T1 images using the Lesion Segmentation Tool (LST), a state-of-the-art artificial intelligence-based lesion segmentation toolkit [44]. The segmentations were visually inspected for errors and manually edited by a trained rater, blinded to the clinical data, using ITK-SNAP (http://www.itksnap.org/pmwiki/pmwiki.php). In addition, periventricular WMH and deep WMH were qualified using FMRIB Software Library (www.fsl.fmrib.ox.ac.uk/fsl). Specifically, we generated ventricle masks and calculated the geometrical distance from this mask in each voxel using the Brain Intensity AbNormality Classification Algorithm (BIANCA) and the command ‘distancemap’ [45]. According to the previously validated criteria in the literature, voxels within a 10 mm distance of the ventricles were classified as periventricular WMH, and their volumes were calculated accordingly. WMH volume was normalized to the intracranial volume.
Statistical analysis
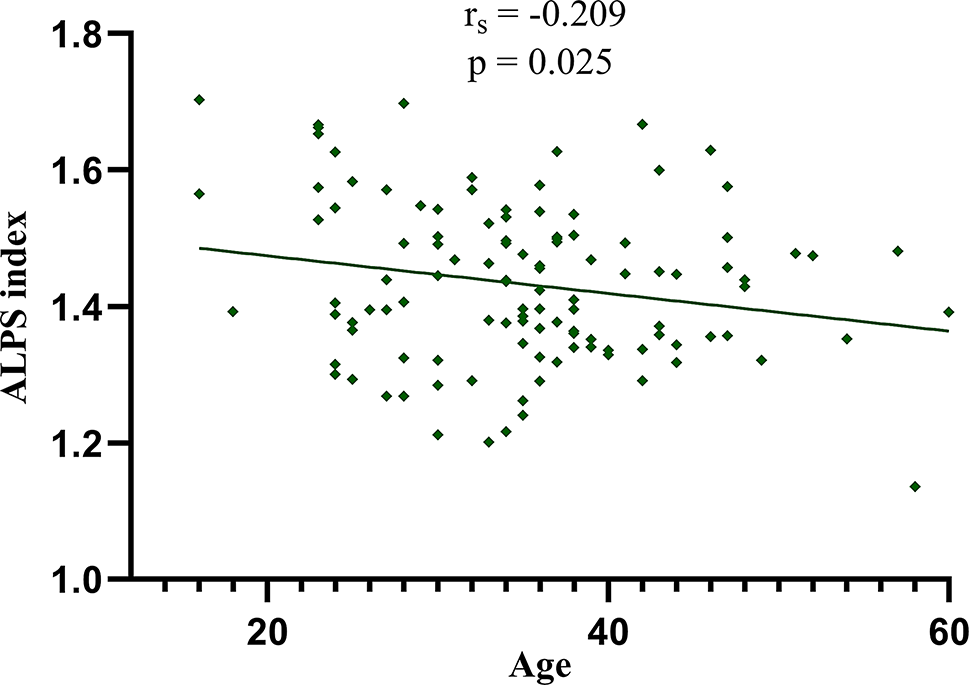
The sample size was based on clinical feasibility, available data, and previous literature. Post-hoc power analysis demonstrated that the final cohort of 116 cases (42 controls, 46 LFEM, and 28 HFEM) achieved > 80% statistical power at a two-sided alpha of 0.05 to detect medium-effect differences (Cohen’s f = 0.35) in primary one-way analysis of variance (ANOVA) comparisons. Statistical analyses were conducted using Statistical Product and Service Solutions (SPSS, IBM Corp., Armonk, NY) software, version 23.0, with the significance level set at a two-tailed p_value < 0.05. The Shapiro‒Wilk test was employed to assess the normality of the distribution of the continuous variables. Continuous variables are presented as mean (standard deviation, SD) or median (interquartile ranges, IQRs) according to the data distribution, and categorical variables are presented as counts and percentages (n, %). Demographic data and neuropsychological data comparisons between patients with EM and the controls were performed via two-sample t tests for normally distributed continuous variables, Mann-Whitney U tests for non-normally distributed continuous variable, and chi-squared tests for categorical variables, as appropriate. The correlations between age and the DTI-ALPS index were examined using group-adjusted partial correlation analysis among all participants.
Since the DTI-ALPS index, Dx and Dyz were normally distributed, differences in the DTI-ALPS index between the controls and the patients with EM and migraine subgroups with different attack frequencies were evaluated using Two-sample t tests, one-way analysis of variance (ANOVA) tests and post-hoc analyses, respectively. Following the identification of significant differences in the DTI-ALPS index between the LFEM group and the HFEM group, analysis of covariance (ANCOVA) with age, sex distribution, and disease duration as covariates was conducted to determine whether the difference in the DTI-ALPS index between the EM subgroups remained significant.
Furthermore, the correlations between the DTI-ALPS index and the clinical and neuropsychological characteristics of migraine patients were evaluated using Spearman’s rho correlation analyses or two-sample t tests. To examine whether the correlation between age and DTI-ALPS index differed significantly between the EM group and the control group, we performed a between-subjects effects analysis using a general linear regression model. Sixteen variables were included in the correlation analysis or two-sample t test. Covariates with a p_value less than 0.1, including monthly migraine days (MMDs), VAS, photophobia, phonophobia, and headache-related severe disability, along with age, sex distribution, PSQI scores, and disease duration, were further analyzed using stepwise forward multivariable linear regression to determine if they independently affected the DTI-ALPS index in EM patients.
Differences in PVS volume in the white matter (WM) and basal ganglia (BG) regions, and WMH volume in the deep WM and periventricular regions between controls and EM patients, as well as migraine subgroups with different attack frequencies, were assessed using Mann-Whitney U tests. Spearman’s rho correlation analysis was used to assess the relationships between the DTI-ALPS index and the clinical, neuropsychological, and imaging characteristics of EM. Additionally, stepwise forward multivariable linear regression was conducted, with the DTI-ALPS index as the dependent variable and PVS volume in the white matter, deep WMH volume, and the aforementioned clinical covariates as independent variables. This analysis aimed to establish whether the burdens of PVS and WMH were independently associated with the DTI-ALPS index in EM patients.


Comments (0)