
Remember me

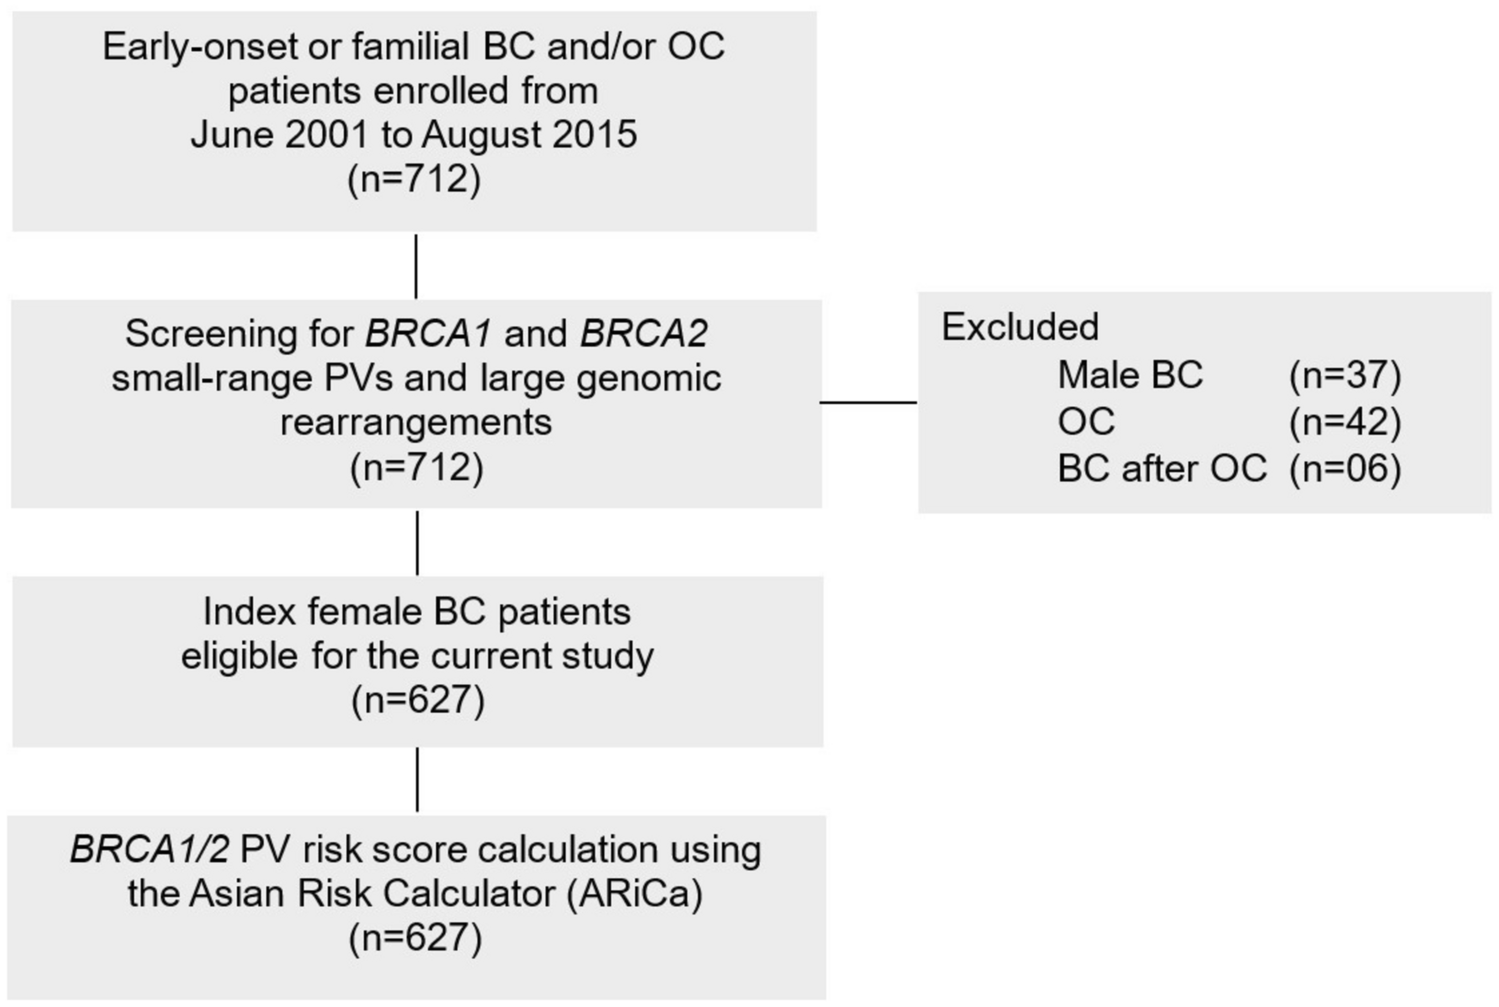
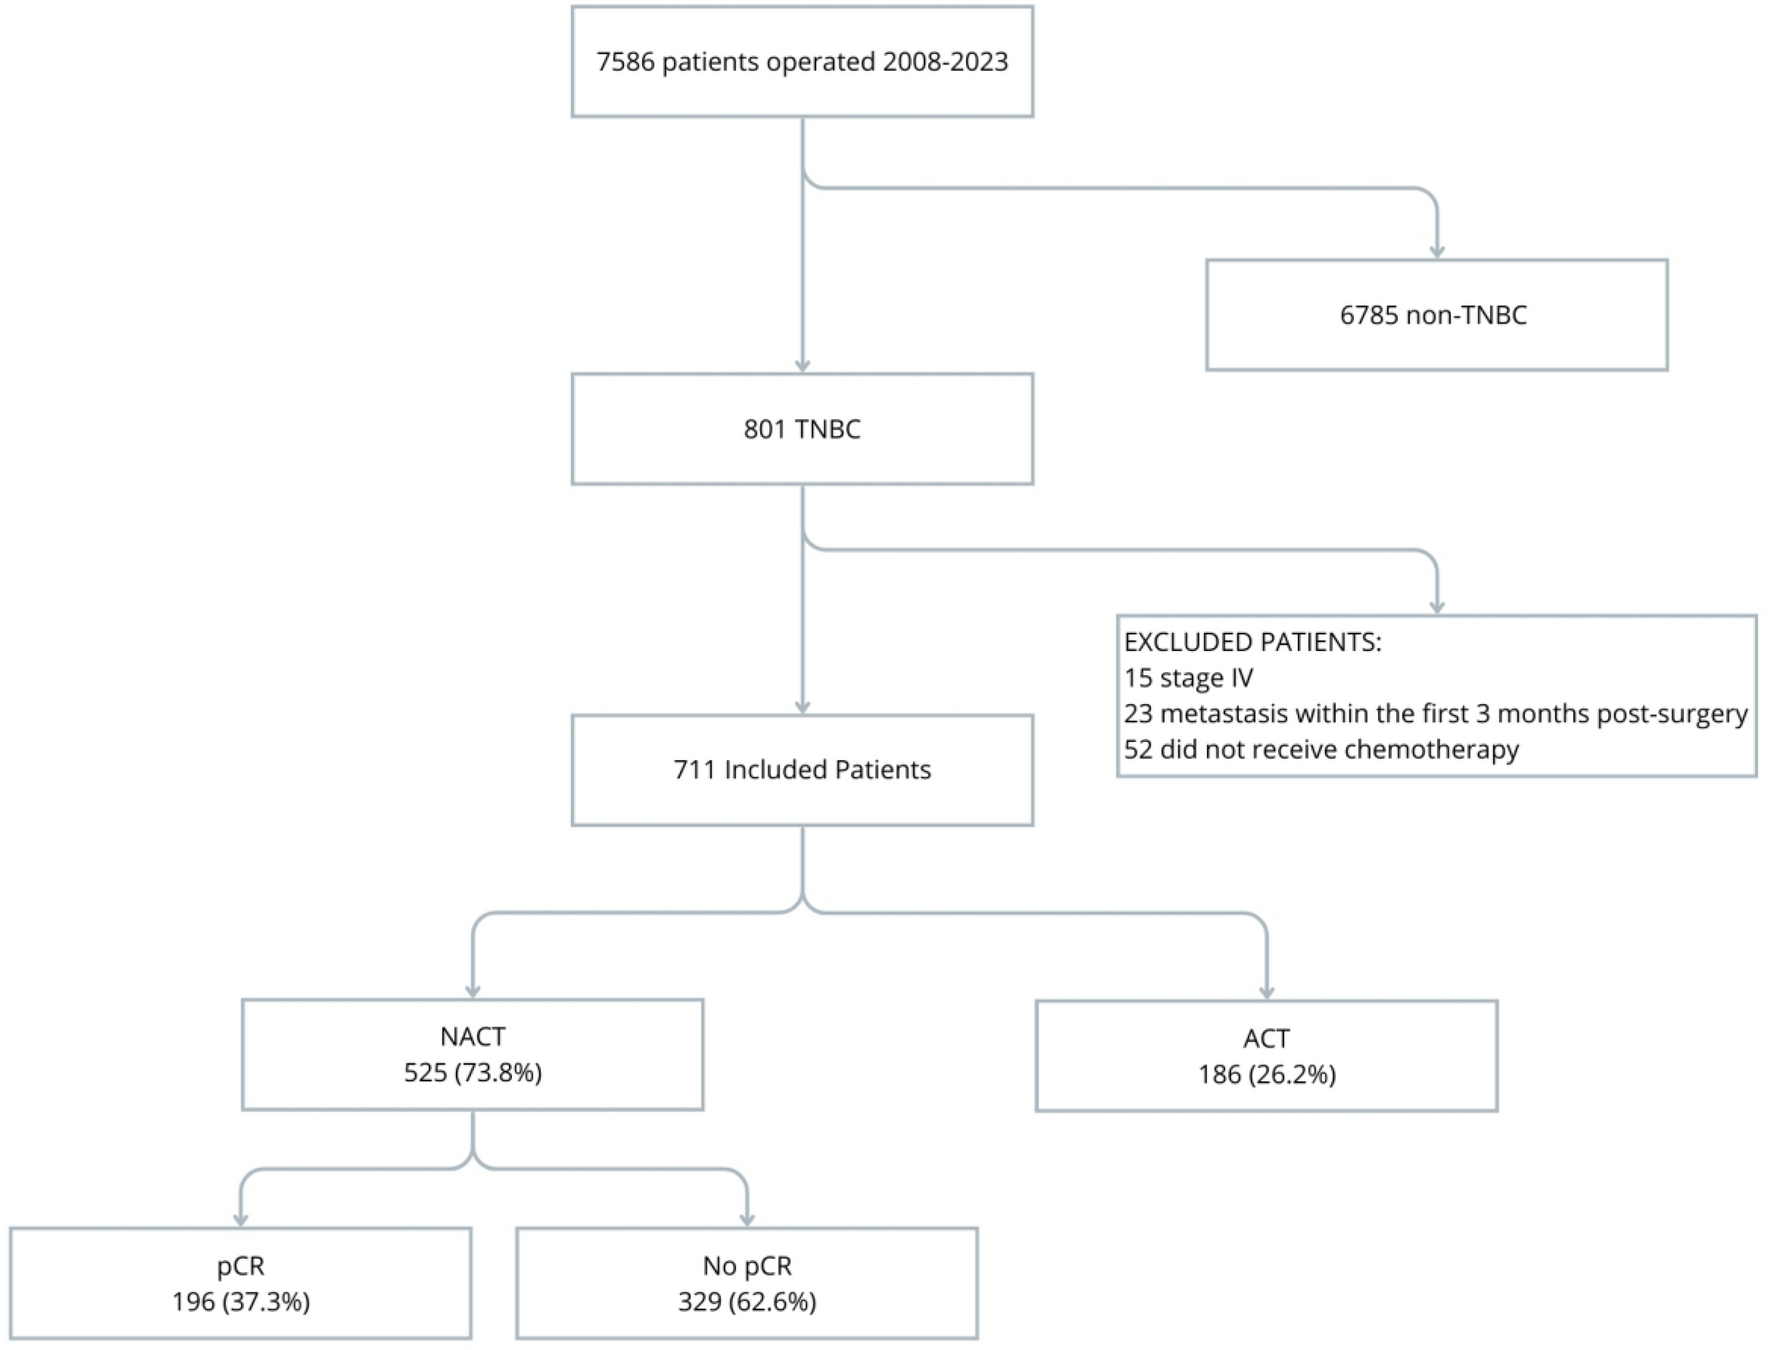
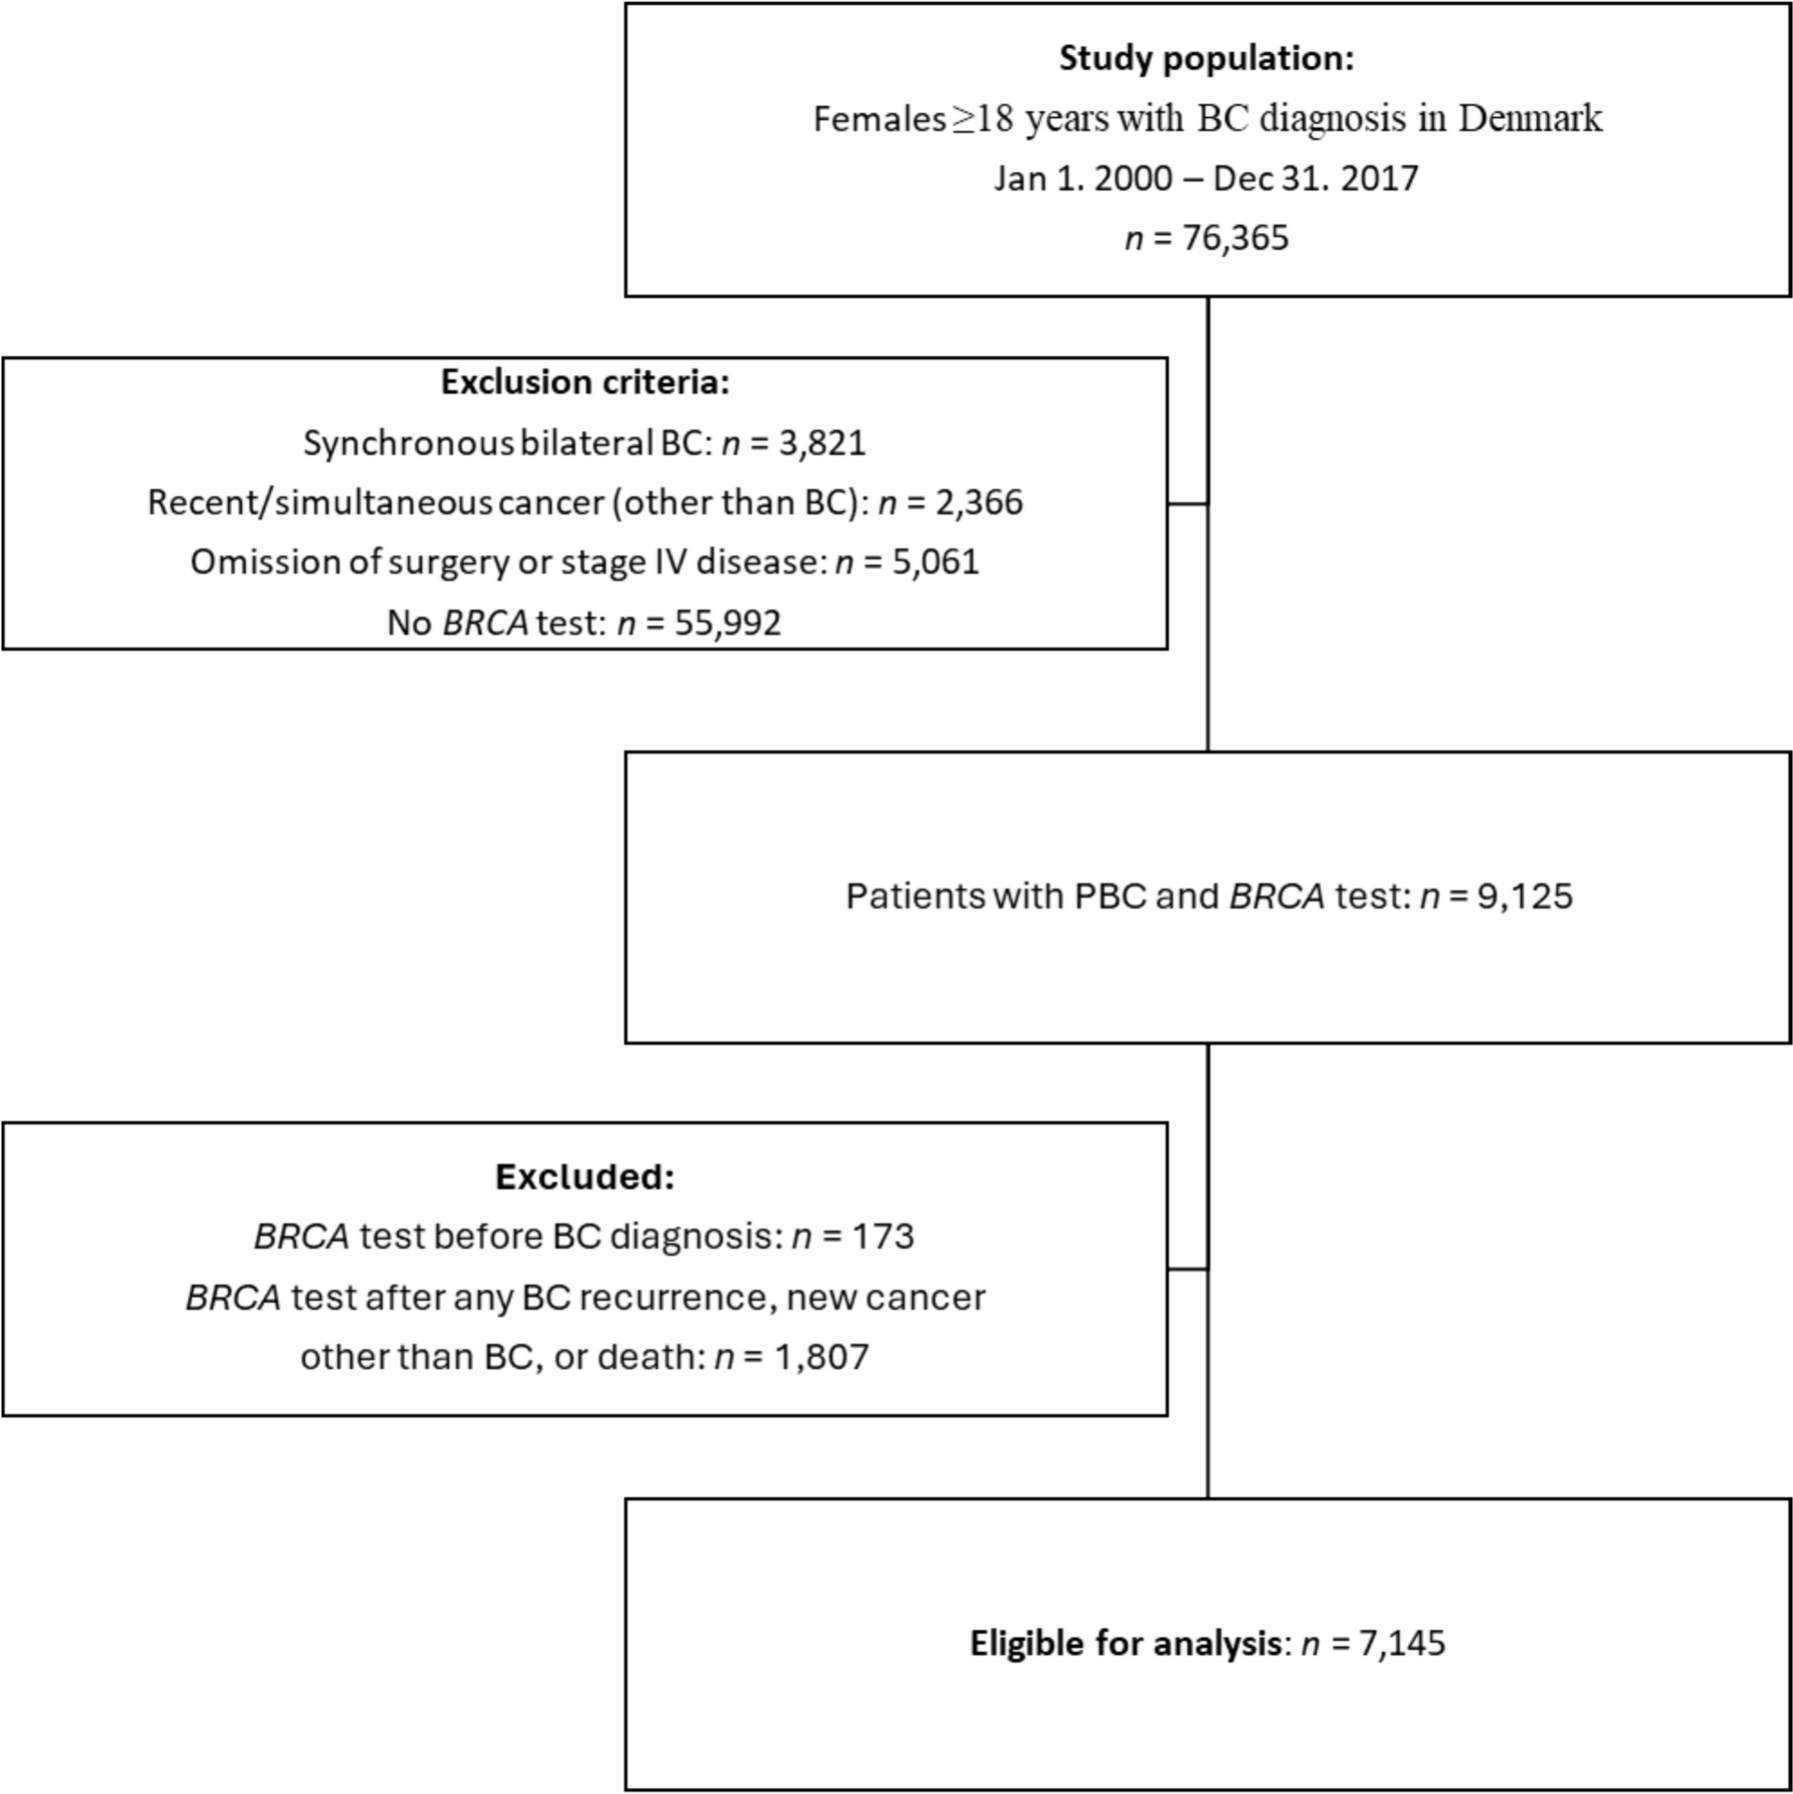
During the study period (2008–2023), 7,586 patients with non-metastatic breast cancer were identified, of whom 811 (10.7%) had TNBC, and 711 met the eligibility criteria. Among these, 73.8% received NACT, achieving a pathological complete response (pCR) rate of 37.3% (Fig. 1). Baseline characteristics of the entire cohort, as well as the NACT and ACT groups, are presented in Table 1. The median age of the cohort was 54 years (IQR 45–63), with 36% having a family history of breast cancer, 66% being postmenopausal, 83% having children, and 63% presenting with overweight or obesity (41% and 22%, respectively).
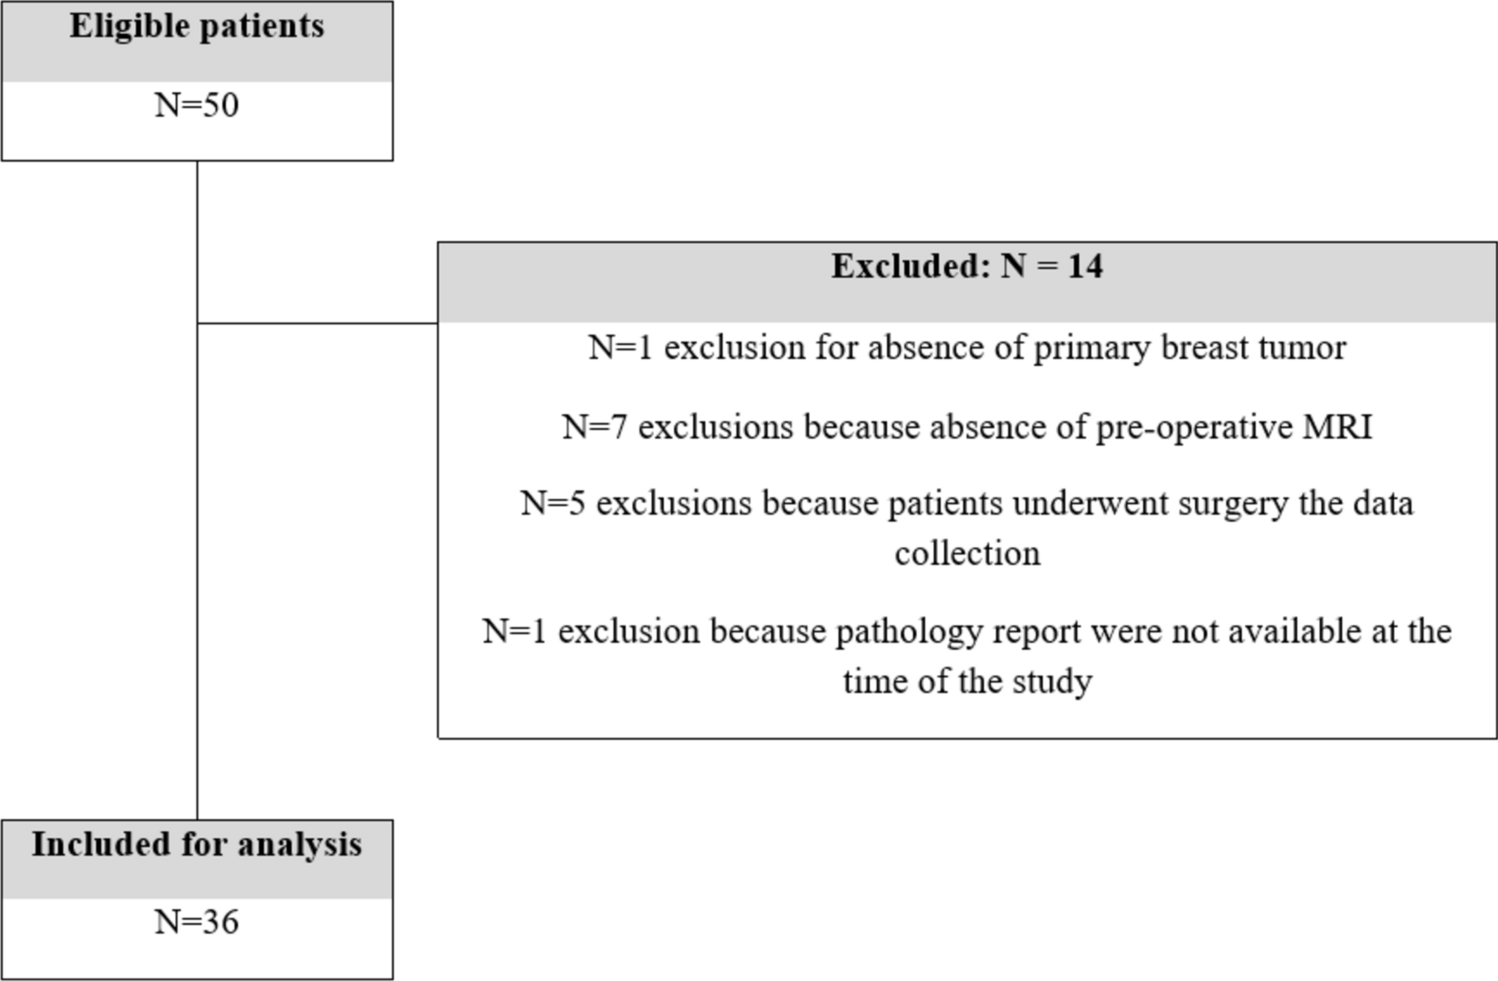
Fig. 1
Flowchart of patient selection
Flowchart of patient selection from 2008 to 2023 showing the timing of chemotherapy (NACT vs ACT) and the pathological complete response (pCR) to neoadjuvant chemotherapy
Table 1 Characteristics of patients at diagnosis of TNBC according to chemotherapy and surgeryCompared to the ACT group, the NACT group included more patients aged ≤ 50 years (46% vs. 26.2%), premenopausal women (38% vs. 25%), and those with stage III tumors at diagnosis (41% vs. 7.5%), nodal involvement (55% vs. 20%), T3-4 tumors (44% vs. 13.5%), and lymphovascular invasion (LVI) (90% vs. 69%).
In the entire cohort, most patients received RT (70%), anthracycline-based chemotherapy (66%), and ≥ 3 cycles of chemotherapy (96%). Surgical approaches were balanced between mastectomy (50%) and breast-conserving surgery (50%). Compared to NACT, the ACT group had a higher rate of breast-conserving surgery (60% vs. 46%), greater use of anthracyclines (73% vs. 64%), and lower use of RT (65% vs. 72%). Carboplatin (CBP) was only used in the NACT group in 36% of patients (Table 2).
Table 2 Treatment variables and responsesClinical outcomesBefore PS matching, the median follow-up for the entire cohort was 43 months (IQR 23.4–75.3), with all-cause mortality rate of 29.7% and a recurrence rate of 20.5%. In the unadjusted analysis, ACT was associated with longer overall survival (OS) (median 154 vs. 139 months) and EFS (median 154 vs. 129 months), although the differences were not statistically significant (OS: HR 1.30, 95% CI 0.95–1.77, p = 0.13; EFS: HR 1.18, 95% CI 0.88–1.58, p = 0.274). The 3-, 5-, and 10-year OS rates for the NACT vs. ACT groups were 80%, 66.5%, and 53.5% vs. 86.2%, 72.6%, and 61.4%, respectively. Similarly, the 3-, 5-, and 10-year EFS rates were 72.3%, 62.9%, and 51.8% vs. 76.2%, 65.4%, and 55.0%, respectively.
After PS matching, most variables were balanced, generating 177 matched pairs. However, age, tumor stage, and histological grade (HG) remained unbalanced. In the adjusted cohort, NACT was associated with an increased risk of mortality and recurrence (OS: HR 1.56, 95% CI 1.08–2.25, p = 0.018; EFS: HR 1.36, 95% CI 0.96–1.93, p = 0.08) (Table 3, Fig. 2).
Table 3 Overall Survival (OS) and Event-Free Survival (EFS) in TNBC Patients Treated with NACT versus ACT in a PS-Matched Cohort using cox proportional hazards analysisFig. 2
Survival outcomes with NACT vs ACT in the PS-matched cohort of TNBC patients. Overall survival (OS) and event-free survival (EFS) in TNBC patients treated with NACT vs ACT in PS-matched cohort. A: unadjusted OS. B: Adjusted OS for variables considered in Model 2 using Cox regression. C: Unadjusted EFS. D: Adjusted EFS for variables considered in Model 2 using Cox regression
Multivariate analysis with propensity score matchingUsing the PS-matched cohort of 354 patients, a multivariate analysis was performed, including variables not controlled by PS and treatment-related variables. In this analysis, the timing of chemotherapy did not statistically affect OS (HR 0.99, 95% CI 0.62–1.61, p = 0.098) or EFS (HR 0.89, 95% CI 0.57–1.40, p = 0.613) (Model 1 in Table 3).
The variable with the greatest influence on this reversal was tumor stage, which enhanced the positive effect of NACT on OS and EFS when included as an interaction variable (OS: HR 0.53, 95% CI 0.07–4.13, p = 0.545; EFS: HR 0.94, 95% CI 0.21–4.17, p = 0.932). Conversely, patients who did not receive RT experienced significantly worse OS and EFS (OS: HR 1.87, 95% CI 1.26–2.76, p = 0.002; EFS: HR 1.75, 95% CI 1.21–2.53, p = 0.003) (Model 2 in Table 3).
Effect of chemotherapy timing on pathological complete response and tumor stageIn the PS-matched cohort, the effect of NACT vs. ACT was analyzed based on pCR status. Patients who achieved pCR with NACT had significantly improved OS (HR 0.22, 95% CI 0.07–0.7) and EFS (HR 0.17, 95% CI 0.05–0.53). Conversely, patients who did not achieve pCR had worse OS (HR 2.24, 95% CI 1.54–3.25) and EFS (HR 2.02, 95% CI 1.42–2.87) (Fig. 3A and B).
Fig. 3
Survival outcomes with NACT vs ACT according to pathological findings and tumor stage. Comparison of overall survival OS A and event-free survival EFS B for all PS-matched cohorts receiving NACT vs ACT based on pathological findings at definitive surgery. Comparison of OS C and EFS D for tumor stages I and II. Comparison of OS E and EFS F fo cT1-2, cN0 (NACT group) and pT1-2, pN0 (ACT group). HR: hazard ratio, NACT: neoadjuvant chemotherapy, ACT: adjuvant chemotherapy
A sensitivity analysis in patients with stage I and II disease showed similar results, with improved OS and EFS in those achieving pCR (OS: HR 0.14, 95% CI 0.02–1.02; EFS: HR 0.1, 95% CI 0.01–0.72) and worse outcomes in those without pCR (OS: HR 1.82, 95% CI 1.05–3.16; EFS: HR 1.63, 95% CI 0.98–2.71) (Fig. 3C and D). A similar, though less pronounced, pattern was observed in early-stage TNBC without nodal involvement (cT1-2, cN0 for NACT; pT1-2, pN0 for ACT) (Fig. 3E and F).
Effect of carboplatin (CBP) on OS and EFSConsidering that CBP was used exclusively in the NACT group, mainly during the last seven years of the study period (2017–2023) in 36% of patients (187/525), and that after adjusting for the propensity score (PS), only 50 patients had received CBP, it was not deemed appropriate to include it as a covariate in the multivariate analysis. Nevertheless, an exploratory multivariate analysis incorporating CBP (Table S1, Supplementary Information) showed no change in the effect of chemotherapy timing on overall survival (HR 0.56, 95% CI 0.070–4.417, p = 0.578), or event-free survival (HR 0.85, 95% CI 0.185–3.878, p = 0.831), compared to the original model without CBP (Table 2).
In the overall cohort, CBP use was associated with improved OS, though the result was not statistically significant (HR 0.88, 95% CI 0.35–2.16, p = 0.772), likely due to limited sample size. Similarly, in the stratified analysis, CBP use in the NACT group showed a non-significant trend toward better OS and EFS compared with ACT (OS: HR 0.90, 95% CI 0.41–2.00, p = 0.794; EFS, HR 0.93, 95% CI 0.47–1.82, p = 0.824) (Figures S1 and S2, Supplementary Information).
Comments (0)