
Remember me
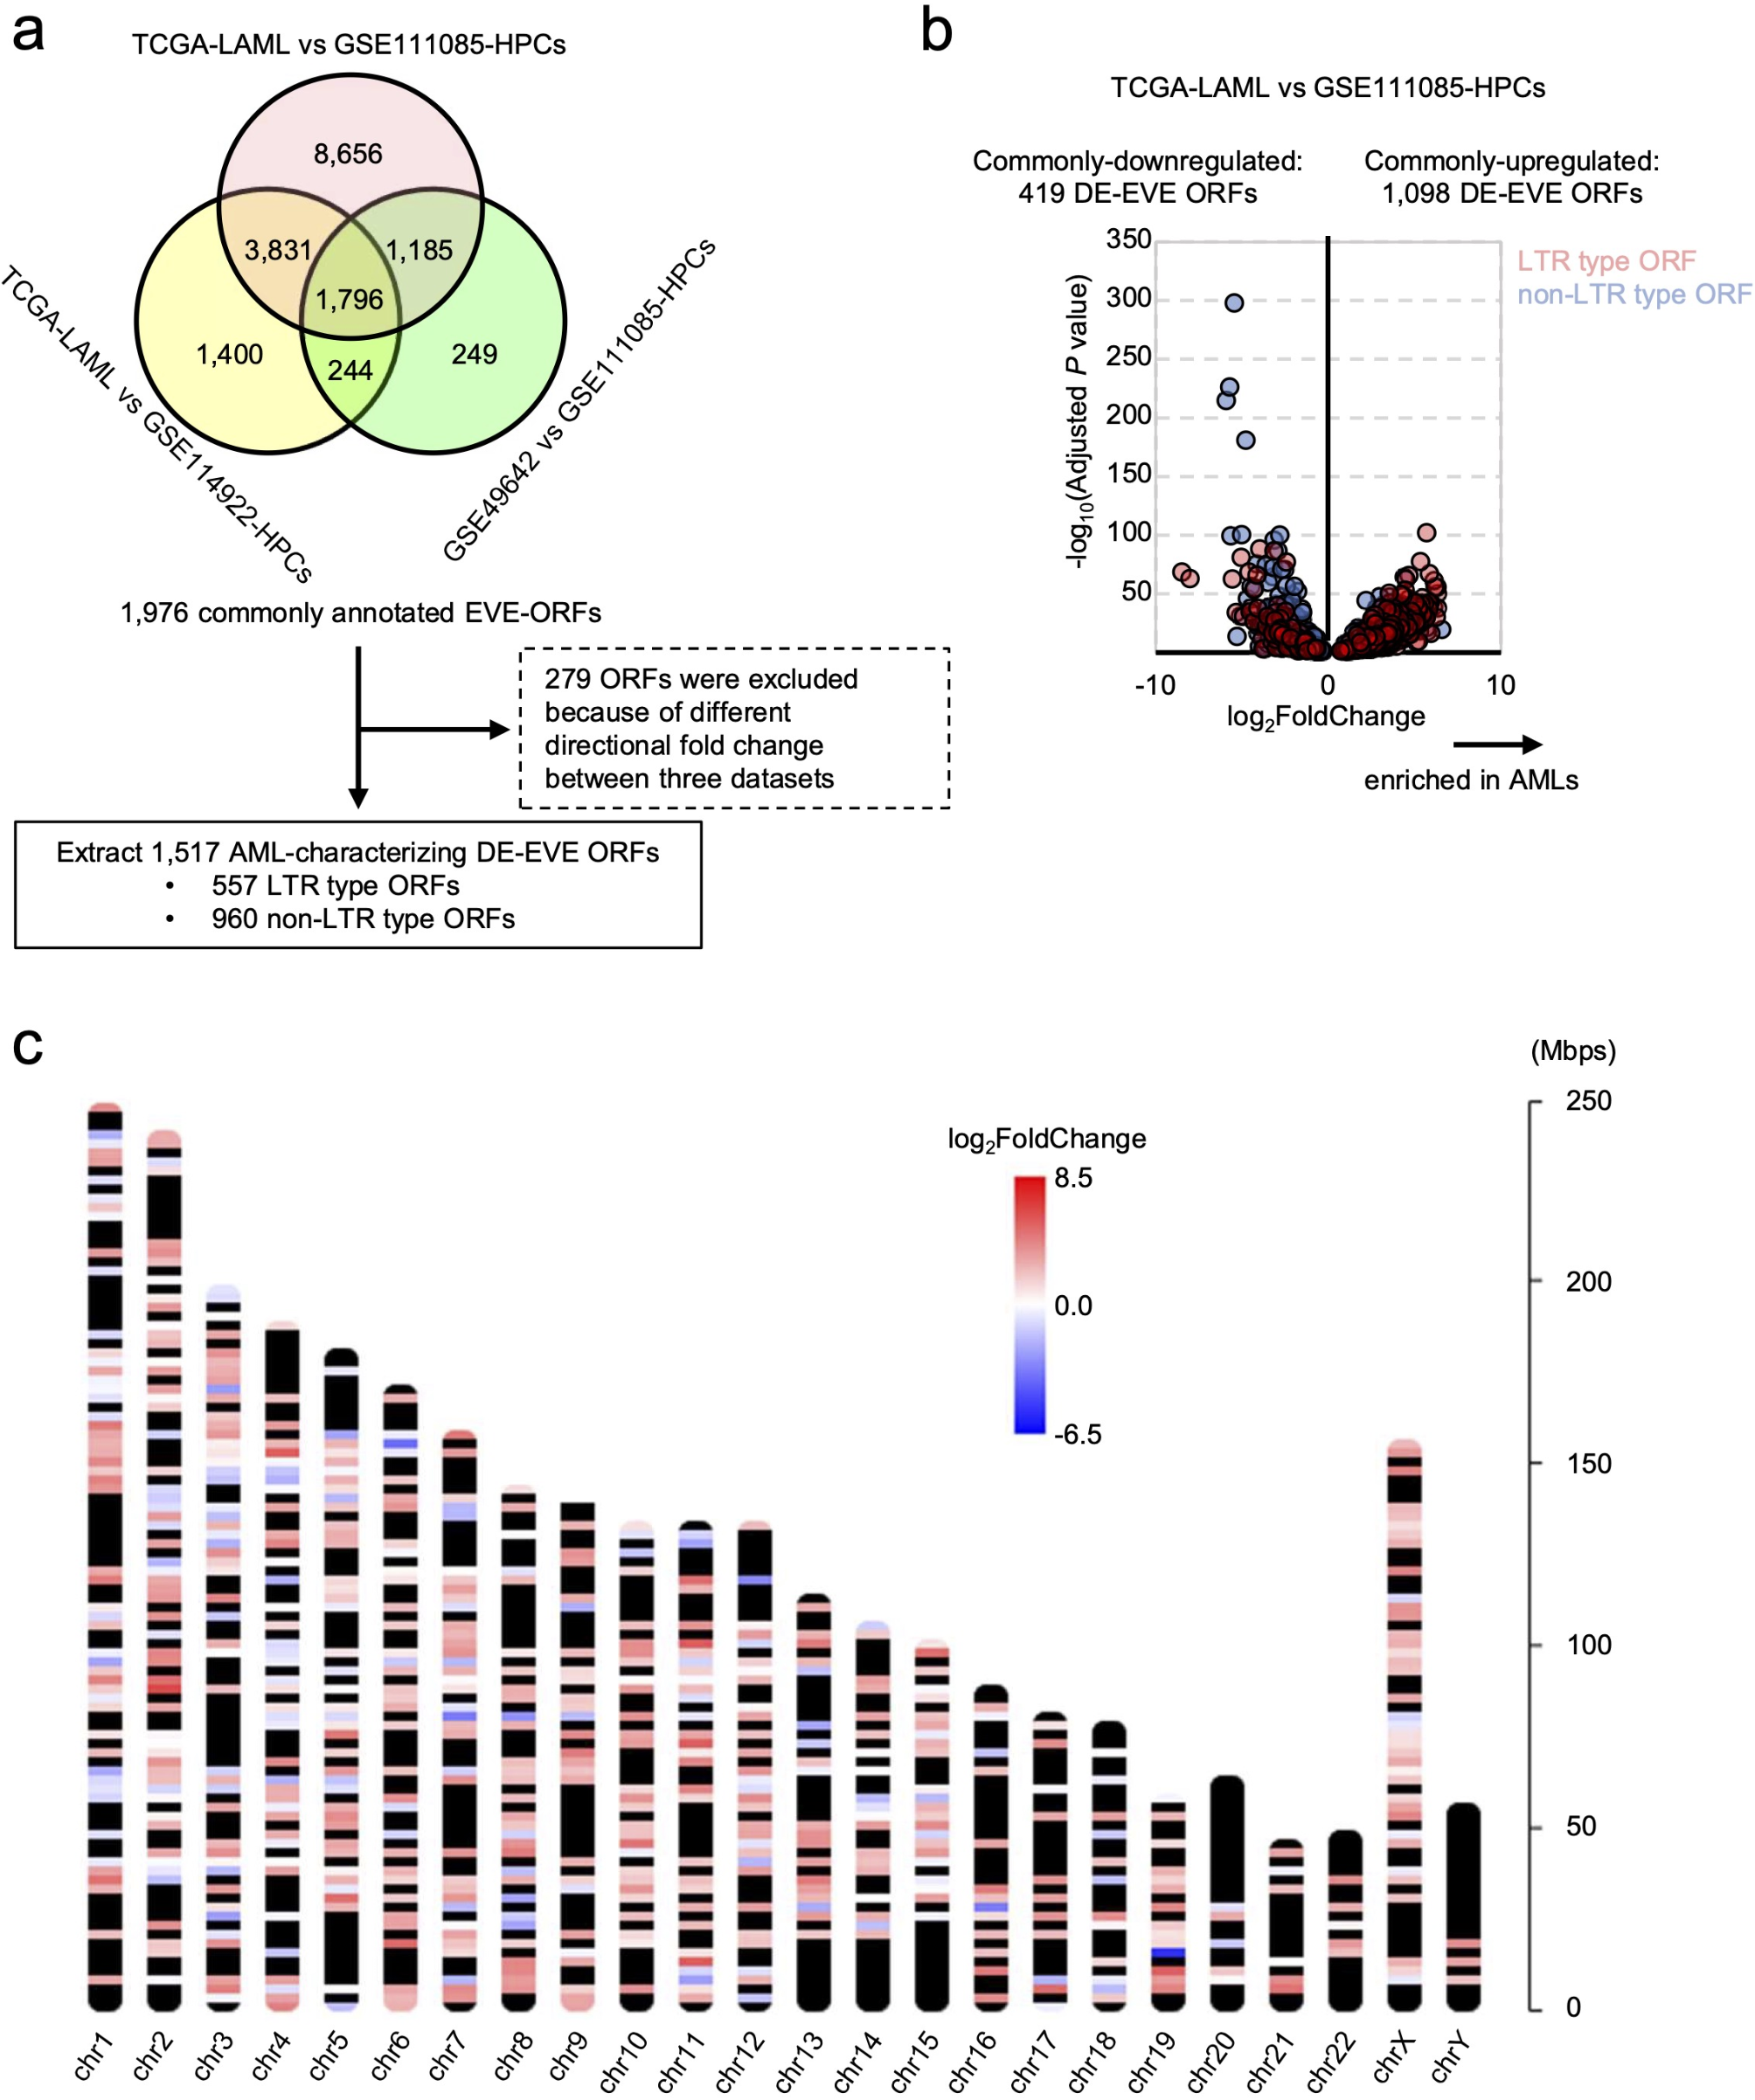
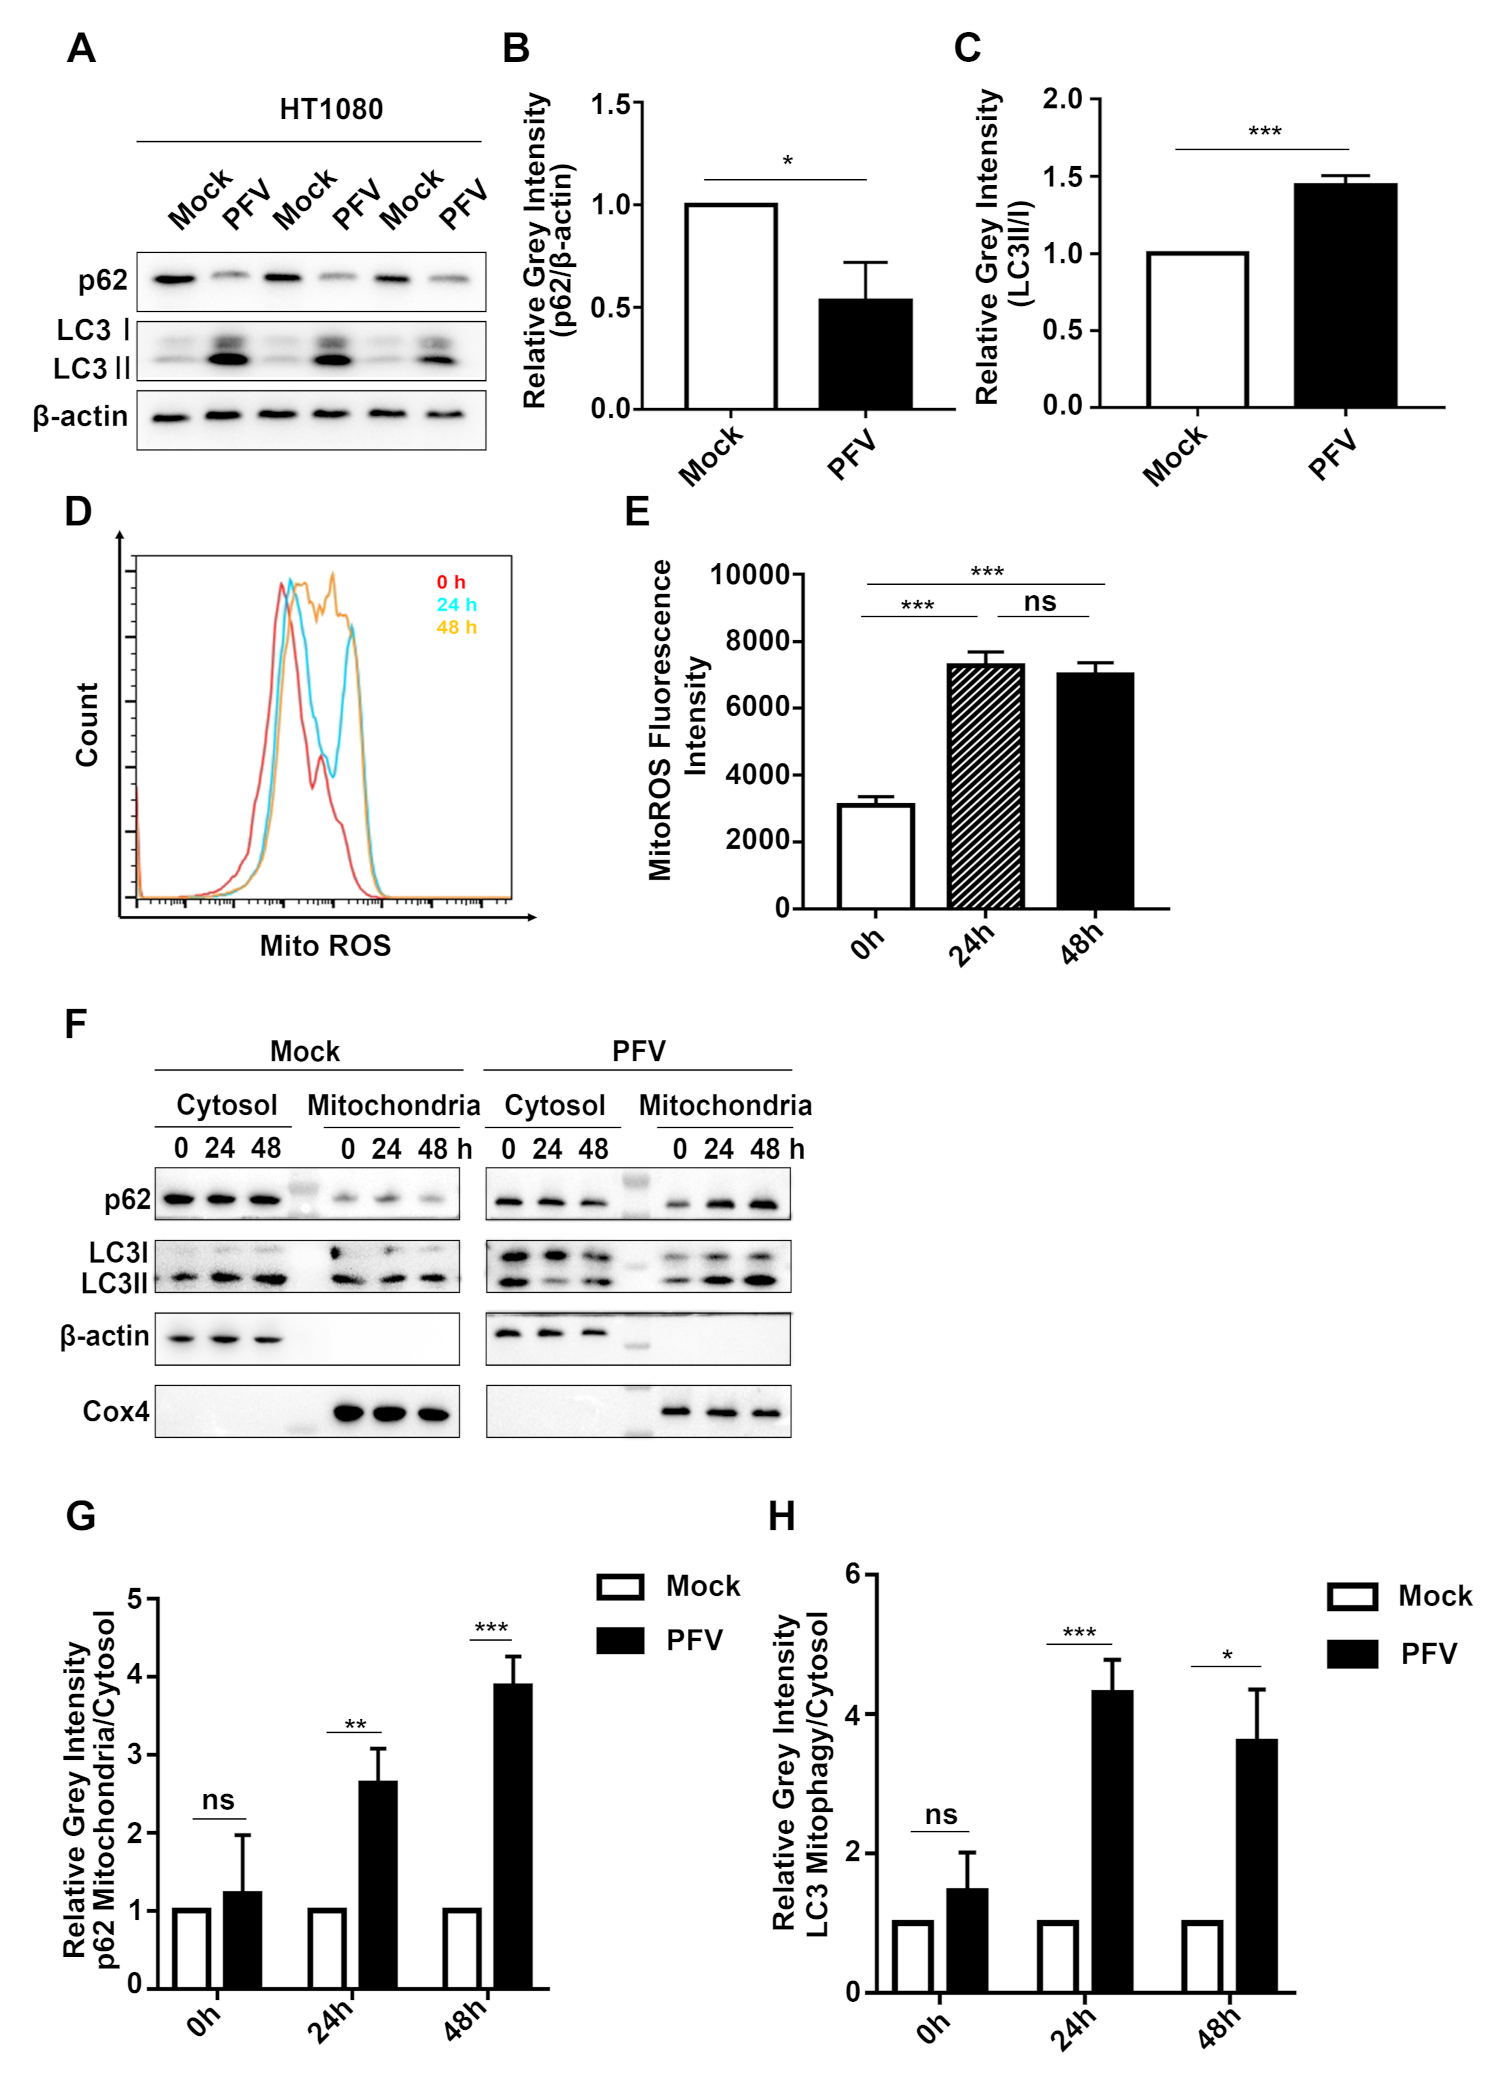


Our previous study have revealed PFV infection induces autophagy [24]. After infecting its susceptible cell line HT1080 with PFV for 48 h, we found that PFV infection promoted LC3 lipidation (Fig. 1A, C, ***p < 0.001) and p62 degradation (Fig. 1A, B, *p < 0.05) compared to Mock, which indicate that PFV infection indeed promotes autophagy. Mitochondria reactive oxygen species (mtROS) are involved in regulating immune response and autophagy related signaling pathways [25]. Mitochondrial damage leads to the increase of mtROS. Next, we explored whether PFV infection can lead to mitochondrial damage. We examined mtROS levels in HT1080 cells post-infection. As predicted, mtROS increased significantly at both 24 and 48 h after PFV infection (Fig. 1D, E, ***p < 0.001). Regards that damaged mitochondria may promote p62-mediated autophagic clearance (mitophagy), we reasoned that PFV might induce mitophagy. Since mitophagy leads to an increase in the mitochondrial-to-cytosolic ratios of LC3 and p62, we infected HT1080 cells with PFV at different time points, extracted mitochondria after cell collection, and detected the changes of p62 and LC3 protein levels in cytoplasm and mitochondria by western blot. Compared to the Mock group, the mitochondrial-to-cytosolic ratios of p62 (Fig. 1F, G, **p < 0.01) and LC3 (Fig. 1F, H, ***p < 0.001) were significantly increased in PFV-infected cells at 24 h. At 48 h post-infection, the mitochondrial-to-cytosolic ratios of p62 (Fig. 1F, G, ***p < 0.001) and LC3 (Fig. 1F, H, *p < 0.05) further increased compared to the Mock group. These data suggest that PFV infection induce mitophagy.
Fig. 1
(A) HT1080 cells were treated with Mock or PFV (MOI = 0.5) for 48 h. Western blotting was performed to assess changes in the levels of p62 and LC3 II/I proteins. (B-C) Statistical analysis of the relative gray intensity of p62 and LC3 II/I was conducted, using Student’s t-test (n = 3, ***p < 0.001, *p < 0.05). (D) Following PFV infection of HT1080 cells at various time points (0 h, 24 h, 48 h), cells were incubated with 5 µM MitoSOX, protected from light, for 10 min. Fluorescence intensity changes were quantitatively analyzed using flow cytometry. (E) Statistical analysis of MitoSOX ROS fluorescence intensity is shown (n = 4, ***p < 0.001, ns p > 0.05). (F) After PFV infection of HT1080 cells for 0 h, 24 h, and 48 h, mitochondrial isolation was performed, and Western blotting was used to evaluate changes in p62 and LC3 II/I protein levels in both cytoplasmic and mitochondrial fractions. (G-H) The ratios of p62 and LC3 II/I protein content in the cytoplasm versus their respective content in mitochondria were statistically analyzed (Student’s t-test, n = 3, ***p < 0.001, **p < 0.01, *p < 0.05)
PFV gag induces mitochondrial damageRetroviral Gag proteins play a crucial role in regulating the cell membrane system [26]. Our previous studies have found that PFV Gag interacts with Alix to promote endosomal associated autophagy [24], leading us to hypothesize that Gag plays a similar role in mitophagy. First, we investigated whether PFV Gag causes mitochondrial damage. Given that mitochondrial damage leads to mtROS production and the loss of mitochondrial membrane potential (Δψm), we assessed the alterations in mtROS levels and mitochondrial membrane potential following PFV Gag overexpression. In 293T cells with PFV Gag overexpression, we found that mtROS increased significantly and mitochondrial membrane potential decreased significantly compared to control (Fig. 2A-D, **p < 0.01). To further confirm that PFV Gag causes mitochondrial damage, we examined mtDNA release. The result show that PFV Gag promotes mtDNA release into the cytoplasm in a dose-dependent manner (Fig. 2E). In comparison to the control group transfected with empty vector, the release of mtDNA following transfection with 2 µg of the pCDNA6.0-His-Gag plasmid increased by 2.9-fold (Fig. 2E, **p < 0.01). The release of mtDNA after transfection with 4 µg of the pCDNA6.0-His-Gag plasmid increased by 7.4-fold (Fig. 2E, ***p < 0.001), while transfection with 8 µg of the pCDNA6.0-His-Gag plasmid resulted in a 6.7-fold increase in mtDNA release (Fig. 2E, ***p < 0.001). These data suggest that PFV Gag causes mitochondrial damage.
Fig. 2
(A-B) HEK293T cells were transfected with pCDNA6.0-His-Gag plasmid for 48 h, followed by incubation with 500 nM MitoSOX (protected from light) for 10 min. Changes in fluorescence intensity were quantitatively analyzed using flow cytometry (n = 3, **p < 0.01). (C-D) The effects of Gag protein on mitochondrial membrane potential were assessed by transfecting HEK293T cells with pCDNA6.0-His-Gag plasmid for 48 h. Cells were then incubated with TMRM at 37 °C for 30 min, washed with PBS, and fluorescence intensity of 200 nM TMRM was quantitatively measured using flow cytometry (n = 3, **p < 0.01). (E) HEK293T cells were transfected with varying doses (2 µg, 4 µg, 8 µg) of pCDNA6.0-His-Gag plasmid for 48 h. Mitochondrial isolation was performed, and DNA was extracted from the cytoplasm. The content of cytochrome C oxidase I (encoded by mitochondrial DNA) was analyzed as a measure of mitochondrial DNA content, with 18 S rRNA (encoded by nuclear DNA) serving as an internal reference for real-time PCR detection (n = 4, **p < 0.01, ***p < 0.001)
PFV gag induces mitophagySince PFV Gag induces mitochondrial damage, we next explored whether PFV Gag causes mitophagy. Compared with the control group transfected with empty vector, transfection with 400 ng pCDNA6.0-His-Gag plasmid resulted in an average increase of LC3 lipidation by 2-fold and an average decrease of p62 by 0.5-fold (Fig. 3A-C, *p < 0.05). Furthermore, transfection with 800 ng pCDNA6.0-His-Gag plasmid resulted in an average increase of LC3 lipidation by 2.7-fold (Fig. 3A, C, *p < 0.05) and an average decrease of p62 by 0.7 times (Fig. 3A, B, **p < 0.01). PFV Gag promotes LC3 lipidation and p62 degradation in a dose-dependent manner (Fig. 3A-C). Cell isolation analysis showed compared with the control group transfected with empty vector, the mitochondrial-to-cytosolic ratios of p62 and LC3 in cells transfected with 4 µg of the pCDNA6.0-His-Gag plasmid increased by 3.6 times (Fig. 3D, E, **p < 0.01) and 2.2 times (Fig. 3D, F, *p < 0.05) respectively. In cells transfected with 8 µg Gag plasmid, the mitochondrial-to-cytosolic ratios of p62 increased by 11.7 times (Fig. 3D, E, **p < 0.01) and the mitochondrial-to-cytosolic ratios of LC3 increased by 3 times (Fig. 3D, F, **p < 0.01). In conclusion, the mitochondrial-to-cytosolic ratios of p62 and LC3 increased in a dose-dependent manner in cells overexpressed PFV Gag (Fig. 3D-F). This suggests that PFV Gag facilitates the translocation of LC3 and p62 from the cytoplasm to mitochondria.
Fig. 3-1
(A) HEK293T cells were seeded in 12-well plates and transfected with pcDNA6.0 (empty vector) or pCDNA6.0-His-Gag plasmid at doses of 200 ng, 400 ng, and 800 ng for 48 h. Western blot analysis was performed to assess changes in p62 and LC3 II/I levels. (B-C) Statistical analysis of p62 and LC3 II/I protein expression changes (Student’s t-test, n = 3, *p < 0.05, **p < 0.01, ns p > 0.05). (D) HEK293T cells (approximately 5 × 10⁷ per dish) were transfected with pcDNA6.0 (empty vector) or pCDNA6.0-His-Gag plasmid (2 µg, 4 µg, 8 µg) for 48 h. Mitochondrial isolation was performed, and Western blot analysis detected changes in p62 and LC3 II/I levels in both cytoplasm and mitochondria. (E-F) Statistical analysis of p62 and LC3 II/I protein expression changes (n = 3, *p < 0.05, **p < 0.01, ns p > 0.05). (G) HEK293T cells were transfected with a double fluorescent label plasmid (mCherry-GFP-LC3). After 24 h, cells were divided into three groups: negative control (transfected with empty vector), positive control (starved with HBSS), and experimental group (transfected with pCDNA6.0-His-Gag plasmid). After 48 h, co-localization of LC3 and Tom20 was analyzed using confocal microscopy. Scale bar = 25 μm. (H) Statistical analysis of the co-localization of LC3 and Tom20 (Student’s t-test, n = 30, **p < 0.01, ***p < 0.001)
Fig. 3-2
(I) Statistical analysis of the fluorescence intensity of Tom20 (Student’s t-test, n = 30, *p < 0.05) (J) After constructing a shAtg5 plasmid to knock down Atg5, HEK293T cells were cotransfected with the shAtg5 and pCDNA6.0-His-Gag plasmid for 48 h. The protein expression levels of Tom20 and Cox4 in the cell lysate were subsequently detected. (K-L) Statistical analysis of Tom20 and Cox4 protein expression levels was performed (One-way ANOVA, n = 3, *p < 0.05, **p < 0.01, ns p > 0.05)
Tom20, a core component of the mitochondrial outer membrane translocase complex, serves as a critical marker for mitophagy activation, as its decreased protein levels directly reflect the initiation of mitochondrial clearance [27]. Next, we used confocal microscopy to detect the co-localization of autophagy marker LC3 and mitochondrial outer membrane protein Tom20 to determine the formation of mitophagosomes. We used Hank’s Balanced Salt Solution (HBSS) treated cells as positive controls and empty vector transfected cells as negative controls. Confocal microscopy confirmed that LC3 and Tom20 co-localization increased in cells overexpressed PFV Gag compared with empty vector transfected cells. (Fig. 3G, H, **p < 0.01). Furthermore, compared with the control group transfected with the empty vector, the fluorescence intensity of Tom20 in the cells transfected with PFV Gag decreased (Fig. 3G, I, *p < 0.05).
Cox4, serving as a subunit of mitochondrial respiratory chain complex IV, is specifically localized to the inner membrane of mitochondria. Its abundance exhibits alterations concomitant with the degradation of mitochondria [28]. Atg5 is essential for autophagosome elongation, and its depletion blocks autophagic flux by preventing LC3 lipidation [29]. To further confirm that PFV Gag induces mitophagy, we detected the levels of mitochondrial proteins Cox4 and Tom20 in PFV Gag overexpressed cells under the condition of Atg5 knockdown. The results showed that both Tom20 (Fig. 3J, K, *p < 0.05) and Cox4 (Fig. 3J, L, **p < 0.01) were reduced in cells that overexpressed PFV Gag, and knocking down Atg5 reversed the reduction of Cox4 and Tom20 caused by PFV Gag to a certain extent (Fig. 3J-L), indicating that knocking down Atg5 inhibited the process of mitophagy. Collectively, these findings indicate that PFV Gag induces mitophagy, a form of mitochondria-specific autophagy.
PFV gag induces mitophagy in a Parkin-dependent mannerFurthermore, we explored the mechanism of mitophagy induced by PFV Gag. The expression of Parkin (Fig. 4A, C, **p < 0.01) and PINK1 (Fig. 4A, B, **p < 0.01) is significantly increased in cells overexpressed PFV Gag. To further confirm Parkin is essential for PFV Gag induced mitophagy, the level of mitochondrial proteins Cox4 and Tom20 in PFV Gag overexpressed cells was examined in the condition of Parkin knockdown. After overexpression of PFV Gag, Cox4 (Fig. 4D, F, **p < 0.01) and Tom20 (Fig. 4D, E, *p < 0.05) were reduced, and Parkin knockdown reversed the decrease of Cox4 and Tom20 induced by PFV Gag (Fig. 4D-F). Confocal results showed that the co-localization of LC3 and Tom20 was reduced after Parkin knockdown in PFV Gag overexpressed cells compared to control (Fig. 4G, H, ***p < 0.001). These results suggest that PFV Gag induces Parkin-dependent mitophagy.
Fig. 4
(A-C) pCDNA6.0-His-Gag plasmid was transfected into HEK293T cells, and mitochondria were extracted after 48 h. Changes in the protein levels of Parkin and PINK1 in the mitochondria were detected by Western blot and statistically analyzed (n = 3, *p < 0.05, **p < 0.01, ns p > 0.05). (D) shRNA targeting endogenous Parkin was transfected into HEK293T cells for 24 h, followed by transfection with pCDNA6.0-His-Gag plasmid for an additional 48 h. Cell lysates were collected to extract protein, and Western blot analysis was performed to detect changes in Tom20 and Cox4. (E-F) Statistical analysis of Tom20 and Cox4 protein expression changes (n = 3, *p < 0.05, **p < 0.01, ns p > 0.05). (G) Following the transfection of shPark2 to knock down endogenous Parkin in HEK293T cells, mCherry-GFP-LC3 and pCDNA6.0-His-Gag plasmid were cotransfected. The co-localization of LC3 and Tom20 was analyzed using confocal microscopy. (H) Statistical analysis of the co-localization of LC3 and Tom20. Scale bar = 10 μm. (***p < 0.001)
PFV gag promotes Parkin-dependent mitophagy by upregulating Rab5aMany Rab proteins have been reported to be involved in the formation of autophagosomes [30]. Among them, Rab5a is involved in a variety of antiviral immune reactions and is essential for early endosome formation [31]. It is interesting to determine whether Gag affects the expression of Rab5a. Both mRNA (Fig. 5A, ***p < 0.001) and protein levels (Fig. 5B, C, **p < 0.01) of Rab5a were increased in cells overexpressed PFV Gag. Subsequently, we investigated the role of Rab5a in PFV Gag induced mitophagy. Our results indicated that the overexpression of PFV Gag or Rab5a led to the degradation of p62, increased lipidation of LC3, and a reduction in Tom20 levels compared to the control group. Furthermore, knocking down Rab5a was found to reverse the PFV Gag induced degradation of p62, lipidation of LC3, and decrease in Tom20 (Fig. 5D-G). Cell isolation analysis demonstrated that, in comparison to the control group transfected with empty vector, the accumulation of p62 (Fig. 5H, I, **p < 0.01) and LC3 (Fig. 5H, J, *p < 0.05) on mitochondria was significantly higher in cells overexpressed PFV Gag. Similarly, cells overexpressed Rab5a also exhibited increased levels of p62 (Fig. 5H, I, ***p < 0.001) and LC3 (Fig. 5H, J, **p < 0.01) in mitochondria. Importantly, the knockdown of Rab5a negated the PFV Gag induced increases in LC3 and p62 levels within the mitochondria. (Fig. 5H-J). These results indicate that PFV Gag promotes mitophagy by upregulating Rab5a.
Fig. 5
(A) After 48 h of transfection with pCDNA6.0-His-Gag plasmid in HEK293T cells, real-time PCR was performed to detect changes in Rab5a mRNA levels. (B, C) Western blot analysis revealed changes in Rab5a protein levels following 48 h of transfection with pCDNA6.0-His-Gag plasmid in HEK293T cells (**p < 0.01, ***p < 0.001). (D) HEK293T cells were transfected with pcDNA6.0 (empty vector), pCDNA6.0-His-Gag plasmid, Rab5a expression plasmid, shRNA targeting Rab5a, or cotransfected with pCDNA6.0-His-Gag plasmid and shRNA targeting Rab5a. Cell lysates were collected, proteins extracted, and Western blotting was used to detect changes in p62, LC3 II/I, and Tom20. (E-G) Statistical analysis of p62, Tom20, and LC3 II/I protein levels (n = 3, *p < 0.05, **p < 0.01, ***p < 0.001, ns p > 0.05). (H) Following the same transfection as in (D), cells were collected for mitochondrial isolation. Proteins in mitochondria were extracted, and Western blot analysis was performed to assess changes in p62 and LC3 II/I in cytoplasm and mitochondria. (I-J) Statistical analysis of changes in p62 and LC3 II/I in cytoplasmic mitochondria. (Student’s t-test, n = 3, *p < 0.05, **p < 0.01, ***p < 0.001, ns p > 0.05)
Comments (0)