
Remember me
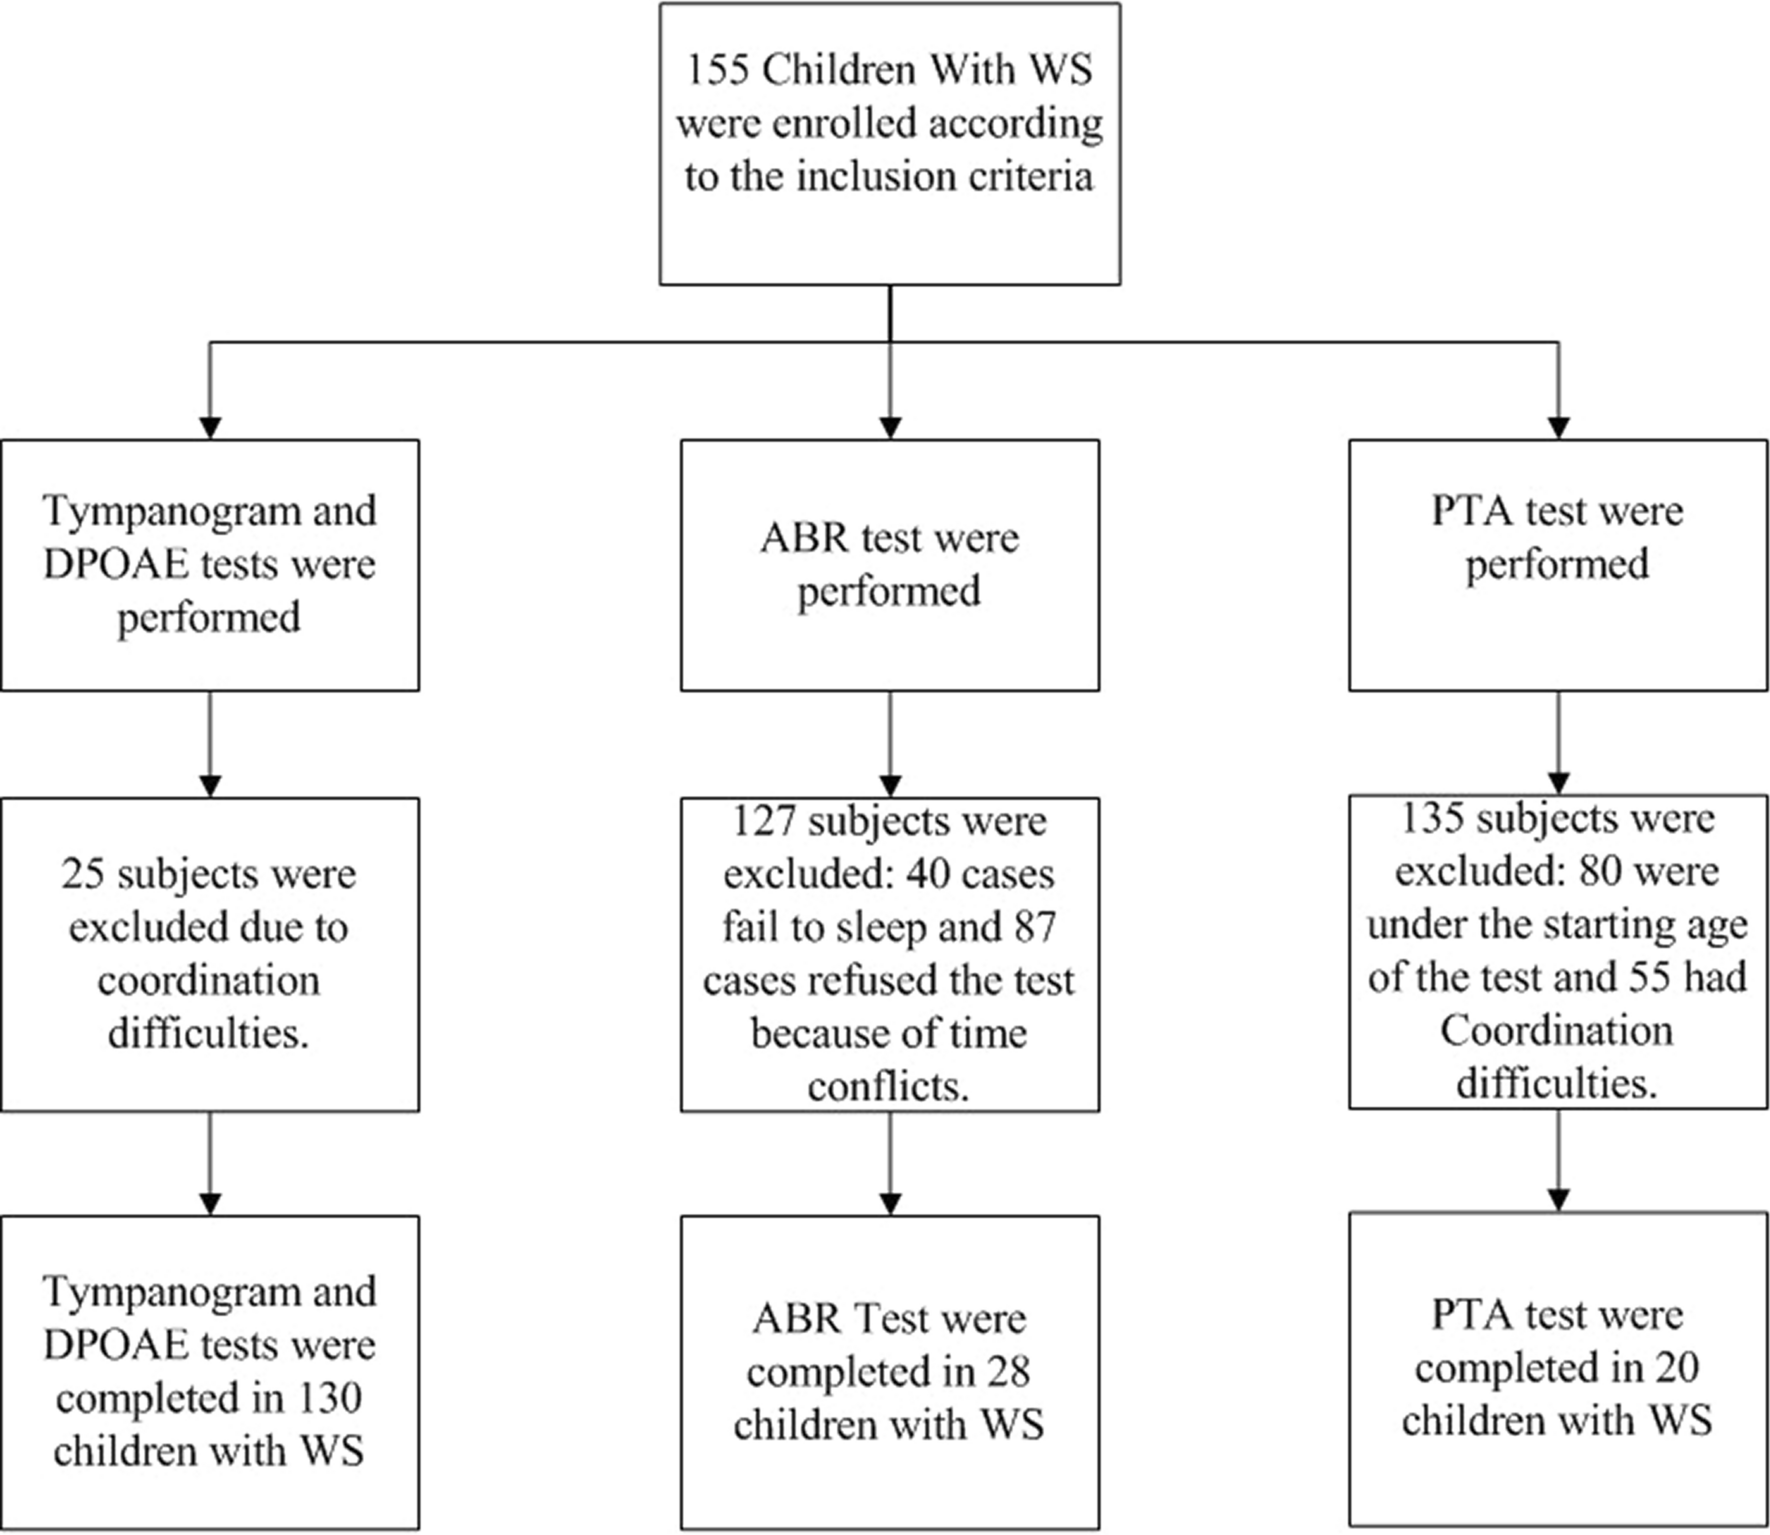


In tympanogram and DPOAE test, there were 155 cases meeting the inclusion criteria of WS group, and 25 cases with difficulty in cooperation were excluded, 130 cases with 260 ears completed the two tests, the median age is 5.1 years old (ranging from 1.0 to 12.4). 135 children were matched as the control group, and 5 of them with difficulty in cooperation were excluded, 130 children with 260 ears completed the tympanogram and DPOAE test, the median age is 5.3 years old (ranging from 0.8 to 13.1 years). With the ABR test, 40 cases fail to complete the test due to sleep failure, 87 cases refused the test because of time conflicts. 28 cases with a total of 56 ears completed ABR test, the median age is 2.1 years old (ranging from 0.7 to 5.2 years). while in the control group, 18 cases fail to complete the test due to sleep failure. 73 cases refused the test because of time conflicts. 44 cases with a total of 88 ears completed ABR test, the median age is 2.2 years old (ranging from 0.4–5.2 years). The PTA test asks children to raise their hands when they hear a sound, no matter how soft it is. This is very difficult for children with WS because of their cognitive difficulties. Therefore, this study only recruited 20 cases with 40 ears because of above reasons, the median age is 8.5 years old (ranging from 5.9 to 13.7 years). While in the control group, 28 cases with 56 ears completed the PTA test, the median age is 8.4 years old (ranging from 5.9 to 12.15 years). See Table 1 for details. Figures 1 and 2 show the subject enrolment and exclusions for two groups.
Table 1 Patient characteristics with different audiology testFig. 1
The process of subject enrollment and exclusions in the study group
Fig. 2
The process of subject enrollment and exclusions in the control group
Comparison of tympanogram passing rate between WS and control groupThe passing rates of tympanogram in WS and control group were 69.6% (181/260) and 88.8% (231/260) respectively, with statistically significant (χ2 = 29.21, p < 0.001). The passing rate was 71.9% (46/64) and 85.7% (72/84) respectively in the < 3 yrs age group, with statistical significance (χ2 = 4.30, p = 0.038). The passing rate was 67.3% (66/98) and 85.8% (103/120) respectively in the 3–5 yrs age group, with statistical significance (χ2 = 10.58, p = 0.001). The passing rate was 70.40% (69/98) and 100% (56/56) respectively in the group ≥ 6 yrs old, with statistical significance (χ2 = 29.95, p < 0.001).
There was no significant difference in tympanogram passing rate among different age groups in children with WS (p > 0.05), while the difference was found in the control group (χ2 = 11.92, p = 0.002). The passing rate of ≥ 6 yrs age group was significantly higher than that of < 3 yrs age group and 3–5 yrs age group (χ2 = 13.00, p = 0.002, χ2 = 13.85, p = 0.001, respectively). No significant difference was found between the other age groups.
Comparison of DPOAE passing rate between WS and control groupThe passing rates of DPOAE in WS and control group were 73.5% (191/260) and 98.5% (256/260) respectively, with statistically significant (χ2 = 65.27, p < 0.001). The passing rate was 79.7% (51/64) and 100% (84/84) respectively in the < 3 yrs age group, with statistically significant (χ2 = 23.46, p < 0.001). The passing rate was 69.4% (68/98) and 96.7% (116/120) respectively in the 3–5 yrs age group, with statistical significance (χ2 = 28.45, p < 0.001). The passing rates were 73.5% (72/98) and 100% (56/56) respectively in the ≥ 6 yrs age group, with statistical significance (χ2 = 26.44, p < 0.001). There was no significant difference in DPOAE passing rate among different age groups, neither in WS nor control group (p > 0.05).
Comparison of DPOAE passing rate between WS and control group in cases with passing tympanogramIn this part, 79 ears in WS group and 29 ears in control group failed passing the tympanogram were excluded. The DPOAE passing rate was 89.0% (161/183) and 99.6% (227/231) respectively after exclusion, with statistically significant (χ2 = 21.19, p < 0.001). The passing rate was 89.1% (41/46) and 100% (70/70) respectively in the < 3 yrs age group, with statistical significance (χ2 = 9.59, p = 0.009). The passing rate was 89.4% (59/66) and 99% (101/102) respectively in 3–5 yrs age group, with statistical significance (χ2 = 6.20, p = 0.013). The passing rate was 88.4% (61/69) and 100% (56/56), respectively in the group ≥ 6 yrs old, with statistical significance (χ2 = 9.95, p = 0.008). There was no significant difference in DPOAE passing rate among different age groups, neither in WS nor control group (p > 0.05).
Comparison of DPOAE SNR between WS and control groups in cases with passing tympanogram and DPOAEIn this part, cases didn’t pass either tympanogram or DPOAE were excluded, resulting in 161 ears in the WS group and 226 ears in the control group. It was found that the SNR of 2000, 3000, 4000, 5000 Hz were statistically lower in WS group (p < 0.05), and in all age groups. There was no difference in WS group of SNR among different age groups, while the SNR of the control group over 3 yrs old was higher than that of the group under 3 yrs old. See Table 2 for the details.
Table 2 Comparison of SNR between WS and control group (dB)Change in the passing rate of retestTympanogram and DPOAE reexamination were performed in 25 WS patients in the following 1 years, with a total of 50 ears. The first examination age was 4.6 (1.0–7.9) yrs old, and the reexamination age was 5.8 (2.3–9.8) yrs old.
In the tympanogram test, 15 ears were both abnormal in the two visits, 21 ears were both passing, 8 ears changed from passing to abnormal, and 6 ears changed from abnormal to passing. The passing rate was 58% (29/50) and 54% (27/50) respectively, with no difference (p > 0.05). In DPOAE test, 11 ears were both abnormal in the two visits, 29 ears were both passing. 7 ears changed from passing to abnormal, and 3 ears changed from abnormal to passing. The passing rate was 74% (36/50) and 64% (32/50), respectively with no difference (p > 0.05).
Comparison of ABR results between WS and control group28.6% (16/56) and 4.5% (4/88) was found abnormal ABR in WS and control group respectively, with statistical difference (χ2 = 14.57, p < 0.001). The threshold of ABR is 17.5(10,38.8) dB nHL in the WS group, significantly higher than that in the control group [15(10,20) dB nHL, Z = −3.22, p = 0.001]. Since ABR results were easily affected by the function of the middle ear and cochlea, data with either tympanogram refer, DPOAE refer, ABR threshold greater than 30 dB nHL were excluded when analyzing ABR latency results. The number of ears were 32 and 84 in WS and control group after exclusions, respectively. It was found that the latency of wave I and III and the interpeak latency I-III in WS group were significantly longer than that in control group (p < 0.05), and the interpeak latency III-V was significantly shorter than that in control group (p < 0.05). See Table 3 for the details.
Table 3 The comparison in ABR latency and interpeak latency between WS group and the control group (ms)Comparison of PTA results between WS and control group50% (20/40) in WS group were found with HL, with CHL in 60% (12/20), SNHL in 20% (4/20), MHL in 20% (4/20). And among these people, 65% (13/20) of HL were mild, 25% (5/20) were moderate, 5% (1/20) was moderate-severe, 5% (1/20) was severe. 3.6% (2/56) in the control group were found HL and all were mild. The incidence rate of HL was statistical difference when compare with WS group (χ2 = 25.91, p < 0.001). The threshold of 250–8000 Hz in WS group were significantly higher than that in control group (p < 0.05), either in air or bone conduction test. The mean air–bone gap in WS group were significantly higher than that in control group (p < 0.05). The comparison of threshold values of 250–8000 Hz between the two groups is shown in the Table 4.
Table 4 Comparison of PTA between WS and control group (dB HL)
Comments (0)