Study context
This study was part of and funded by the Regio Deal Foodvalley (grant nr. 162135). Regio Deal Foodvalley is a collaboration between the Dutch national government and the Foodvalley Region in the Netherlands, which includes eight municipalities in this region in the Netherlands. Renowned for its knowledge and innovation in healthy and sustainable food, the Foodvalley Region is a top region in its field, aiming to accelerate the transition to a sustainable and healthy food system [19]. This study was conducted together with the Netherlands Nutrition Centre, which is an independent organisation for encouraging consumers to make safe, healthy and sustainable food choices, funded by the Ministry of Agriculture, Nature and Food Quality and the Ministry of Health, Welfare and Sport.
Study design
A GMB approach was used, consisting of two GMB workshops that were conducted in October 2023 [15]. This study was conducted according to the guidelines laid down in the Declaration of Helsinki and all procedures involving research study participants were approved by the Social Sciences Ethics Committee (SEC) from Wageningen University. Written informed consent was obtained from all participants.
Participants and recruitment
We aimed to include a diverse range of stakeholders connected to the motorway food environment in the workshops. We first explored the different stakeholder groups through stakeholder analysis utilising the power-interest matrix subject [20]. This power-interest matrix classifies stakeholders into four categories according to the degree of power and interest they have in the subject, allowing exploration of the complexity of stakeholders and their differences in power and interests. Stakeholders identified in the power-interest matrix, along with additional stakeholder groups found through media publications and network exploration, were included in the proposed stakeholder pool. The proposed stakeholder groups included food providers at motorway stops (i.e. roadside restaurants, petrol station shops, fast-food chains), food producers, retail organisations in the petrol industry, suppliers, concept developers, public health organisations, partners of the Foodvalley region, national policymakers, truck drivers, trade organisations groups (for petrol stations, the catering sector, food producers, the transport and logistics sector, employability in transport and logistics and passenger and truck dealers), experts in infrastructure and planning, financial institutions, news platforms of the petrol (food) industry and an expert in fast-charging electric vehicles. Most stakeholders also had firsthand experience as road users themselves, providing valuable insights from both professional and personal perspectives. Employees from these various companies and institutions were invited through cold-calling, cold-mailing and cold-LinkedIn messaging. Additionally, invitations were extended through the research team network, the Netherlands Nutrition Centre and online promotions in sector-specific newsletters and on LinkedIn. A total of 132 invitations were sent to 99 companies and institutions. The invitation requested the presence of an employee, preferably in a management role, who was professionally involved with the motorway food environment, at our workshops. If the initially invited employee could not attend, they were asked to recommend colleagues in the relevant field who could participate. The invitation provided information on the study’s aim and procedure, a link for workshop application and informed participants of financial compensation of fifty euros per hour and coverage of travel expenses for their participation.
Study procedure and data collection
This study used an iterative GMB approach involving two workshops. Participants collectively built a CLD and identified actions to improve motorway food environments. This was followed by further analysis from the research team to refine the CLD, identify leverage points and conduct further analysis of the CLD. Both workshops took place in a central location in the Netherlands and lasted 3 h.
GMB workshop 1
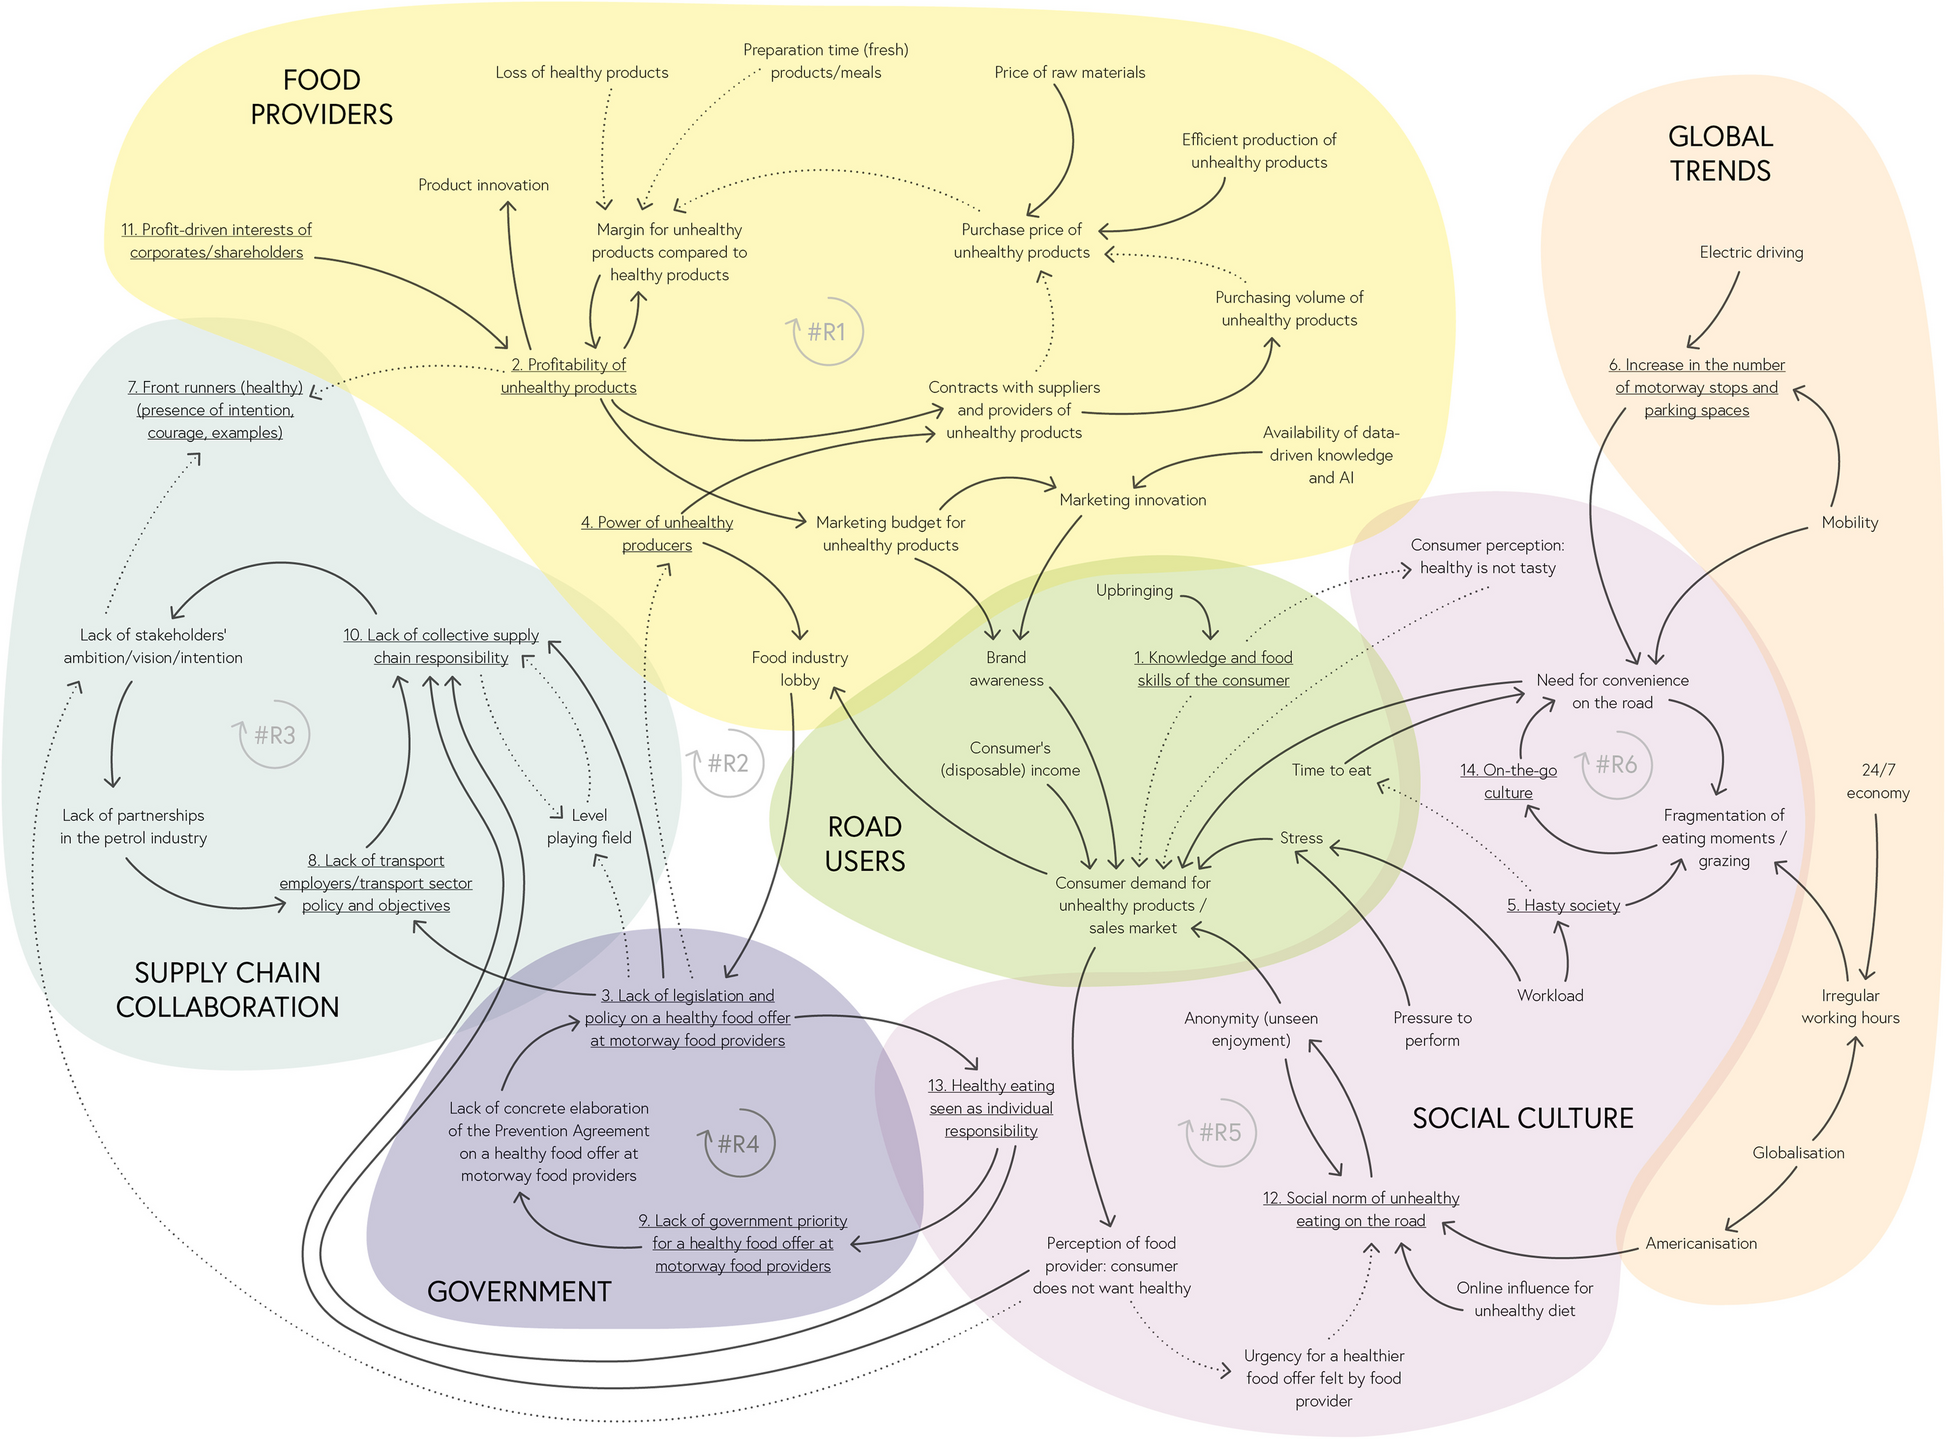
The first GMB workshop aimed to create a CLD, to identify and illustrate the system that contributes to the continued predominance of the unhealthy motorway food environment. This involved identifying the most important factors and their interconnections that shape this system. The workshop started with an introductory opening and explanation of the food environment followed by multiple GMB techniques that were based on scripts [21]. First, the participants individually wrote down their hopes and fears to elicit and establish their expectations for the workshop. These expectations were then briefly discussed in a plenary session. Next, participants were divided into seven groups, each consisting of five to six participants. The groups consisted of participants from different stakeholder groups and were led by a member of the research team who also took notes. First, participants individually identified factors influencing the continued predominance of the unhealthy motorway food environment according to the Graphs Over Time script [21], with all identified factors being documented. Second, participants were instructed to discuss and choose the five most important factors in their group. After this, each group named their most important factors in the plenary session, until a final list of about 20 to 30 factors was reached. In this plenary session, the factors were discussed in terms of their influence on the unhealthy motorway food environment. The discussion concluded by questioning whether these factors were indeed the most important which was confirmed by the group. Third, participants made a connection circle in a plenary session, in which the connections between these factors were identified, resulting in the creation of the concept CLD. Participants were asked to indicate whether connections were either accompanied by a plus (+) or a minus (−) sign. A plus sign indicated that when the initial factor increased, the receiving factor also increased, and similarly when the initial factor decreased the receiving factor also decreased (positive relationship). Contrarily, a minus sign indicates that when the initial factor increased, the receiving factor decreased, or when the initial factor decreased the receiving factor increased (negative relationship) [15]. These factors formed a feedback loop when one factor influenced other factors, either reinforcing (+) or balancing (−), thereby creating a continuous cycle with the initial factor [14]. Whilst these loops represent key dynamics, additional system dynamics may exist. This concept CLD offered a visual overview of the identified factors influencing a complex problem, illustrating the interconnections between these factors and feedback loops according to stakeholders [15, 16]. The full programme of GMB techniques used in workshop 1 can be found in more detail in Supplementary Table 1, Additional file 1. Systems Thinking In Community Knowledge Exchange (STICKE) software was used to form the identified factors and connections into a CLD [22].
The research team present during workshop 1 consisted of eight researchers, in which each team member fulfilled a specific role. Two researchers played the role of facilitator and timekeeper (MP and CD), of which one was also the physical wall builder (MP). Another researcher was the digital wall builder (TW) and the team members were note-takers during the session (LG, JW, SD, FR, TW, MP, WH).
Refinement of CLD and identifying leverage points
After the first workshop, the concept CLD was refined based on the notes of the first workshop by the research team (CD, MP, FR, SD, LG). First, additional factors were added based on factors named by participants in the Graphs Over Time notes. Second, duplicate factors or similar concepts were eliminated and merged. Factors were adjusted to ensure neutral labelling, quantifiability of the factor and changeability of the factor [23]. Furthermore, to simplify the CLD and to prevent the CLD from becoming overloaded with connections, certain direct connections were removed when alternative indirect pathways between these elements existed. Based on the initial CLD and notes, subsystems were identified. After refining the concept CLD, the research team (CD, MP, FR, SD, LG) identified the leverage points [24]. These leverage points were determined through an analysis of the CLD, including factors embedded in feedback loops, factors that were highly connected (e.g. incoming and outgoing connections), or factors that were frequently identified by participants during the first workshop [23]. Subsequently, we aimed to determine the potential impact for systems change of the leverage points. For that purpose, we used the Action Scales Model (ASM) [25]. The leverage points were classified across the four levels of the system, namely events (behaviour and outcomes observed), structures (patterns, relationships, information flows and physical structures), goals (ambitions or targets) and beliefs (attitudes, norms, values). Each of these levels influences how the system functions; however, actions targeted at the deeper levels (goals and beliefs) have a greater likelihood of leveraging system change but they are the most difficult to change [25]. These classifications were for research understanding purposes only and were not explicitly shared with the participants during the GMB workshops.
GMB workshop 2
The second GMB workshop aimed to verify the refined CLD and to identify the most important actions to improve the motorway food environment for each of the identified leverage points. The second GMB workshop consisted of the same eight researchers with the same roles as in the first workshop, however without the role of the wall builders. The workshop started with a brief introduction to the food environment to refresh participants’ memory and explain the subject to newcomers, followed by the workshop’s purpose of the workshop. This was followed by the combination of multiple GMB scripts [21] and additional custom scripts tailored to this specific context (Supplementary Table 1, Additional file 1). During the introduction, the refined CLD and the leverage points were presented to the participants, on which participants were asked for their feedback. Afterward, participants were divided into seven groups of five to six participants from various stakeholder groups to identify actions for two leverage points per group. Groups were assigned these two leverage points, to ensure coverage of all leverage points within the time available. The groups were facilitated by a member of the research team who also took notes. In these groups, participants first individually wrote down actions related to each of these two leverage points, during which they were encouraged to identify actions on different levels of the system, through the explanation and use of the ASM. By doing so we aimed to maximise the likelihood of systems change occurring and ensuring that the actions could be mutually reinforcing [25]. Subsequently, the participants discussed their actions within their group and all actions were documented. The group selected two actions that they believed would most effectively address the identified leverage point. During a final plenary session, all participants were presented with all the identified actions and a summary of the workshop, aimed at providing them with a broader perspective and deeper understanding of the dynamics of this complex system. The workshop concluded by announcing that the results would be documented in both a Dutch report and a scientific English article which would be shared with the participants. The full programme of GMB techniques used in workshop 2 can be found in more detail in Supplementary Table 1, Additional file 1.
CLD and actions refinement
The input of the participants from workshop 2 was incorporated to further refine the CLD in its present form. Furthermore, refinement strategies such as simplification were used similarly to the refinement after workshop 1. Regarding the proposed actions by stakeholders, these were classified according to the ASM. Lastly, the CLD was transferred from STICKE to the software programme Vensim 10.2.0, to visualise feedback loops and was later illustrated for this publication. In this last step, the plus and minus signs on the connections were replaced with solid and dashed lines.


Comments (0)