
Remember me
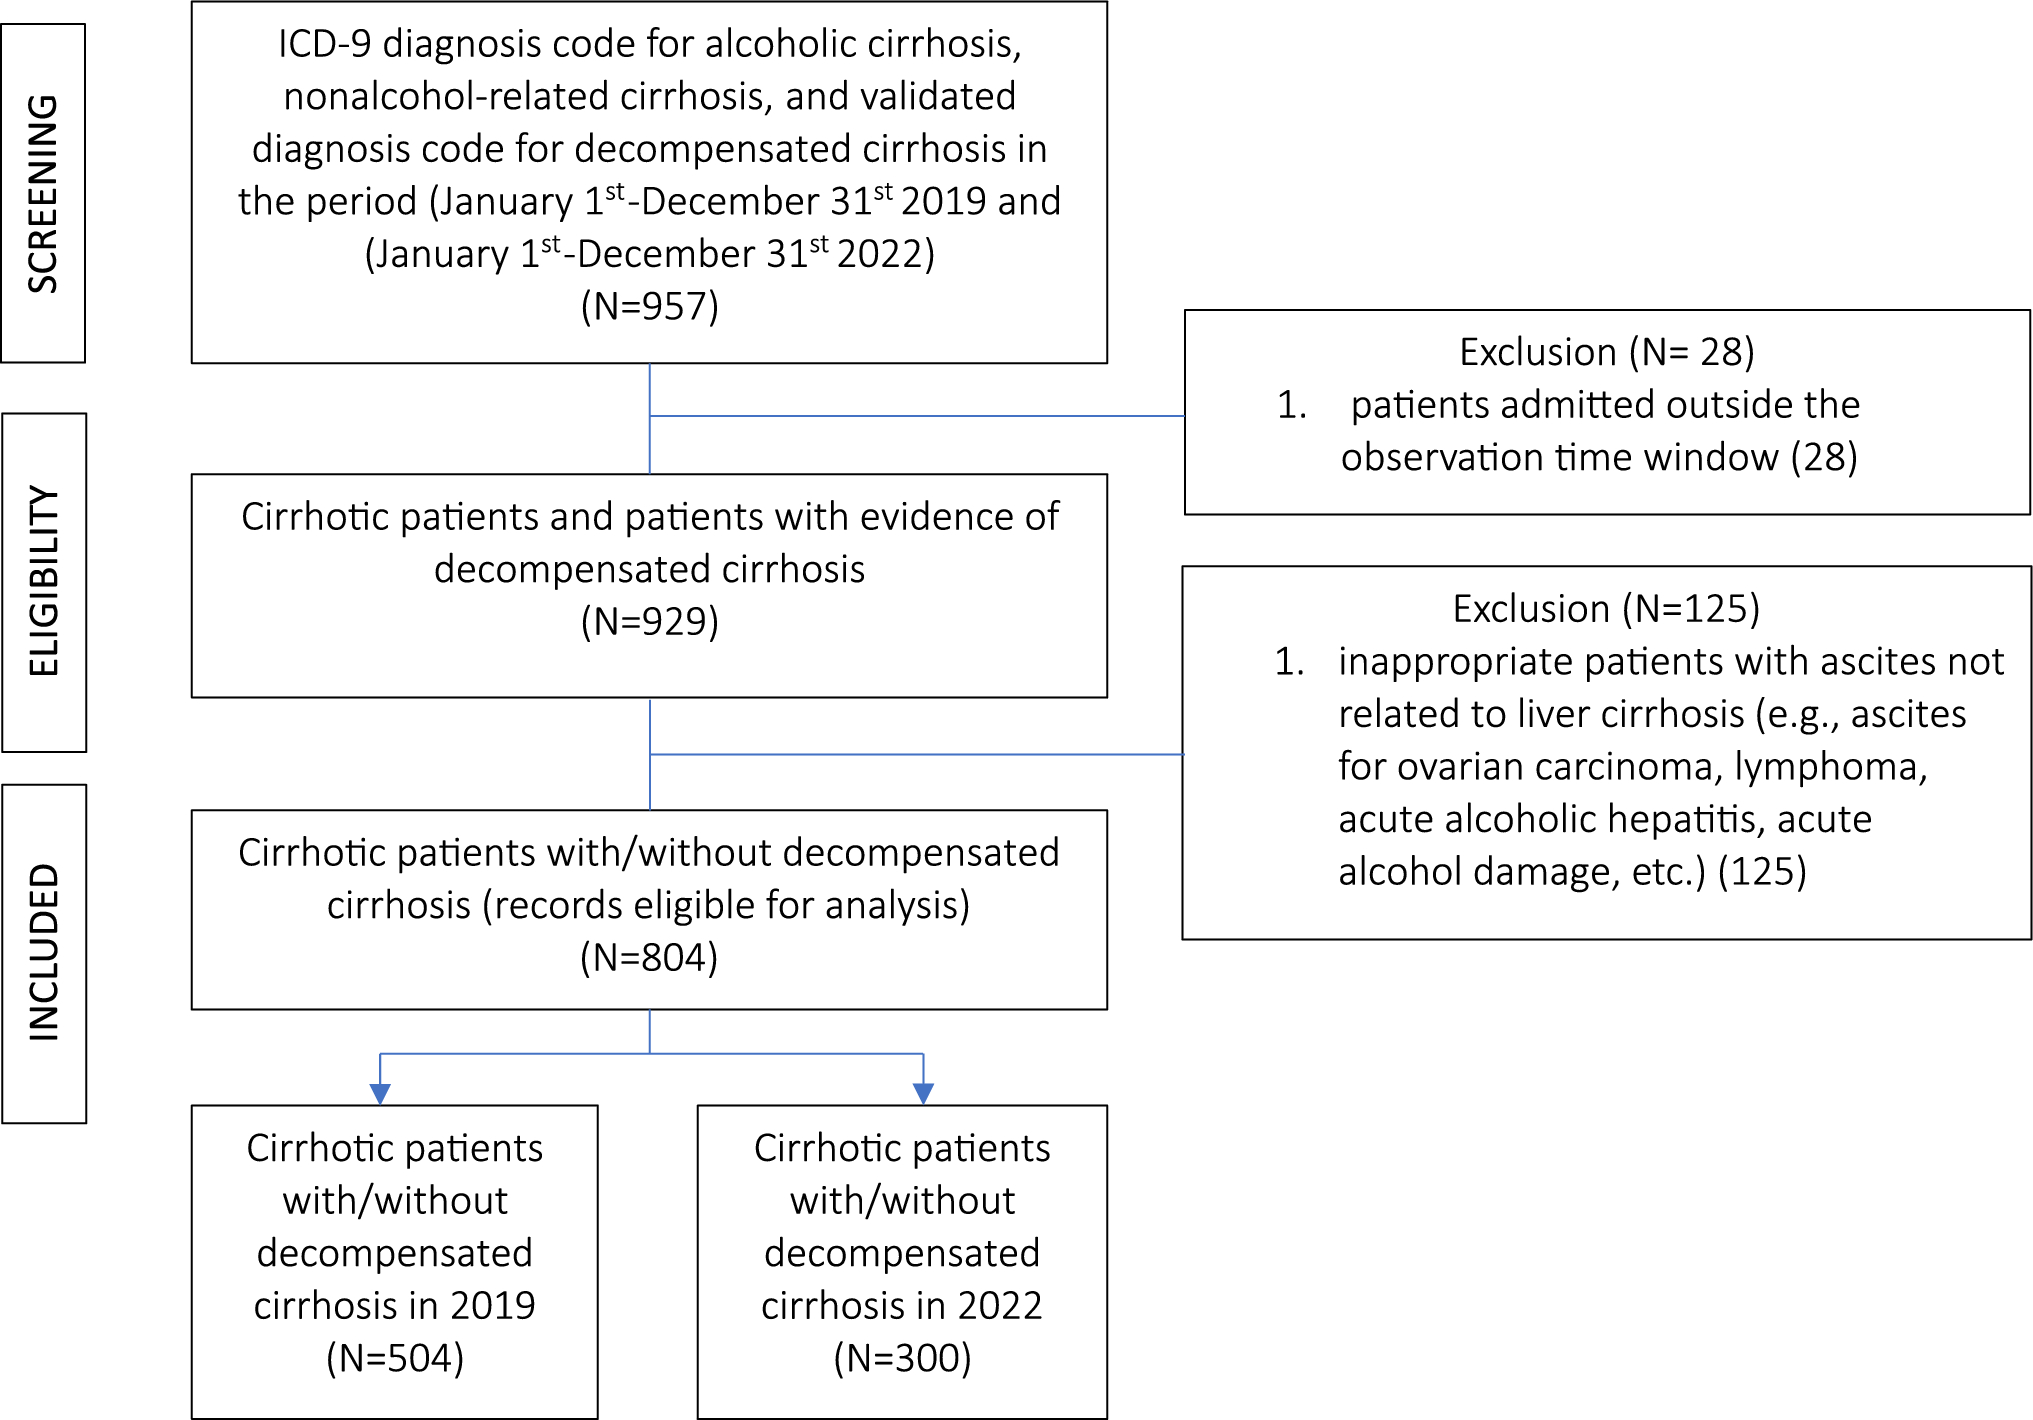
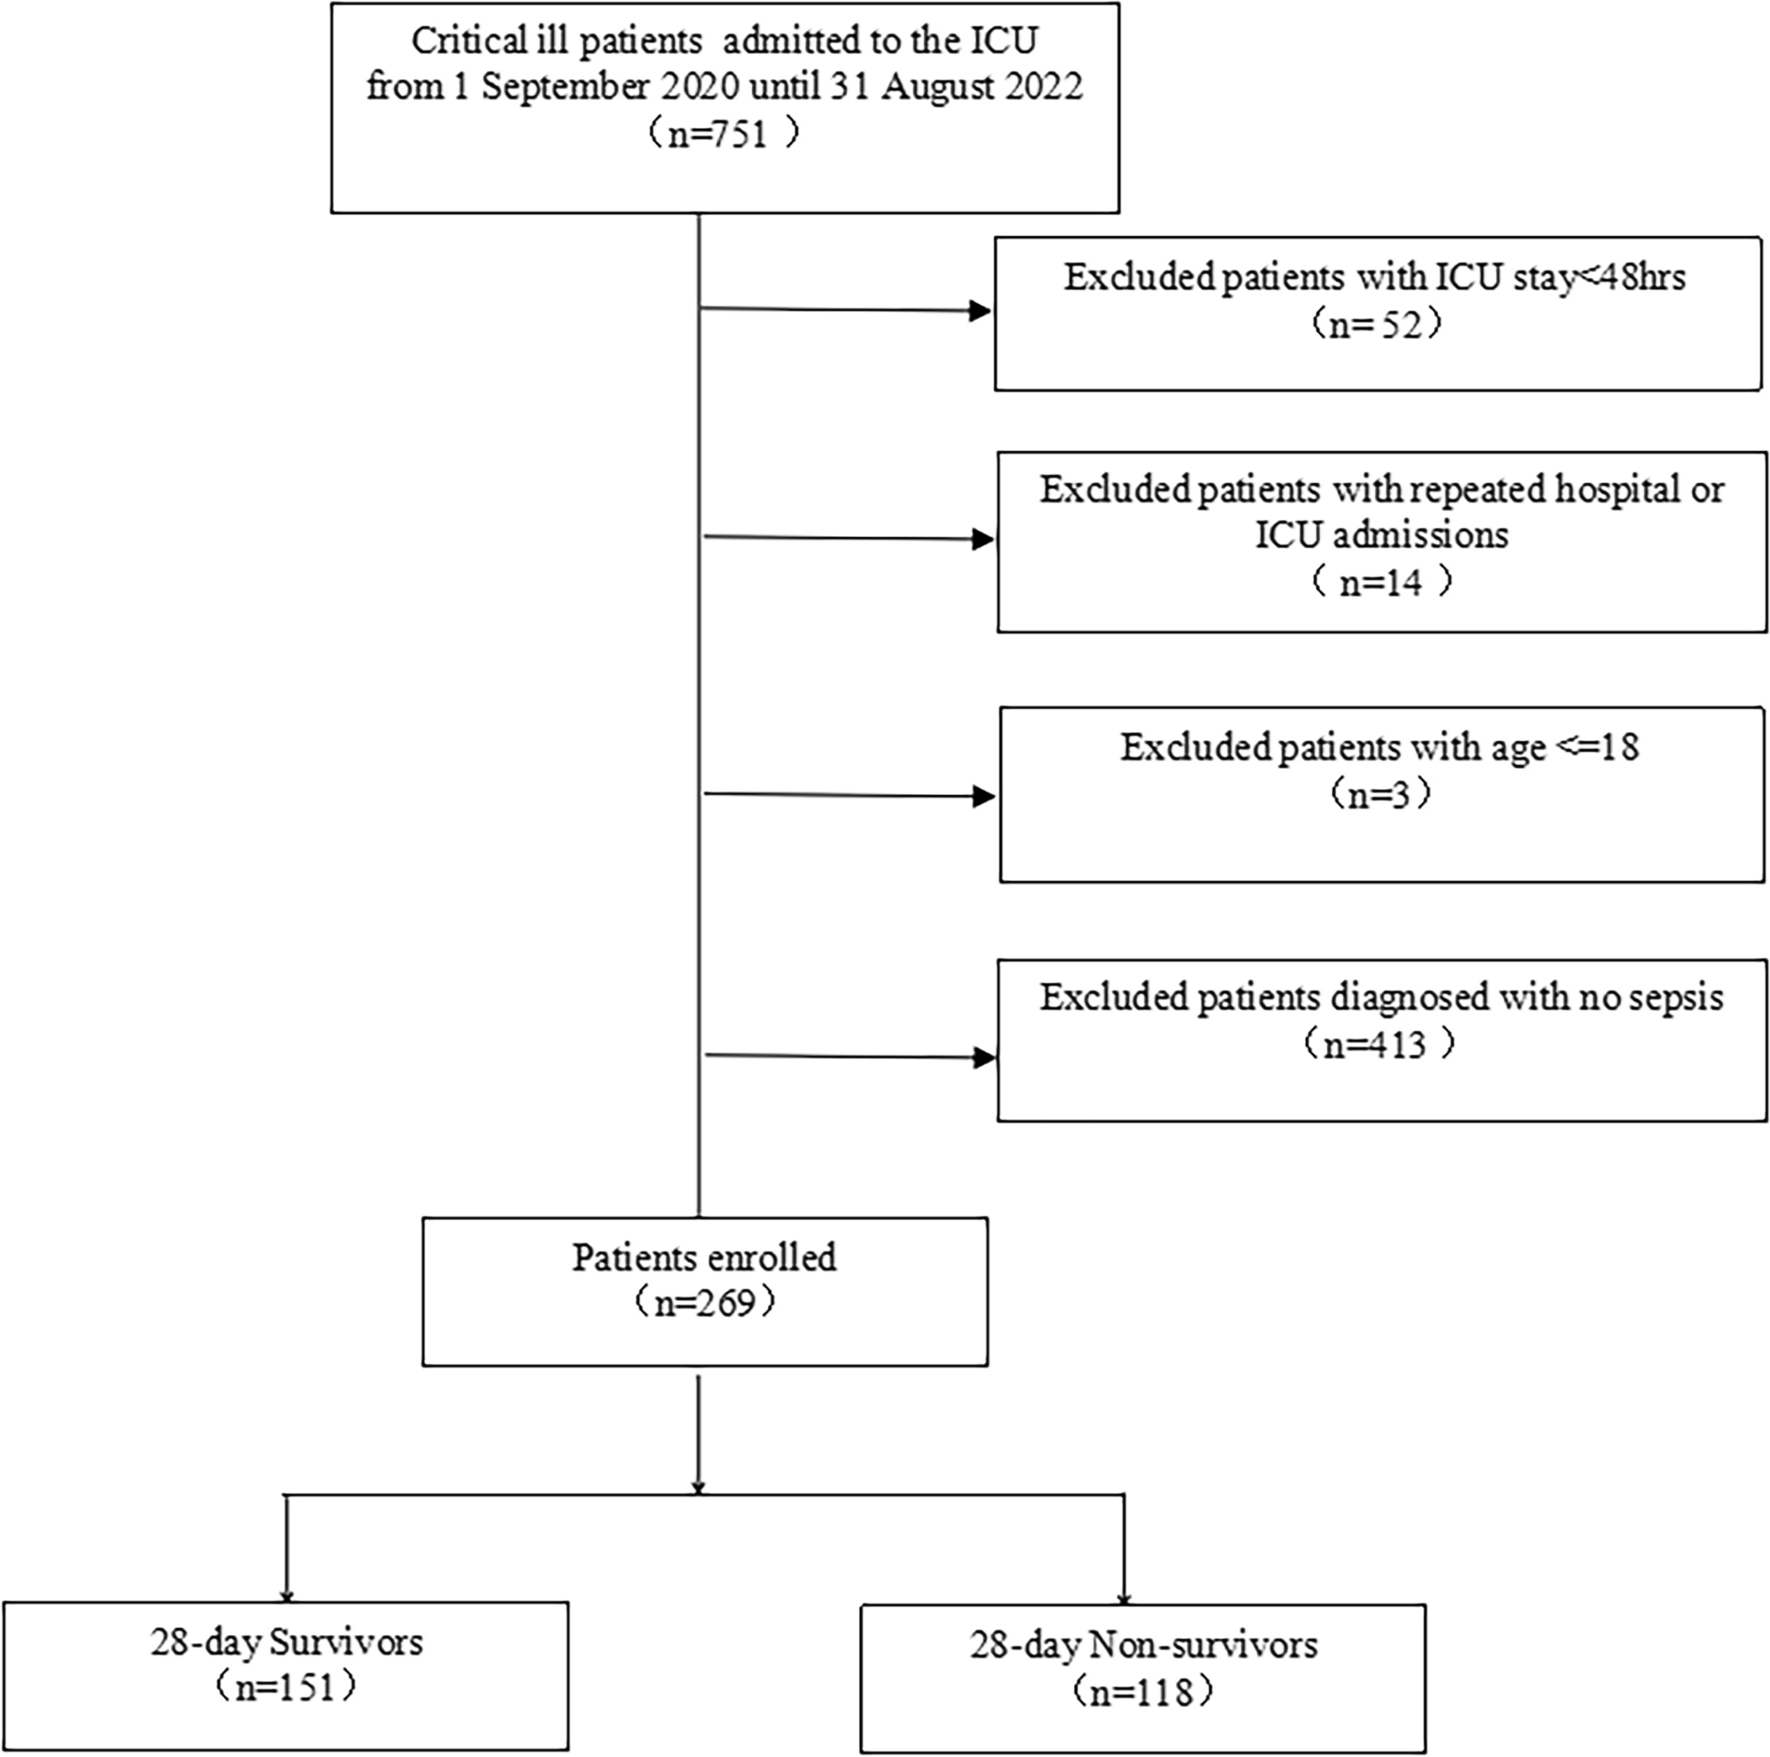
Finally, 269 patients diagnosed with sepsis were enrolled in our study. Of all the cohort study participants, there were 151(56.13%) survivors and 118(43.87%) nonsurvivors until 28 days after ICU admission. The flowchart of the study cohort selection is shown in Fig. 1.
Table 1 shows the baseline characteristics of the participants between 28-day survivors and nonsurvivors. No significant differences were observed with respect to age or gender distribution. Compared with the survivors, the nonsurvivors had significantly higher APACHE II, SOFA, and APS scores (P<0.001). The nonsurvivors had significantly higher MHR but lower LSBP and LDBP than survivors. Primary diseases included skin and soft tissue infection, lung infection, and abdominal cavity infection were no significant differences. There were no differences in the prevalence of comorbidities. Moreover, we compared laboratory variables between survivors and nonsurvivors. As indicated in Table 1, the results showed that nonsurvivors had higher ALT, TB, SCr, BUN, and Lac than survivors. Additionally, nonsurvivors received more accounts for norepinephrine therapy and arginine vasopressin therapy significantly compared with the survivors.
Table 1 Comparisons of demographics between 28-day survivors and non-survivorsAssociation of MHR with 28-day mortalityWe further evaluated the association of MHR as a continuous variable with 28-day mortality using the Cox proportional hazards model. The results are shown in Table 2. In unadjusted analysis, Each one beat per minute (bpm) increase in MHR was associated with a 1.3% higher hazard ratio of 28-day mortality (HR 1.013, 95%CI 1.004–1.022, P = 0.004). Model 1, adjusted for age, indicated that each one bpm increase in MHR was associated with a 1.4% higher hazard ratio of 28-day mortality (HR 1.014, 95%CI 1.005–1.023, P = 0.002). This relationship remained highly significant after a series of covariates adjustment in models 2, 3, and 4. Model 5 was further adjusted for 1 st day lowest systolic blood pressure, 1 st day lowest diastolic blood pressure, and norepinephrine usage. Similarly, results indicated that each bpm increase in MHR was associated with a 1.3% higher hazard ratio of 28-day mortality (HR 1.013, 95%CI 1.004–1.021, P = 0.004).
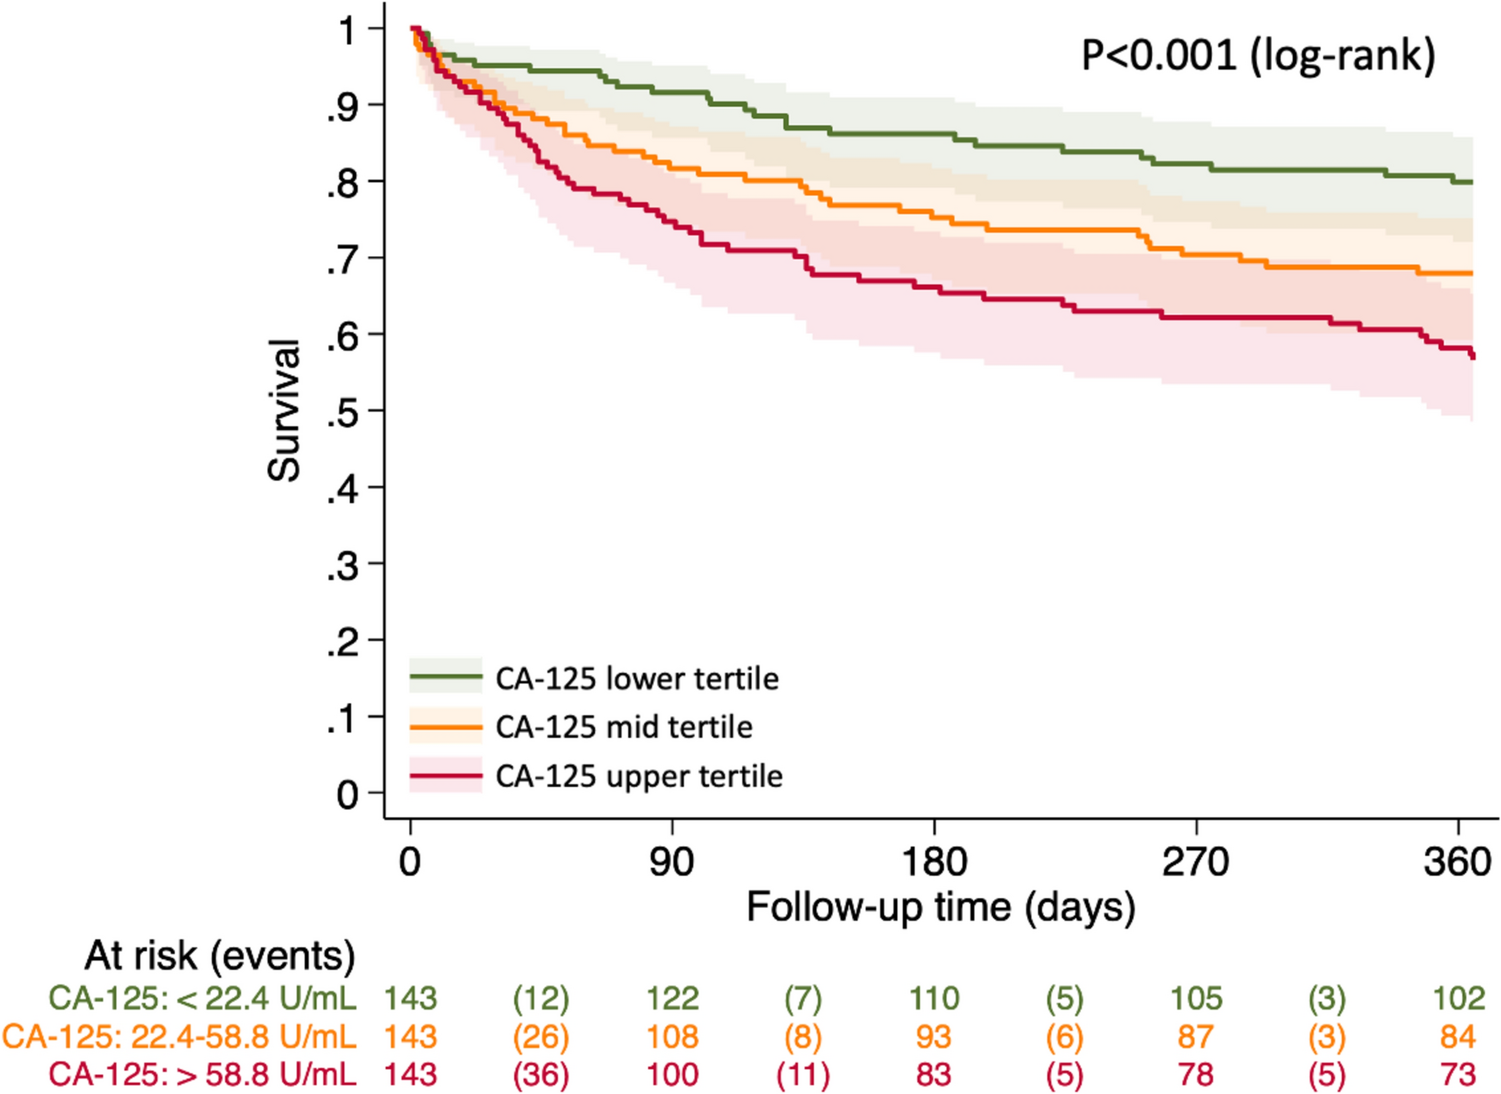
Table 2 Association between MHR and 28-day mortality of sepsis patientsAssociation between different MHR groups and 28-day mortalityThe Kaplan–Meier survival curves revealed the correlation between MHR as a categorical variable and study outcome (Fig. 2). We divided the patients into four groups according to the quartile of MHR. GROUP A was the patients who had MHR no more than 98 bpm, GROUP B was the patients who had MHR between 98 and 111 bpm, GROUP C was the patients who had MHR between 111 and 125 bpm, while GROUP D was the patients who had MHR more than 125 bpm. The Kaplan–Meier curves show that GROUP D has a lowest 28-day probability of survival than other groups (log-rank: P <0.001).
Fig. 2
Kaplan–Meier curves of 28-day mortality by MHR
Sensitivity analysesTo further clarify the influence of MHR on the short-term prognosis of sepsis patients, sensitivity analyses were conducted based on sex, age levels, coronary heart disease, diabetes, hypertension, chronic kidney disease, APACHE II score and norepinephrine usage (Table 3). GROUP A acts as the reference group. The hazard ratio for GROUP D was more than 1 in the discovery cohort (P<0.05). It suggested that the 28-day mortality significantly increased in the highest quartile after full adjustments. The same trend was observed in all of the subgroups except the subgroup of female sex (HR 2.225, 95%CI 0.763–6.486, P = 0.143), the subgroup with age more than 70 (HR 1.997, 95%CI 0.874–4.562, P = 0.101), the subgroup with CHD (HR 2.679, 95%CI 0.556–12.907, P = 0.219) and the subgroup with CKD (HR 2.887, 95%CI 0.377–22.125, P = 0.308). Nevertheless, for GROUP B and GROUP C, there was no significant difference in hazard ratios compared to GROUP A.
Table 3 Association between MHR group and 28-day mortality of sepsis patients in different subgroupsNon-linear association between MHR and outcomeUsing restricted cubic spline analysis, we observed an apparent nonlinear relationship between MHR and 28-day mortality of sepsis patients. In models with full adjustment variables, the relationship between MHR and study outcome can be described as a typical U-shaped curve (Fig. 3). The results showed that the 28-day mortality significantly increased when MHR at both ends of the curve. It indicated that either too high or too low MHR will increase the risk of death. Based on the curve, it showed that the patients had the lowest mortality at MHR of approximately 70–110 bpm.
Fig. 3
Association between MHR and hazard ratio(95% CI) of 28-day mortality using a restricted cubic spline regression model. Adjusted variables included age, Hb, PLT, ALT, TB, SCr, Lac, LSBP, LDBP, and NE. The reference (hazard ratio = 1, horizontal dotted line) was an MHR of 112 bpm (vertical dotted line). Solid lines indicate HRs, and shadow shape indicate 95% CIs. HRs hazard ratios, CI confidence interval
Validation cohortFor the validation cohort, we assessed the relationship between MHR and study outcome in sepsis patients from the MIMIC IV database (Additional file 1: Fig S1). Due to the large number of observations, we entered more covariates into the Cox proportional hazards regression model (Additional file 1: Table S2). It was found that MHR was still significantly correlated with 28-day mortality using univariate and multivariate Cox analysis. Furthermore, we divided the patients into four groups according to the quartile of MHR. A similar trend was observed that the highest quartile of MHR has the most increased 28-day mortality using Kaplan–Meier survival curves analysis (log-rank: P<0.001) (Additional file 1: Fig S2).
GROUP 1 (MHR< = 92) was used as a reference and hazard ratios were reported for other groups. For GROUP 4 (MHR>121), the correlation between MHR and outcome was still statistically significant in sepsis patients from different subgroups for the full model (Additional file 1: Table S3). The hazard ratios of 28-day mortality were still significantly increased in most subgroups except the subgroup with CHD (HR 1.337, 95%CI 0.953–1.875, P = 0.093), the subgroup with APACHE III > = 50 (HR 1.136, 95%CI 0.996–1.294, P = 0.057), and the subgroup with APACHE III <50 (HR 1.095, 95%CI 0.731–1.639, P = 0.660). Our findings were still robust in the subgroup analysis.
Similarly, MHR and outcomes of sepsis patients were found to have an apparent nonlinear relationship when used RCS analysis (Additional file 1: Fig S3). The relationship could be described as a ‘U’ type curve when examining MHR as a continuous variable.
Comments (0)