Patient samples and tissue microarray analysis
Tissue microarrays containing tumor and adjacent normal tissues from 97 OC patients were commercially obtained, with ethical approval and informed consent secured by the supplier. Each tissue section was formalin-fixed and paraffin-embedded before being included in the microarray. Clinical data, including tumor stage, differentiation, and lymph node metastasis status, were collected from pathology reports and supplier annotations. For immunohistochemistry (IHC), tissue sections were dewaxed, rehydrated, and subjected to antigen retrieval in citrate buffer (pH 6.0) at 95 °C for 15 min. After blocking with 5% BSA, slides were incubated overnight at 4 °C with primary antibodies specific to THBS1, CD68, PD-L1, GAL-3, and SNF2H. Staining was visualized using HRP-conjugated secondary antibodies and DAB chromogen, and hematoxylin counterstaining was performed to highlight nuclei. Staining intensity was quantified using ImageJ software by two independent pathologists, who were blinded to the clinical data. Spearman and Pearson correlation coefficients were calculated to assess the relationships between protein expression and clinical parameters.
Bioinformatics analyses
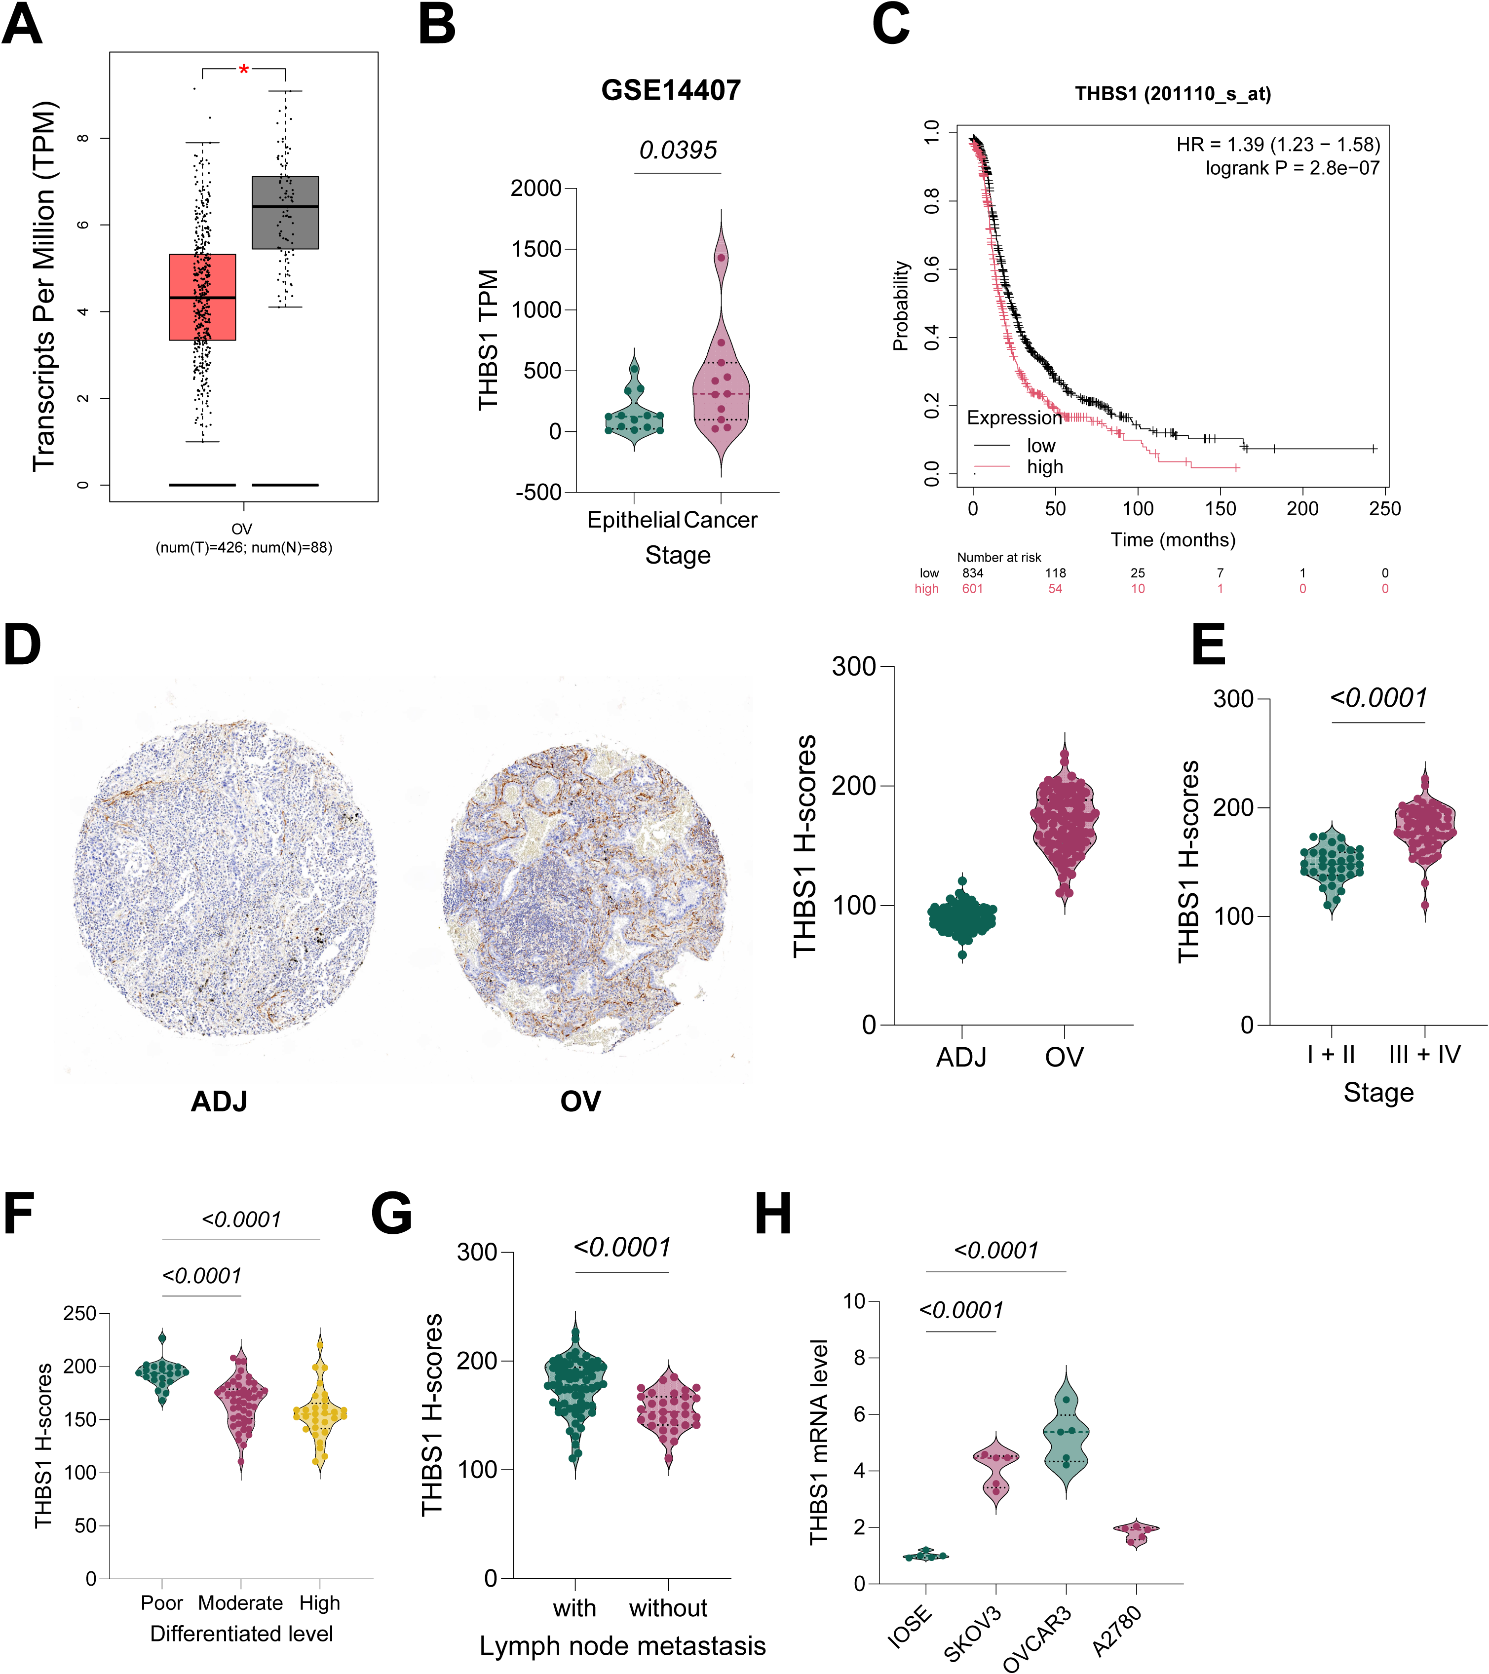
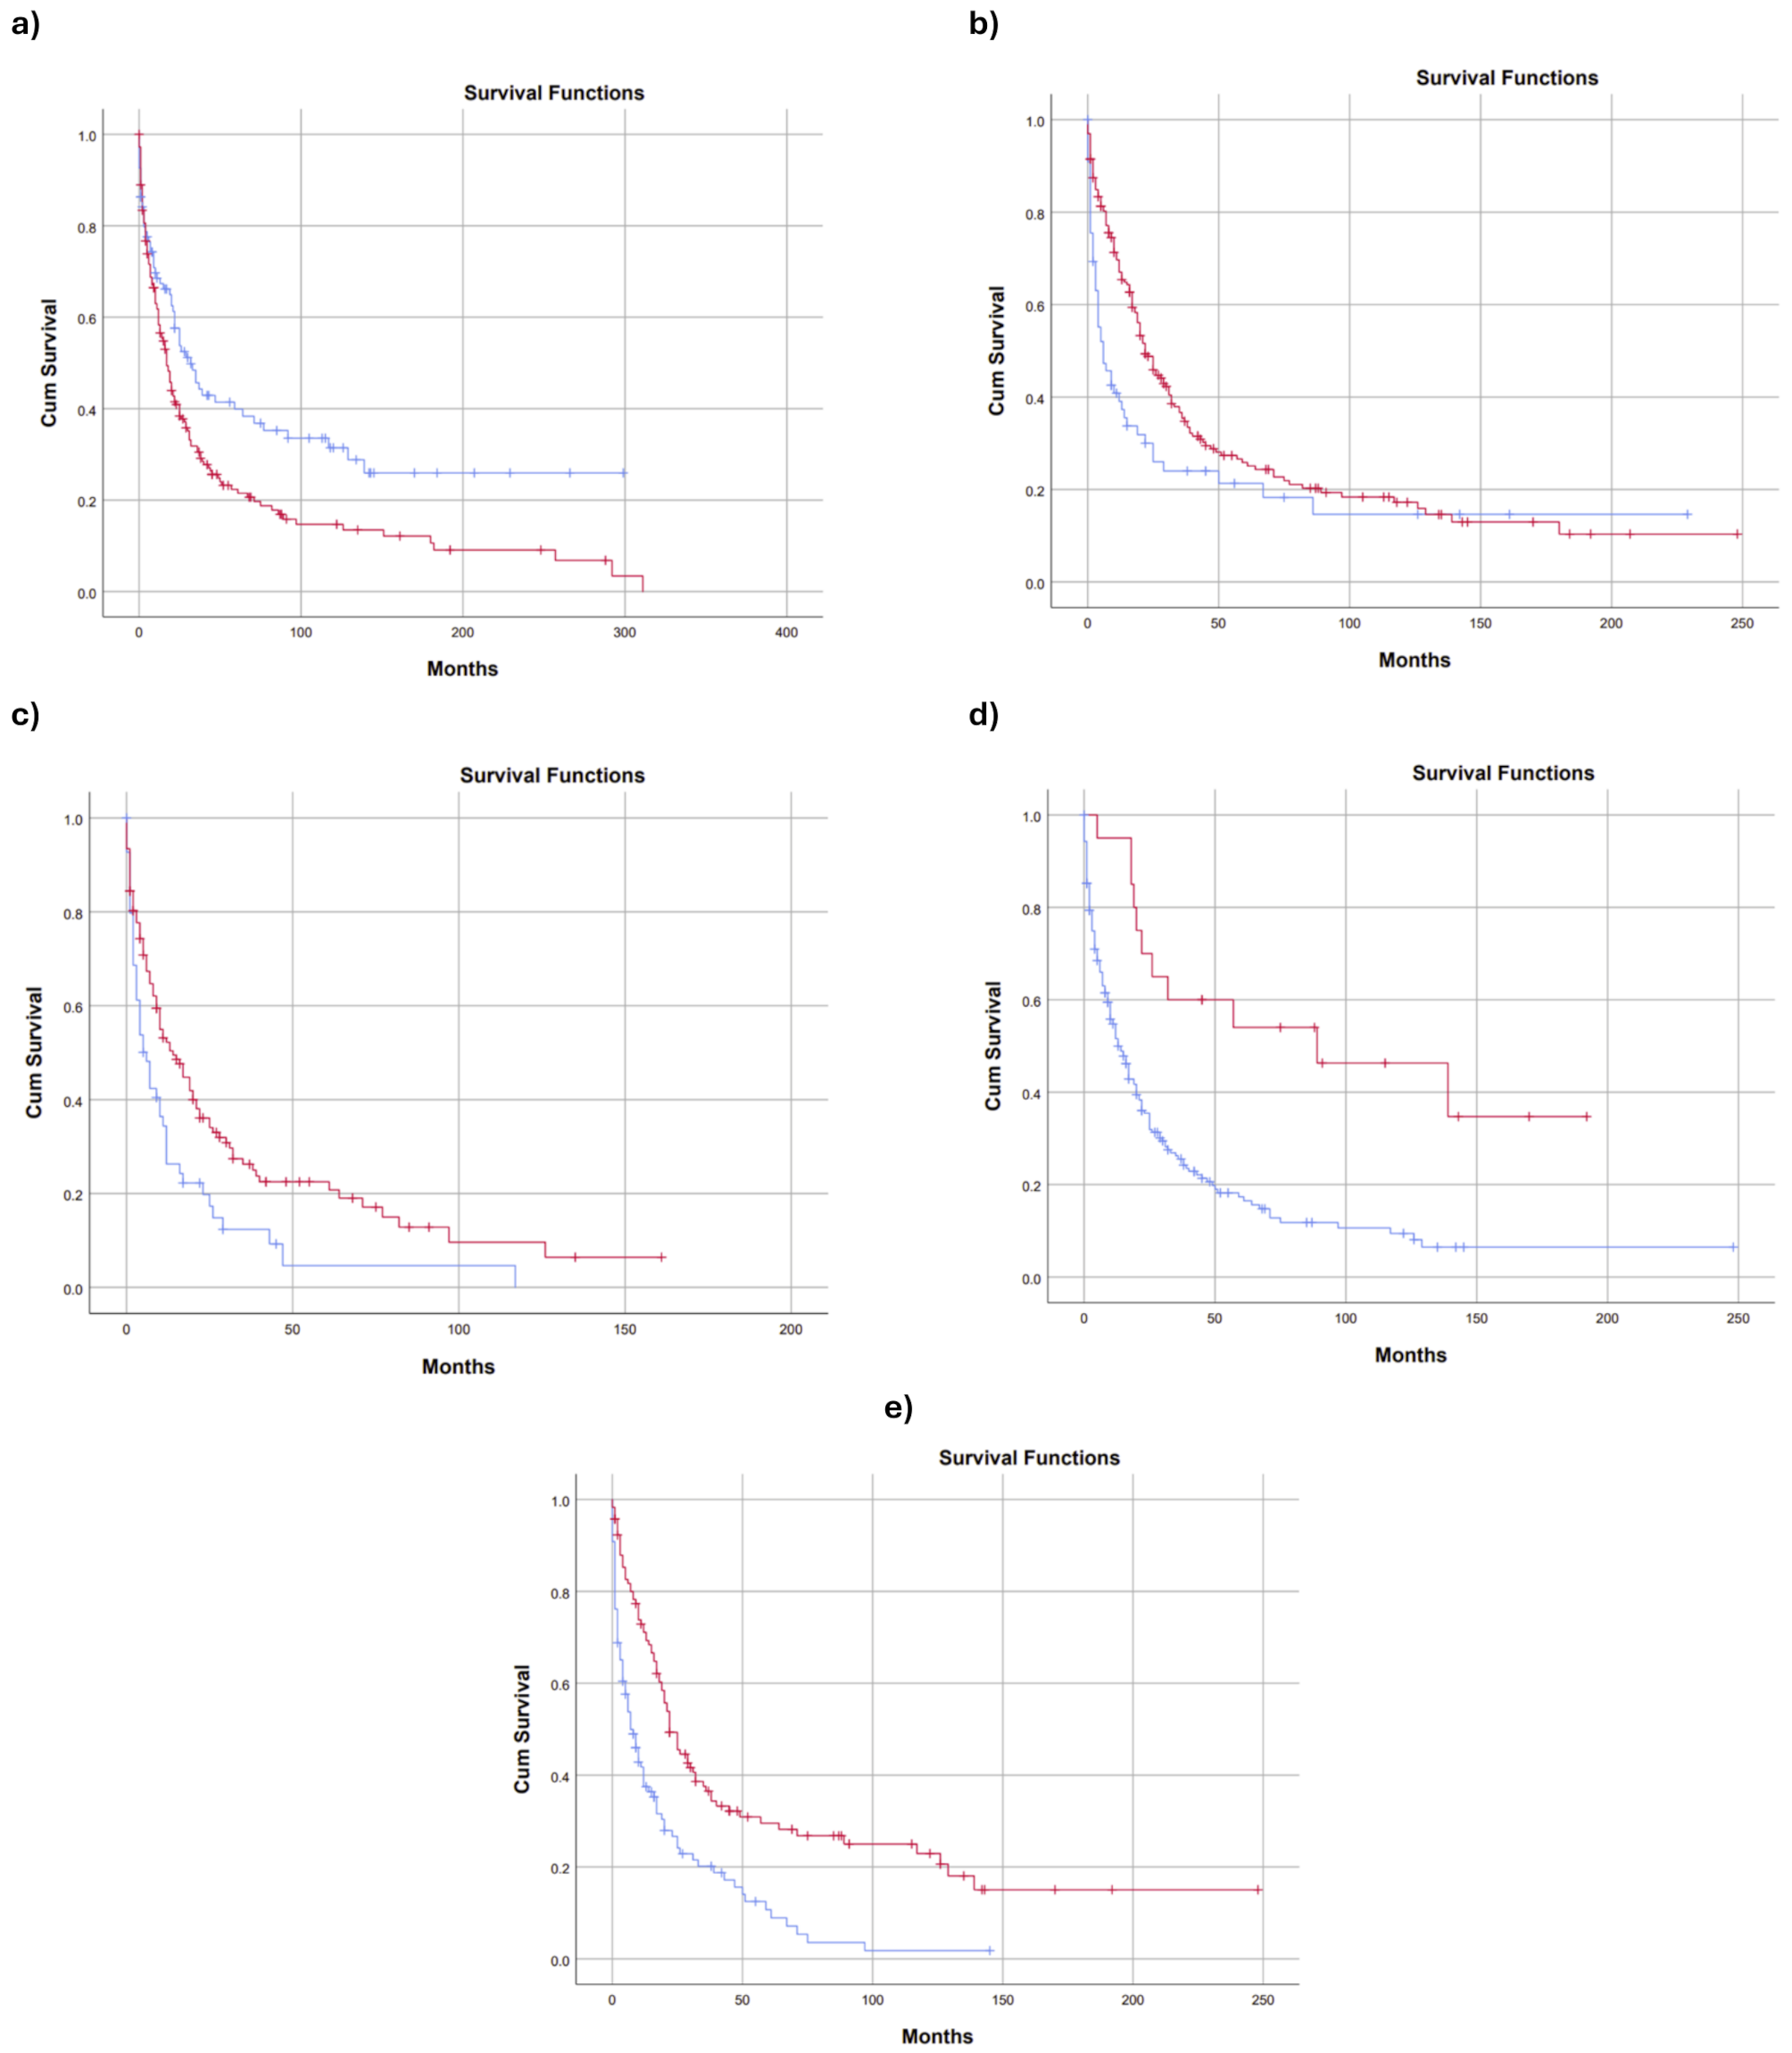
Gene expression levels of THBS1 and SNF2H in OC and normal ovarian tissues were analyzed using publicly available datasets, including TCGA-OV, GTEx, and GSE14407. Raw expression data were downloaded from the GDC and GEO repositories. For TCGA-OV, normalized RNA-Seq data (FPKM values) were compared with GTEx normal ovarian tissue samples. In GSE14407, normalized microarray data were used to compare THBS1 expression between normal ovarian epithelial cells and OC cell lines. TIMER 2.0 was employed to evaluate the correlation between THBS1 expression and immune cell infiltration (CD8+ T cells, dendritic cells, and macrophages). Kaplan-Meier survival analysis was conducted to assess the association between THBS1 or SNF2H expression and overall survival, with statistical significance determined using the log-rank test.
RNA isolation and-quantitative polymerase chain reaction (qPCR) analysis
Total RNA was extracted from ovarian epithelial cells (IOSE) and OC cell lines (SKOV3, A2780, and OVCAR3) using TRIzol reagent (Thermo Fisher Scientific). RNA purity and concentration were assessed using a NanoDrop spectrophotometer (Thermo Fisher Scientific). cDNA was synthesized using a reverse transcription kit (Takara Bio) with 1 µg of total RNA. qPCR was performed using SYBR Green Master Mix (Applied Biosystems) on a QuantStudio 6 Real-Time PCR System. Primer sequences for THBS1, SNF2H, and GAPDH (internal control) are provided in the supplementary materials. Relative expression levels were calculated using the 2−ΔΔCt method.
IHC
Paraffin-embedded tissue sections from patient samples and mouse models were sectioned at 4 μm thickness. Sections were dewaxed in xylene, rehydrated through graded alcohols, and subjected to heat-induced antigen retrieval using a pressure cooker in citrate buffer (pH 6.0) for 20 min. After blocking endogenous peroxidase with 3% H2O2 and nonspecific binding with 5% goat serum, slides were probed overnight at 4 °C with primary antibodies (dilution ratios and sources listed in the supplementary materials). Subsequently, the slides were probed with an HRP-conjugated secondary antibody and DAB chromogen, followed by hematoxylin counterstaining. Images were captured using a Nikon light microscope, and staining intensities were quantified with ImageJ software. At least five high-power fields (400 ×) were analyzed per sample. The H-score (Histoscore) was used as a semi-quantitative measure of THBS1 expression levels, with the median value of the H-score (H-score = 170.97) serving as the grouping threshold. The H-score was calculated as the sum of (staining intensity × percentage of positive cells). Staining intensity was categorized as 0 (none), 1 (weak), 2 (moderate), and 3 (strong), while the percentage of positive cells was counted from 0 to 100%. The final score range was 0-300.
Cells and treatment
The human OC cell lines SKOV3 (#HTB-77, ATCC) and A2780 (#152706, Ximbio) were cultured in DMEM containing 10% fetal bovine serum (FBS) and 1% penicillin/streptomycin (P/S) at 37 °C with 5% CO2. The human monocyte macrophage cell line THP-1 (#TIB-202, ATCC) and CD8+ cytotoxic T cells (#PCS-800-017) were cultured in RPMI-1640 medium supplemented with 10% FBS and 1% P/S.
To investigate the role of THBS1 in OC cells, SKOV3 and A2780 cell lines with stable THBS1 overexpression were constructed. First, the human THBS1 gene sequence was obtained from the NCBI database, and the full-length THBS1 cDNA was synthesized by Genepharma and cloned into the pLVX-Puro lentiviral vector (THBS1), while an empty vector control group (Empty) was also constructed. Lentivirus was packaged in 293T cells using the second-generation lentiviral packaging system (psPAX2 and pMD2.G). After 48 h of viral harvest, the virus supernatant was filtered using a 0.45 μm membrane filter, and SKOV3 and A2780 cells were infected at a multiplicity of infection of 10. Polybrene (8 µg/mL) was added during infection to improve the infection efficiency. After 24 h of infection, fresh culture medium was replaced, and 2 µg/mL puromycin was used to select stable clones 48 h post-infection. Selection was continued for 7 days. After selection, qPCR and Western blot (WB) analyses were performed to detect THBS1 mRNA and protein levels to ensure high expression of THBS1 in the stable clones. The successfully constructed stable cell lines were used in subsequent experiments, including co-culture, chemotaxis assays, and immune regulation functional studies.
In the study of THBS1’s effect on macrophage polarization, THBS1 overexpressing or control cells were co-cultured with phorbol-12-myristate- 13-acetate (PMA)-induced THP-1 macrophages at a 1:1 ratio for 48 h. The macrophages were then collected for flow cytometry analysis of CD86+ M1 and CD206+ M2 phenotypes. In the chemotaxis assay, the culture medium from THBS1 overexpressing or control cells was used in the lower chamber of a Transwell chamber to attract PMA-treated THP-1 cells to migrate to the lower chamber. After incubation at 37 °C for 24 h, the migrated cells were fixed, stained, and counted to assess the impact of THBS1 on macrophage migration.
In the T-cell function assay, CD8+ T cells were co-cultured with OC cells stably overexpressing THBS1. The secretion of CD8+ T-cell activation markers and cytotoxic factors was measured. Additionally, a co-culture lysis assay was performed to detect the cytotoxicity of CD8 + T cells against cancer cells.
Immunofluorescence staining
For immunofluorescence analysis, cells or tissue sections were fixed for 15 min with 4% paraformaldehyde, washed with PBS, and permeabilized for 10 min with 0.1% Triton X-100. After blocking with 1% BSA, samples were mixed overnight at 4 °C with primary antibodies against CD206, CD8, CTLA4, or VISTA. Alexa Fluor 488- or 594-conjugated secondary antibodies were applied for 1 h at ambient temperature. Nuclei were counterstained with DAPI, and slides were mounted with antifade reagent (Thermo Fisher Scientific). Images were acquired using a Leica SP8 confocal microscope, and fluorescence intensity was quantified.
Flow cytometry
For macrophage polarization and T cell exhaustion analysis, cells were rinsed with PBS, resuspended in FACS buffer (PBS with 2% FBS), and stained with fluorescently conjugated antibodies against CD69, TCF7, PFN, VISTA, CD206, PD-1, and CTLA4. After incubation for 30 min at 4 °C, cells were analyzed on a BD LSRFortessa flow cytometer. Data were processed and analyzed using FlowJo software (BD Biosciences). For macrophage polarization, F4/80+CD86+ (M1) or F4/80+CD206+ (M2) populations were quantified. T cell activation and exhaustion markers were assessed in CD8+ populations.
Enzyme-linked immunosorbent assay (ELISA)
Cytokine levels in culture supernatants were measured with ELISA kits for TGF-β1 (#DB100C), CCL1 (#DY272), IL-4 (#D4050), TNF-α (#DTA00D), IL-1β (#DY201), IL-6 (#D6050B), PFN (#QK8011), GZMB (#DGZB00), IFN-γ (#QK285), and IL-2 (#QK202) (R&D Systems). Supernatants were harvested after 48 h of culture, centrifuged at 1,500 rpm for 10 min to remove debris, and stored at − 80 °C until analysis. Absorbance was read at 450 nm on a BioTek microplate reader. Cytokine concentrations were normalized to cell counts.
Chemotaxis assay
Macrophage chemotaxis was assessed using 24-well Transwell chambers with 8 μm pore inserts (Corning). OC cells (SKOV3 or A2780) with or without THBS1 overexpression were seeded in the lower chamber. PMA-treated THP-1 cells were paved in the upper chamber. After 24 h, macrophages migrating to the lower chamber were fixed in methanol, dyed with 0.1% crystal violet, and imaged under a microscope. Migrated cells were quantified by counting five random fields per membrane.
Animal experiments
ID8 mouse OC cells were injected subcutaneously into the flanks of female C57BL/6 mice (6–8 weeks old). When tumors reached ~ 5 mm in diameter, the mouse tumor organoids (MTOs) were excised and transplanted into wild-type (WT) or THBS1 knockout (KO) mice. Tumor size was gauged every 3 days using calipers, and volume was computed as (length × width²) / 2. Mice were euthanized when tumor size reached ethical limits. Tumor tissues were utilized for IHC and immunofluorescence analysis of immune infiltration, angiogenesis markers (VEGFA), and immune evasion markers (PD-L1, GAL-3). Animal protocols were approved by the Institutional Animal Care and Use Committee.
Chromatin Immunoprecipitation (ChIP)-qPCR assays
A ChIP assay was conducted to assess SNF2H binding to the THBS1 promoter. SKOV3 and A2780 cells were crosslinked for 10 min with 1% formaldehyde and quenched with 125 mM glycine. Subsequently, cells were lysed, and chromatin was sheared into 200–500 bp fragments using a Bioruptor sonicator (Diagenode). Immunoprecipitation was performed using an anti-SNF2H antibody or IgG control, with Dynabeads Protein A/G (Invitrogen). After reverse crosslinking, DNA was purified and analyzed by qPCR using primers targeting the THBS1 promoter. The data were normalized to input DNA.
Recombinant protein and T cell analysis
CD3+ T cells were isolated from splenocytes of C57BL/6 mice utilizing magnetic beads (Miltenyi Biotec) and stimulated with anti-CD3/CD28 antibodies (BioLegend) in RPMI-1640 medium supplemented with 10% FBS. Recombinant THBS1 protein (R&D Systems) was added to the culture at varying concentrations (0–100 ng/mL). After 72 h, cells were harvested for flow cytometry analysis of activation (CD69, TCF7, PFN) and exhaustion (PD-1, CTLA4) markers. Cytokines in the supernatant were quantified by ELISA.
Statistical analysis
Data analysis was made in GraphPad Prism v8.0 (GraphPad, CA, USA). Data are presented as violin plots, with each point representing an experimental replicate or patient sample. Statistical significance was determined using Student’s t-test, or by the one or two-way analysis of variance (ANOVA), as appropriate. Tukey’s multiple comparison test was performed after ANOVA.


Comments (0)