
Remember me
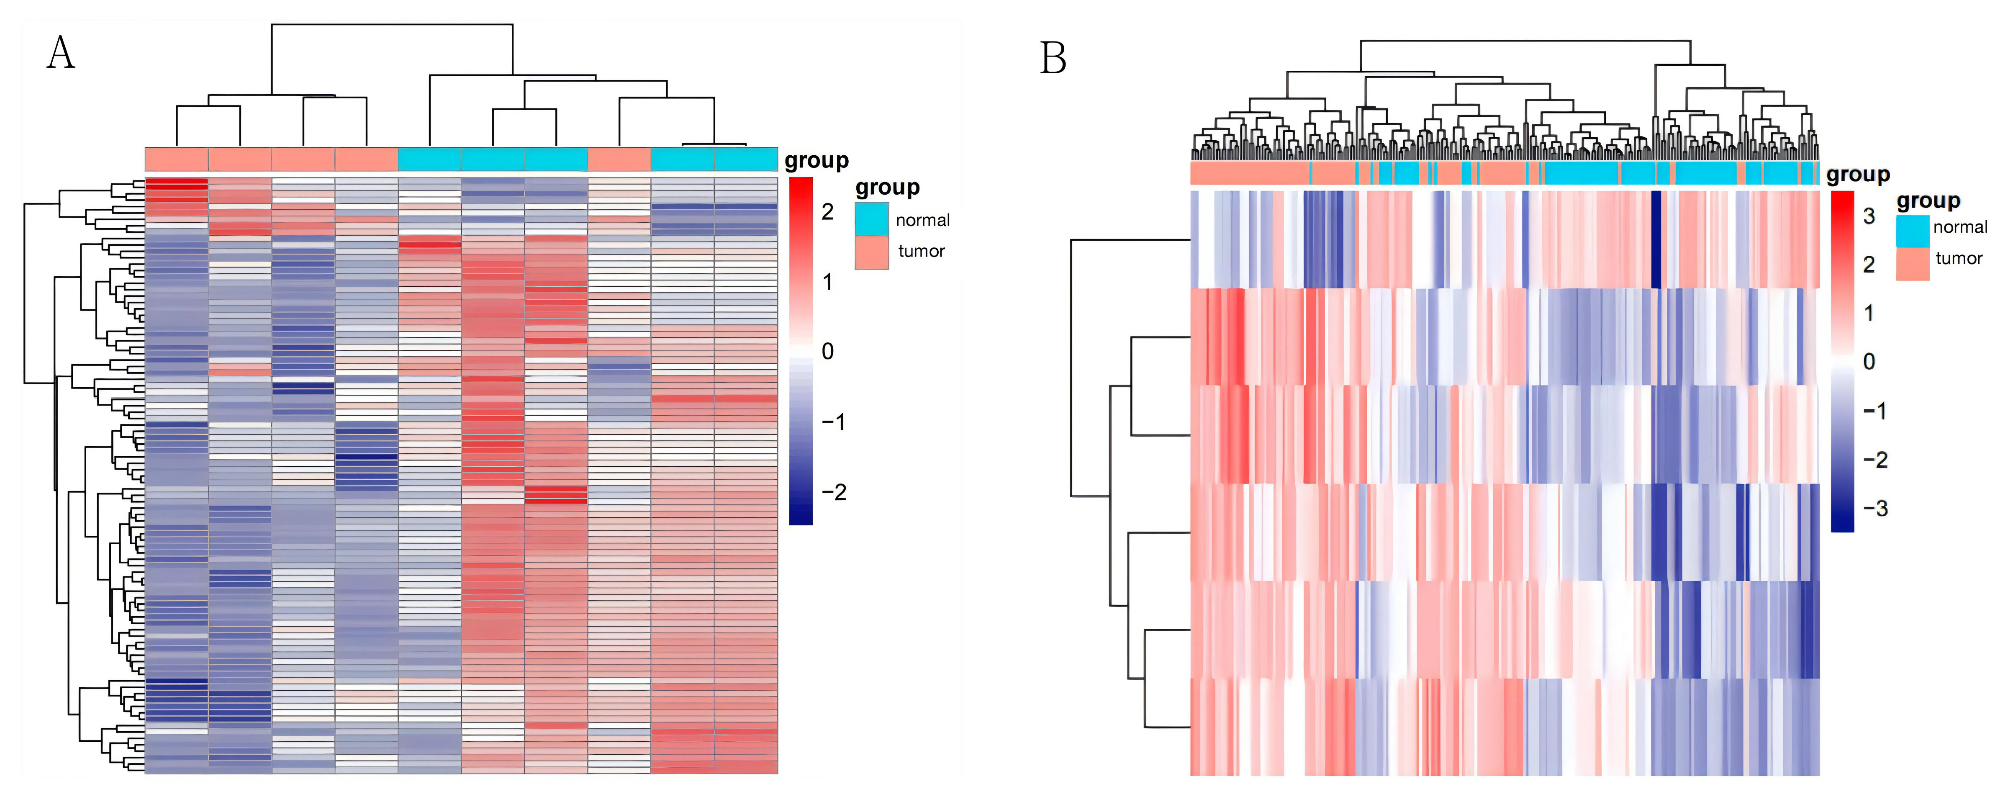


We retrieved a total of 4,425 circular RNAs (circRNAs) from the GSE101586 database and 1,145 microRNAs (miRNAs) from the GSE36681 database, with their corresponding heatmaps presented in Fig. 1A-B. From this data, we identified seven significantly upregulated circRNAs and 42 downregulated circRNAs, selected based on substantial expression differences (|logFC| ≥ 1.5). The detailed information regarding these circRNAs is provided in Supplementary Material 2.
Fig. 1
Heatmaps of the top DEcircRNA (A) and all DEmiRNAs (B) in LUAD
CircRNAs are known to perform various biological functions. Numerous studies have established that circRNAs function as competing endogenous RNAs (ceRNAs) or miRNA sponges [11, 12]. Accordingly, utilizing the circBank database, we identified target miRNAs that can bind to the significantly upregulated and downregulated DEcircRNAs. We then intersected the target miRNAs of the upregulated DEcircRNAs with both the upregulated and downregulated DEmiRNAs from the GSE36681 database, and similarly for the downregulated DEcircRNAs. To further refine our selection of significant miRNAs, we conducted Kaplan-Meier survival analysis on the intersecting miRNAs, identifying those of clinical relevance as illustrated in Fig. 2. Utilizing the miWalk and miRDB databases, we predicted downstream mRNAs for these significant miRNAs and intersected them with immune-related genes and DEmRNAs obtained from the GEPIA online database for non-small cell lung cancer, resulting in the identification of 20 mRNAs: OAS1, RORC, PIK3R1, ILK, VIPR1, SEMA6A, RORA, DUOX2, TNFAIP3, NRG1, S1PR1, IL1RL1, NR2C2, CCRL2, TGFBR3, PIK3R1, TFRC, CCL22, PAK6, and HNF4G, as depicted in Fig. 3.
Fig. 2
A-J was used to predict the targeted miRNA of DEcircrna using CircBank database, intersected with DMmiRNA, and then used Kaplan-Meier survival analysis to obtain meaningful miRNA
Fig. 3
A-I is the downstream mRNA prediction of meaningful miRNAs based on miWalk database and miRDB database and intersects with immune-related genes and DEmRNA from non-small cell lung cancer obtained from GEPIA online database
Construction of PPI Network and GO/KEGG Enrichment AnalysisTo elucidate the interactions among the identified mRNAs, we constructed a PPI network (Fig. 4A). We performed GO and KEGG enrichment analyses on these genes, revealing that within the molecular function category, these genes were predominantly enriched in the following activities: cellular response to organic substances, cytokine-mediated signaling pathways, cellular response to cytokines, cellular response to chemicals, steroid hormone receptor activity, binding to ErbB-3 type receptors, oxysterol binding, signaling receptor activity, and molecular transducer activity, among others (Fig. 4B-D). The KEGG enrichment analysis indicated a primary enrichment in the ErbB signaling pathway.
Fig. 4
Construction of PPI regulatory network and functional enrichment analysis. (A) PPI regulatory network of DEmRNAs. (B-D) The first 10 important GO enrichment annotations of genes, including BP, CC, MF. (E) Top 10 important KEGG pathways
Construction of Regulatory NetworkWe conducted tissue expression and survival analyses of the identified mRNAs using the TCGA database, ultimately identifying significant core mRNAs, specifically OAS1, VIPR1, and PIK3R1, as illustrated in Fig. 5. Subsequently, we constructed a regulatory network comprising six DEcircRNAs, three DEmiRNAs, and three DEmRNAs, which includes the following interactions: hsa_circ_0079557-hsa-miR-502-5p-OAS1, hsa_circ_0000370-hsa-miR-502-5p-OAS1, hsa_circ_0000369-hsa-miR-502-5p-OAS1, hsa_circ_0020390-hsa-miR-502-5p-OAS1, hsa_circ_0023685-hsa-miR-542-3p-VIPR1/PIK3R1, and hsa_circ_0001666-hsa-miR-193a-3p-PIK3R1, as depicted in Fig. 6.
Fig. 5
The box plot shows the expression levels of 3 target genes between LUSC (TCGA database) and normal samples using GEPIA, as well as survival analyses. A-C is the expression level of OAS1, PIK3R1 and VIPR1 in TCGA database. D-F is survival analysis of OAS1, PIK3R1 and VIPR1 in TCGA database
Fig. 6
circRNAs-miRNAs-mRNAs network. circRNA is represented as a circle, miRNA is represented as a hexagonal arrow, and mRNA is represented as a square blue. Green is down, red is up. The edges (lines) represent the relationship between circRNA, miRNA, and mRNA
Correlation between Immune Cell Infiltration and Central Immune-Related DEmRNAsUtilizing ssGSEA and CIBERSORT analyses, we observed significant differences in immune cell infiltration levels between the LUAD group and the control group (Fig. 7A-B). These differentially infiltrated immune cells were found to be associated with the central immune-related DEmRNAs (Fig. 7C). A comprehensive analysis revealed a significant correlation between the expression levels of three genes—OAS1, VIPR1, and PIK3R1—and the infiltration of various immune cell types in LUAD, including B cells, CD4 + T cells, CD8 + T cells, neutrophils, macrophages, and dendritic cells. The results indicate that the expression levels of VIPR1 and PIK3R1 (as illustrated in Fig. 7D) are positively correlated with B cells, CD4 + T cells, CD8 + T cells, macrophages, and dendritic cells. Consequently, we hypothesize that elevated expression of VIPR1 and PIK3R1 may enhance antitumor immunity within the LUAD microenvironment. This hypothesis is further substantiated by the observation of improved survival rates in patients exhibiting increased expression of the VIPR1 and PIK3R1 genes. Conversely, our findings did not demonstrate a significant association between OAS1 gene expression and immune cell infiltration, suggesting that OAS1 may function as an oncogene that potentially inhibits antitumor immune responses, thereby adversely affecting patient survival.
Fig. 7
Correlation between immune cell infiltration and hub immune-related DEmRNAs. (A-B) Distribution of immune cells in LUAD (red and green represent LUAD and control, respectively). (C) Pearson correlation between immune cell infiltration and hub immune-related DEmRNAs. * represent P < 0.05; ** represent P < 0.01; *** represent P < 0.001; **** represent P < 0.0001. (D) The correlation between the expression of “OAS1"、"PIK3R1” and “VIPR1” and tumor-infiltrating immune cells was analyzed
The Expression of hsa_circ_0079557 is Increased in LUAD Cells, and Knockdown of hsa_circ_0079557 Inhibits Cell Proliferation and MigrationTo validate our conclusions, we randomly selected a circRNA, hsa_circ_0079557, for in-depth investigation. Experimental results demonstrated that the expression level of hsa_circ_0079557 in LUAD cells was markedly elevated compared to normal BEAS-2B cells, with particularly notable differences observed in A549 cells (Fig. 8A). Furthermore, through real-time fluorescent quantitative polymerase chain reaction (qPCR) analysis of blood samples from patients, we found that the expression level of hsa_circ_0079557 was significantly higher in these patients compared to those with benign nodules (Fig. 8B).
To investigate the impact of hsa_circ_0079557 on LUAD cells, we conducted experiments utilizing the A549 cell line. Initial validation of si-hsa_circ_0079557 knockdown efficiency is demonstrated in Fig. 8C. Subsequent colony formation assays revealed a significant reduction in proliferative capacity of hsa_circ_0079557-knockdown A549 cells compared to the negative control group (Fig. 8D). Consistent with this observation, CCK-8 assays confirmed that hsa_circ_0079557 knockdown markedly suppressed cellular proliferation (Fig. 8E). Furthermore, Transwell migration and invasion assays indicated diminished metastatic potential in hsa_circ_0079557-deficient A549 cells (Fig. 8F).
In summary, these experimental results fully illustrate that hsa_circ_0079557 plays a crucial role in the occurrence and development of LUAD.
Knockdown of Hsa_circ_0079557 Affects EMT Progression in LUAD CellsEpithelial-mesenchymal transition (EMT) is a critical process by which epithelial cells acquire migratory and invasive capabilities. Therefore, we further investigated whether hsa_circ_0079557 affects the migratory ability of lung LUAD cells by regulating the expression of EMT-related proteins. Specifically, we examined the expression levels of three key EMT markers—E-cadherin, N-cadherin, and Vimentin—in LUAD cells with knockdown of hsa_circ_0079557. Western Blot experimental results showed that after knockdown of hsa_circ_0079557, the expression level of E-cadherin was significantly increased, while the expression levels of N-cadherin and Vimentin were decreased (Fig. 8G). This result strongly suggests that hsa_circ_0079557 plays a crucial role in enhancing the migratory and invasive abilities of LUAD cells by regulating the EMT process.
Fig. 8
The impact of knocking down hsa_circ_0079557 on the proliferation, invasion, migration, and epithelial-mesenchymal transition (EMT) of LUAD cells. (A) When compared to normal BEAS-2B cells, a notable discrepancy in the expression level of hsa_circ_0079557 is observed within LUAD cells. (B) Analysis of the expression levels of hsa_circ_0079557 in blood samples collected from patients, utilizing qPCR. (C) Validation of hsa_circ_0079557 knockdown efficiency by qPCR assay. (D) Assessment of hsa_circ_0079557 knockdown effects on cellular proliferative capacity using CCK-8 assay. (E) Experimental verification of hsa_circ_0079557’s regulatory role in LUAD cells via plate colony formation assay. (F) Transwell migration assay demonstrating hsa_circ_0079557-mediated effects on LUAD cell motility. (G) Western blot analysis confirming hsa_circ_0079557’s modulation of epithelial-mesenchymal transition (EMT) markers in LUAD cells
Comments (0)