
Remember me
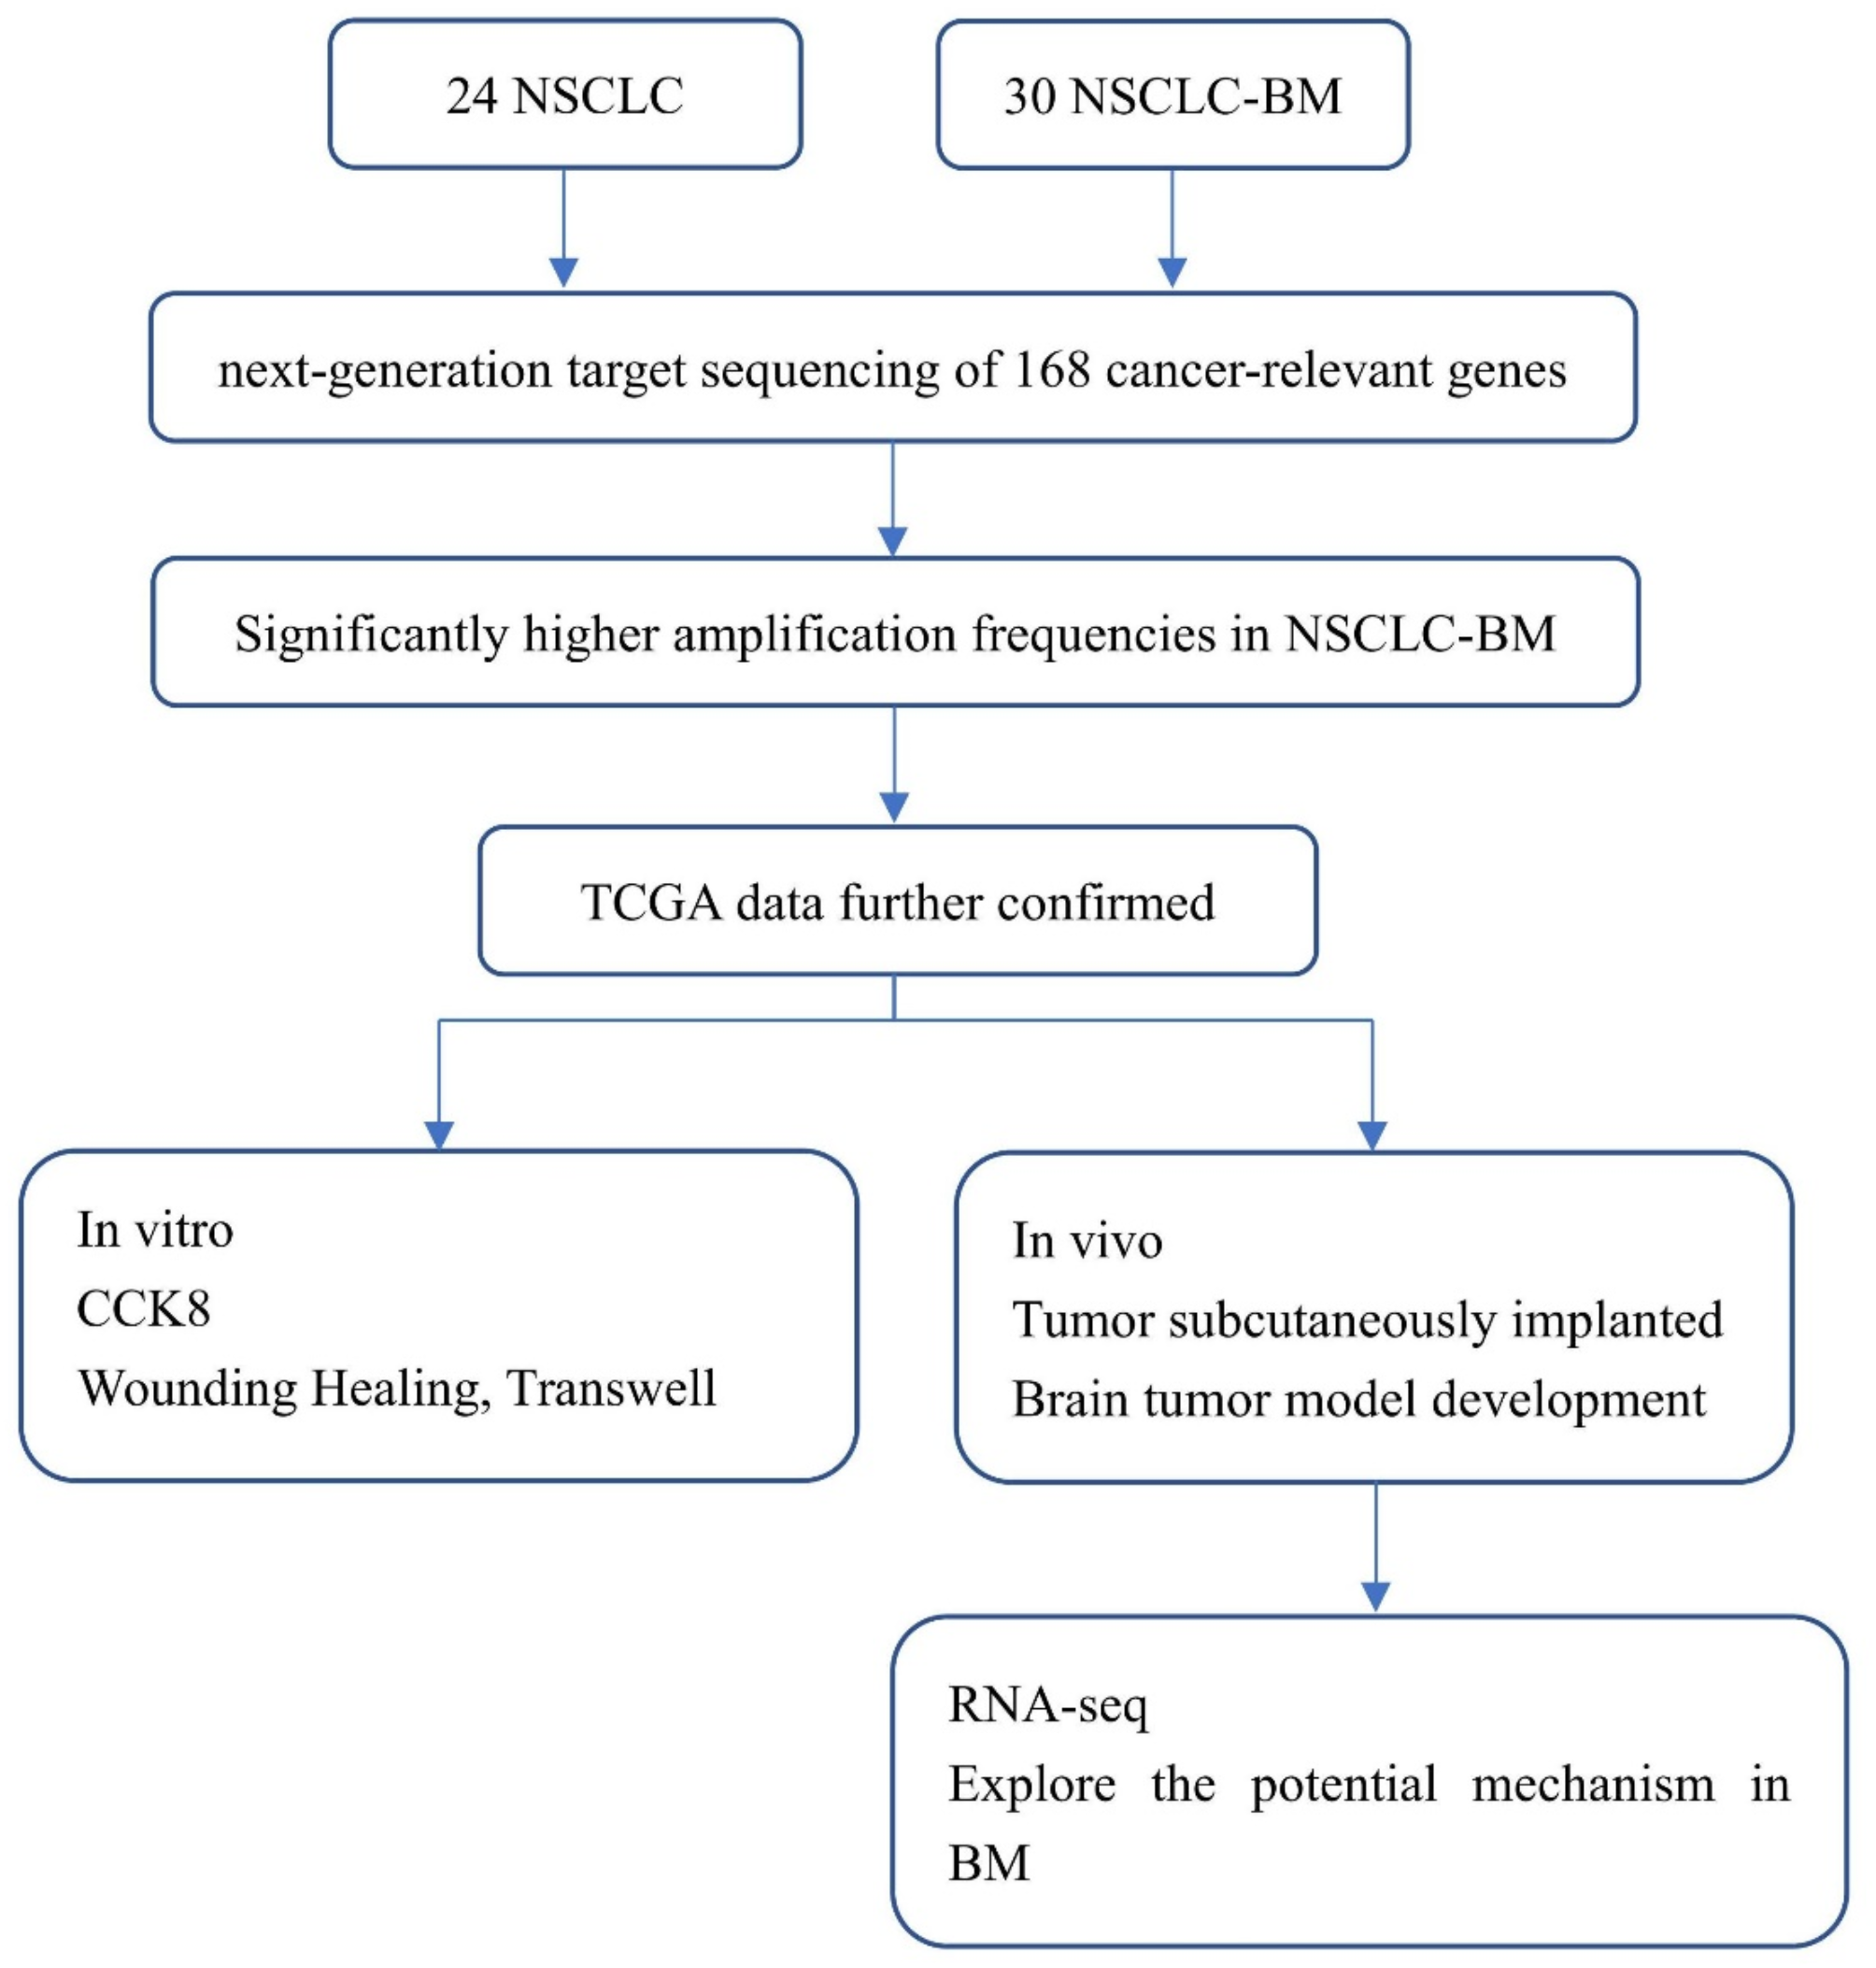


Our main purpose was to identify the differences between lung cancer tissue specimens and brain metastasis tumor specimens and try to explore the mechanisms underlying the occurrence of brain metastasis (Fig. 1). This research enrolled 30 lung cancer patients with brain metastases. The median age was 55.5 (ranging from 37 to 76 years), and 53% (16/30) of the patients were female in this study. EGFR mutation accounts for the majority of patients in this study presenting 43% (13/30), including EGFR L858R, EGFR 19del, EGFR L861Q, EGFR G719A, EGFR G719S accounting for 13% (4/30), 17% (5/30), 7% (2/30), 3% (1/30), and 3% (1/30), respectively. In addition, all patients enrolled in this research had surgically removed brain tissue and were further verify by pathology (Table 1).
Fig. 1
Flowchart of this study design. Abbreviation: NSCLC, non-small cell lung cancer; NSCLC-BM, NSCLC patients with brain metastases
Table 1 The basic character of the patients in this study cohortIn Lung Adenocarcinoma, the Presence of EGFR Amplification Indicates a Poorer PrognosisSurvival data were downloaded from the public UCSC database (https://xenabrowser.net/datapages) and subjected to Kaplan-Meier survival analysis.
The results indicate that patients with EGFR amplification tend to have a poorer prognosis than those without EGFR amplification, with a statistically significant difference (Fig. 2; HR: 0.61, 95% CI: 0.350–1.064, P = 0.031).
Fig. 2
Kaplan-Meier curves for overall survival of lung adenocarcinoma patients with or without EGFR amplification
The Distribution of the Mutation Genes in the Lung and Brain Metastases TissuesTP53 mutation was the most frequent mutation in brain metastases tissues presenting 60%. The rate of EGFR amplification was closely followed by and was much higher in patients with brain metastases compared to lung cancer patients (40% vs. 12%). Gene signatures, such as LRP1B, RNF43, and MYC were also commonly detected with the same percentage of 17%. Other mutation genes, including EPAH3, CCND1, FGF4, CSMD3, CDKN2A, and PMS2 were also frequently seen, showing the same percentage of 13% (Fig. 3A).
The driver of EGFR account for the majority (67%, 16/24) of the mutation in lung cancer tissue, with EGFR L8585R, EGFR 19del and EGFR L861Q presenting 25%, 38%, and 4%, respectively. Without the driver genes, TP53 was the most mutation gene in the lung cancer tissue with a mutation rate of 75%, and APC also has the higher mutation rate in the lung cancer tissue with a mutation rate of 21%, gene signature, such as PMS2 and CDK4 has the same rate of 17% in lung cancer tissues (Fig. 3B).
Fig. 3
Shows the oncoprint displaying the distribution of mutated genes in brain metastases tissue (A) and lung cancer tissue (B)
EGFR Overexpression Was Confirmed by Western BlotThe parental PC-9 cells (EGFR exon19 E746–A750 deletion) was transfected by EGFR-overexpressing lentivirus (pcSLenti-EF1-EGFP-P2A-Puro-CMV-EGFR-3xFLAG-WPRE) to display green color and overexpression of EGFR protein was further confirmed by western blot (Fig. 4).
Fig. 4
Images from the light microscope showed that the PC9 cell line (A) was successfully transfected by EGFR-overexpressing lentivirus. Western blot showed that the expression of EGFR proteins was successfully increased in PC9 cell lines (B) due to Lentivirus transduction
Overexpression of EGFR Protein Enhanced the Proliferation and Migration Ability of NSCLC Cell Lines in VitroWe assessed the proliferation and migration capabilities of NSCLC cell lines PC9 in vitro CCK8 assay, wound healing, and transwell assays. Our findings indicate that EGFR overexpression led to increased proliferation in CCK8 (Fig. 5A) and this trend was also evident in wound healing (Fig. 5B) and transwell assays (Fig. 5C).
Fig. 5
Proliferation and migration ability of NSCLC cell lines in vitro. (A) CCK8 test was performed to assess the proliferation ability of PC9 cell line, Data are represented as means ± SD. (B) wound healing was performed to assess the migration ability of PC9 cell line. (C) Transwell assays was performed to assess the infiltration ability of PC9 cell line
Lentivirus Transduction of PC9 Cells Can Successfully Grow Tumor SubcutaneouslyTumor cells were injected subcutaneously into mice for the experiment, and fluorescence intensity was measured weekly, along with monitoring the mice’s body weight, to evaluate tumor growth and create growth curves (Supplementary Data Fig. 1). Mice were sacrificed and the date of death was recorded, the subcutaneous tumor was removed and subjected to hematoxylin and eosin (HE) staining for further identification of tumor cells (Supplementary Data Figs. 2 and 3).
Overexpression of EGFR Protein Enhanced the Brain Metastases Rate Compared To the Control GroupThe mice were randomly assigned to control and experimental groups. In the control group, approximately 150,000 parental PC9 cells suspended in 100 µL of PBS were injected into the left cardiac ventricle. In the EGFR amplification group, approximately 150,000 PC9 cells overexpressing the EGFR gene in 100 µL of PBS were injected into the same site. After injection, the mice were marked with ear tags for accurate group identification. Luciferase reporters were used to monitor brain metastases, with bioluminescence signals measured weekly. The operator performing IVIS (In Vivo Imaging System) imaging was blinded to group assignments, ensuring the study was conducted in a blinded manner to minimize bias and maintain result integrity.
The mice were anesthetized with 2% isoflurane and positioned in a stereotactic device before intracardiac injection. Weekly assessments of bioluminescence signals and body weight were conducted to evaluate tumor growth and confirm brain metastases. Our results demonstrated that mice injected with EGFR-overexpressing PC9 cells exhibited a significantly higher rate of brain metastases compared to those injected with parental PC9 cells (P < 0.05) (Fig. 6).
Fig. 6
Figure A-B presents the distribution of brain metastases in the control group. C-D presents the distribution of brain metastases in overexpression of the EGFR protein group (EGFR-amp). E shows the brain metastasis rate between EGFR-amp and the control group. F shows the distribution of brain metastases in the loss of function of EGFR protein group (EGFR-sh)
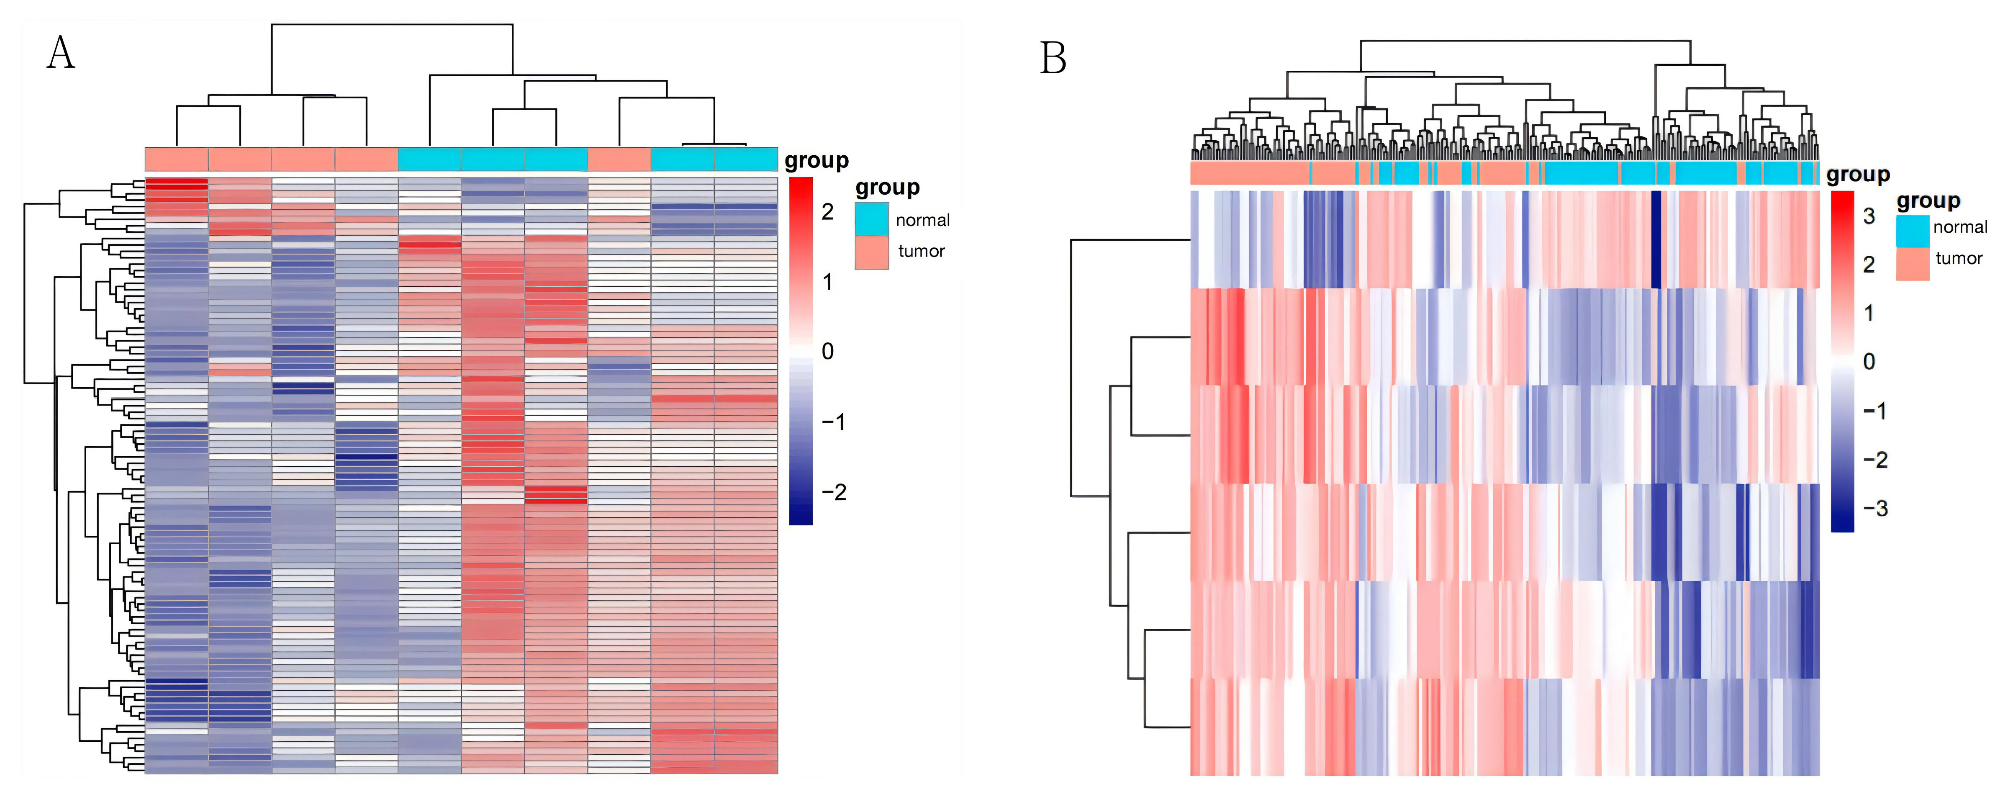
RNA Sequencing Results of EGFR Overexpression in The PC-9 Cell Line Vs. The Parental PC-9 Cell LineThe heatmap of gene expression revealed that the samples were classified into two groups: control and EGFR amplification. The results showed that genes with significantly higher expression included H2AX, TERT, HSD17B10, CITED4, COL13A1, NOMO3, NCEH1, SOCS2, LGALS1, and ANKRD29. Genes with significantly lower expression included TINCR, CYP4F12, PGLYRP3, CYP4F3, KRT16, BCAS1, KDM7A, TLE2, CD82, and ACKR3. To explore the potential biological functions of the differentially expressed genes (DEGs), we performed Gene Ontology (GO) enrichment analyses, focusing on biological processes (BP), cellular components (CC), and molecular functions (MF). The results showed that DEGs in BP were significantly enriched in epidermis development, skin development, and the negative regulation of cell adhesion. For cellular components, DEGs were mainly enriched in collagen-containing extracellular matrix, apical plasma membrane, and endoplasmic reticulum lumen (Fig. 7).
Fig. 7
Heatmap of differentially expressed genes between EGFR-amp versus control group (Left). Bubble chart plotted against the results of GO analysis for the differential expression (Right)
Comments (0)