
Remember me
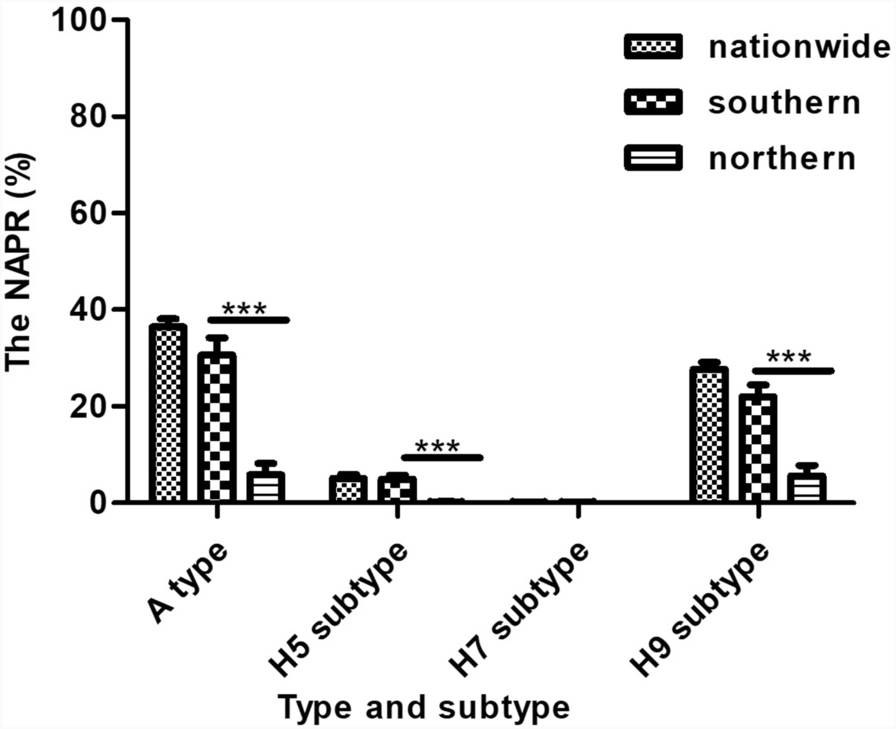


A total of 64,599 samples were collected and tested for influenza A virus, and nucleic acid tests were also carried out for the three subtypes (H5, H7, and H9). The NAPR of the A type in the environment of LPMs nationwide was 36.15%, of which the NAPR of the H9 subtype was the highest (29.74%), the H5 subtype was 6.18%, and the H7 subtype was 0.30%.
The NAPR of the A type influenza virus in the nine PLADs in the southern China was higher than 30%, with an average of 43.56%. Jiangxi, Yunnan, and Guangxi accounted for the top three PLADs, with positive rates of 82.3%, 49.41%, and 45.47%, respectively. The NAPR of the other six PLADs was between 30.52% and 38.02%. In the northern China, only Gansu Province, which is adjacent to Sichuan Province, had a higher NAPR of 28.63%, 11 PLADs were from 3.30 to 16.59%, and three PLADs were less than 0.80% (Table 1).
Table 1 The average NAPR of the A type in the environment of LPMs in each provincial-level administrative division (PLAD) located in the southern and northern China respectively. LPM Live poultry market, NAPR Nucleic acid positive rateThe NAPRs of the H9 and H5 subtypes in PLADs located in the southern China were 33.37% and 7.90%, respectively, which were significantly higher than those of PLADs located in the northern China (P < 0.05) (Fig. 1).
Fig. 1
Average NAPR of the A type and the H5, H7, and H9 subtypes in the environment of LPMs of across China and in the southern and northern China. Asterisks (***) represent significant differences at P < 0.05. LPM Live poultry market, NAPR Nucleic acid positive rate
NAPR of AIVs in different types of samplesThe NAPRs of AIVs in feces, breeding cages, drinking water, sewage, and chopping boards were analyzed. In the southern China, the NAPRs of the H5, H7, and H9 subtypes were compared, and a significant difference (P < 0.05) was found among the different sample types. The NAPRs of the H9 subtype were higher in drinking water and sewage (40.97% and 37.27%, respectively) than in other samples, with less than 8% in breeding cages and chopping boards. The NAPRs of the H5 subtype were significantly higher (P < 0.05) in sewage and boards (10.74% and 10.86%, respectively) than in feces, breeding cages, and drinking water. The NAPRs of the H7 subtype were higher in boards and breeding cages (7.68% and 6.46%, respectively).
In northern China, the NAPR of the H9 subtype was the highest (12.9–15.85%) in all five kinds of environmental samples analyzed, and that of the H7 subtype was the lowest (0.05–0.21%). The NAPRs of the H9 and H7 subtypes were statistically analyzed, and no significant differences were observed among the different samples (P > 0.05). The NAPR of the H5 subtype was significantly different in the different samples (P < 0.05), with 1.30% in feces, which was higher than that of the other sample types (Table 2).
Table 2 Nucleic acid positive rates (NAPRs) of the avian influenza virus A type and the H5, H7, and H9 subtypes in five types of environmental samples collected from live poultry markets in the southern and northern ChinaSeasonality of NAPR of AIV during 2019–2023In the southern China, the NAPR of the A type peaked from January to February. The NAPR of the H9 subtype peaked between January and February from 2019 to 2020 and in October from 2021 to 2023. The NAPR of the H5 subtype peaked only in January and February from 2019 to 2020, and there was no obvious fluctuation between 2021 and 2023. In the northern China, the NAPRs of the A type and H9 subtype peaked between December and February, and there were no obvious fluctuations in the H5 and H7 subtypes. (Fig. 2 and supplementary 1–2).
Fig. 2
Seasonality of the nucleic acid positive rate (NAPR) of the avian influenza virus A type and the H5, H7, and H9 subtypes in the environment in the northern China and southern China during 2019–2023. Bluish-purple lines represent the A type; blue lines represent the H5 subtype; green lines represent the H7 subtype; and orange lines represent the H9 subtype
Diversity of influenza subtypes isolated from environmental samples of LPMsA total of 64,599 environmental samples were collected during virus isolation, and 456 AIV strains were obtained. Nineteen subtypes were isolated from the environmental samples collected from LPMs for the period from 2019 and 2023: H1 N1, H1 N2, H1 N3, H2 N3, H3 N2, H3 N3, H3 N8, H4 N2, H4 N6, H4 N9, H5 N1, H5 N6, H5 N8, H6 N6, H7 N9, H9 N2, H10 N3, H11 N2, and H11 N3. Of these subtypes of AIVs, the H9 N2 subtype had the highest proportion, varying between 62.50% and 69.88% during the study period, except for 2022 (40.16%). The proportion of the H5 subtype from 2019 to 2021 was 15.05–16.47%, which decreased significantly to 8.20% and 4.20% in 2022 and 2023, respectively. The proportion of the H3 subtype was 5.68–7.40% between 2019 and 2021 and increased to 21.95% and 12.50% in 2022 and 2023, respectively. The H6 subtype accounts for the highest proportion (12.50%) in 2023 (Fig. 3 and supplementary 3).
Fig. 3
Proportions of the H9, H5, H3, and H6 avian influenza virus subtypes and other subtypes isolated from environmental samples collected from live poultry markets during 2019–2023
For the H5 subtype, three NA subtypes were isolated: N1, N6, and N8. The H5 N6 subtype accounted for the highest proportion of viruses isolated from chopping boards (32.26%), followed by cages (13.58%). The H5 N6 subtype was isolated from four environmental sample types, except for the chopping boards, and the proportions were 1.56–2.78%. The H5 N8 subtype was isolated only from feces and chopping boards. Both the H6 N6 and H3 N2 subtypes accounted for higher proportions in feces (12.50% and 11.11%, respectively) and sewage (9.38% and 15.63%, respectively) (Table 3). The H9 N2 subtype was isolated from five different sample types. The proportion of the H9 N2 subtype was higher than 60% in drinking water (78.43%), breeding cages (69.14%), and sewage (62.50%).
Table 3 Subtype proportions of avian influenza viruses isolated from environmental samples
Comments (0)