Human specimens
HCC tissues were obtained from patients who underwent curative surgery at Mengchao Hepatobiliary Hospital of Fujian Medical University. Sample collection and use were approved by Medical Ethics Committee of Mengchao Hepatobiliary Hospital of Fujian Medical University (2022_018_01). Meanwhile, informed consent was provided by the patients.
Cell line
The human HCC cell line SNU-449, Huh7, SK-Hep-1, Hep3B, SNU-398 and C3A were obtained from the American Type Culture Collection (ATCC, USA). The mouse HCC cell line Hepa1-6 and human HCC SMMC-7721 cells were acquired from the cell bank of the National Collection of Authenticated Cell Cultures, China. All cells were cultured in a complete medium (MEM, DMEM, RPMI-1640) (Hyclone, USA) supplemented with 10% fetal bovine serum (Hyclone, USA) at 37ºC, 5% CO2.
CRISPR library screening for genes mediating lenvatinib resistance
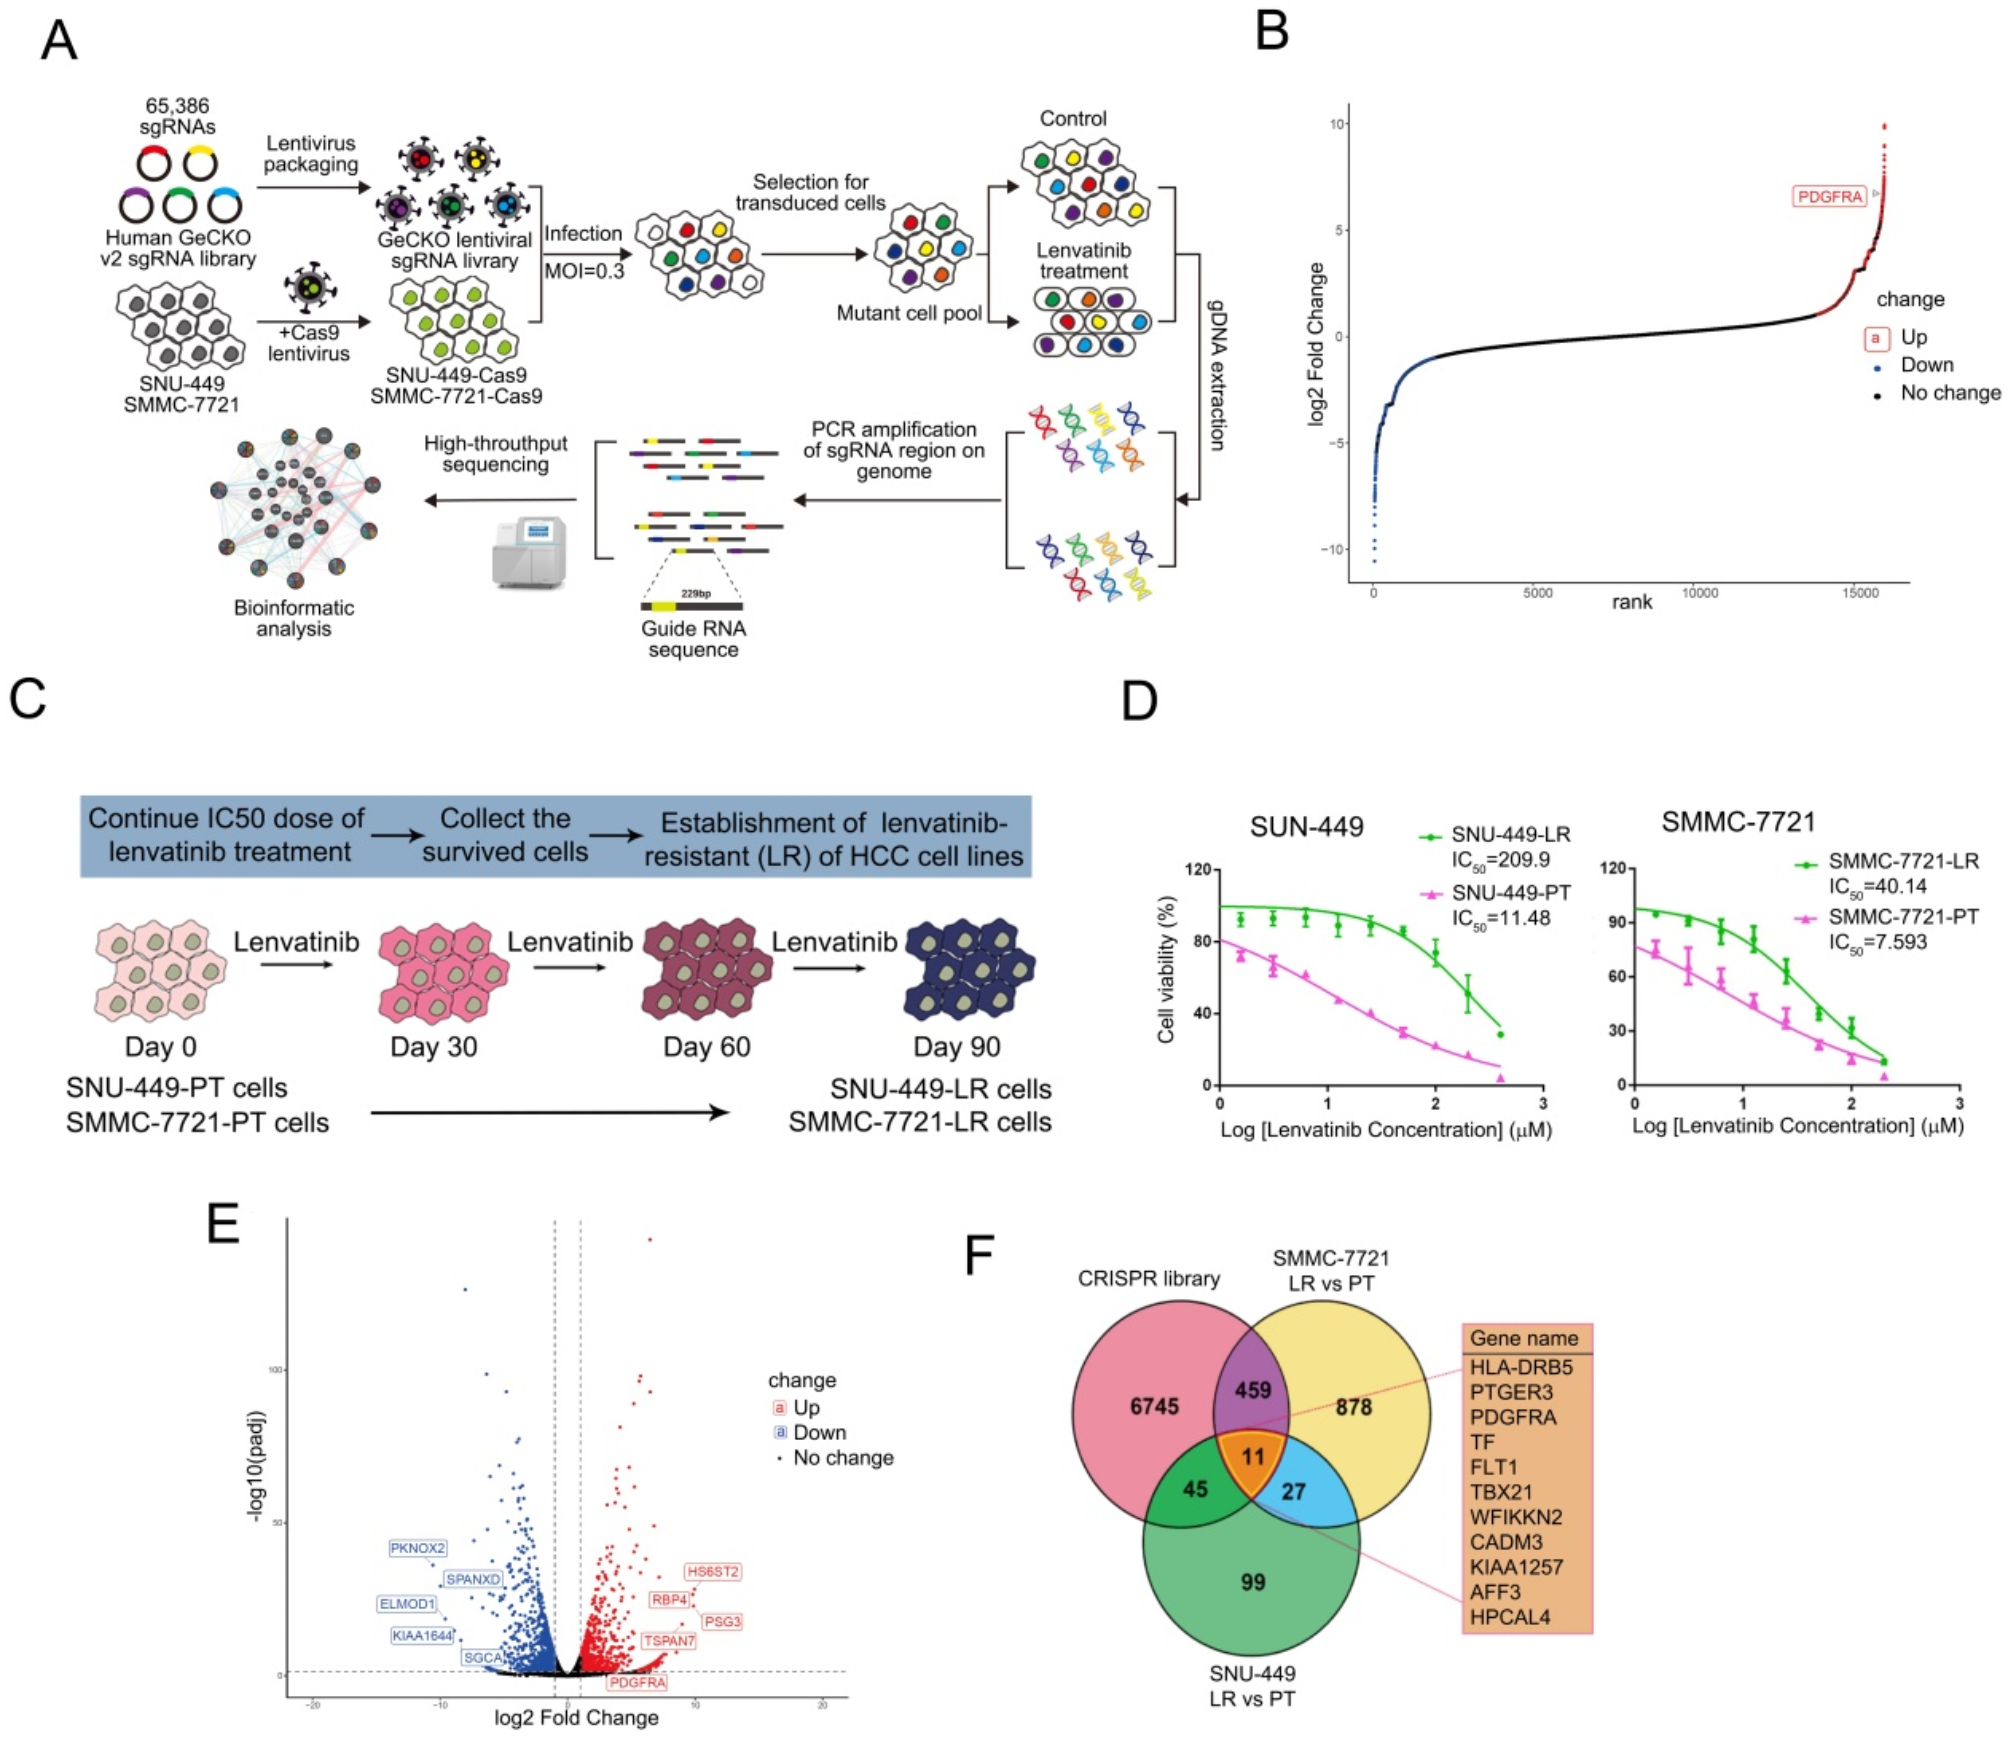
The GeCKO v2 CRISPR library (Addgene, USA) was employed to identify genes implicated in lenvatinib resistance. In accordance with established protocols, the library plasmids were subjected to transformation and extraction, complemented by rigorous quality control measures. RNA sequencing was conducted to ascertain the integrity of the library plasmids. Additionally, the lentiviral plasmid lenti-Cas9-blast was procured from Addgene (USA) and utilized for the generation of lentiviruses expressing Cas9. SNU-449 or SMMC-7721 cells were infected with these lentiviruses at a multiplicity of infection (MOI) of 10. Following infection, blasticidin selection was applied after 48 h, and Western blot analysis was performed to verify the overexpression of the Cas9 protein. Upon reaching a cell density of approximately 10%, puromycin was introduced at varying concentrations (0, 1, 2, 3, 4, 5, 6, 7, and 8 µg/ml), with the culture medium being refreshed every three days. Following a six-day incubation, cell viability was assessed using the CCK8 assay to ascertain the minimum antibiotic concentration necessary to eliminate all wild-type cells. The sgRNA library lentivirus was packaged while adhering to the same protocol as the Cas9 lentivirus preparation, and the lentiviral titer was determined. SNU-449-Cas9 cells were then stably transduced with the sgRNA library lentivirus at an MOI of 0.3 in the presence of polybrene, followed by puromycin selection for seven days. The surviving SNU-449 cells were designated as CRISPR library cells and were subjected to sequential screening with increasing concentrations of lenvatinib (10, 15, 20 and 30 µM) to identify genes associated with lenvatinib resistance.
Establishment of lenvatinib-resistant cell lines
An intermittent drug induction method was employed to establish lenvatinib-resistant cell lines. Initially, the half-maximal inhibitory concentration (IC50) of lenvatinib for the wild-type liver cancer cell lines SNU-449 and SMMC-7721 was determined using the Cell Counting Kit-8 (CCK-8) assay. Thereafter, cells in the logarithmic growth phase were progressively exposed to increasing concentrations of lenvatinib. After 12 weeks of continuous cultivation, the IC50 values for the newly established resistant cell lines were determined. The two lenvatinib-resistant cell lines were then maintained through continuous culture in the presence of lenvatinib, ensuring their sustained resistance phenotype.
Transcriptome sequencing
Transcriptome sequencing of the cells was conducted at Berry Hekang Biotechnology Corporation (Beijing, China). Total cellular RNA was extracted, followed by a stringent quality assessment to evaluate the purity, concentration, and integrity of the RNA. mRNA was isolated through hybridization to oligo dT magnetic beads and then subjected to controlled fragmentation. The fragmented mRNA served as a template for reverse transcription using either random hexamers or oligo dT primers, yielding cDNA. The cDNA library was subsequently sequenced employing a high-throughput sequencing platform, yielding an abundance of sequence data. Then, a thorough differential expression analysis was performed to delineate the transcriptomic alterations in lenvatinib-resistant cell lines.
Overexpression and knockdown cell lines
PCDH-CMV-3xFlag-copGFP-puro was chosen for lentivirus packaging for PDGFRA overexpression. sgRNAs targeting PDGFRA were designed to transfect pBOB-CAS9 and screened by puromycin. The sgPDGFRA primers were as follows:
sgPDGFRA-1: F: CACCGAAAGCCCTGTCTGCTGTCGT,
R: AAACACGACAGCAGACAGGGCTTTC,
sgPDGFRA-2: F: CACCGTCGGGATCAGTTGTGCGACA,
R: AAACTGTCGCACAACTGATCCCGAC.
All selected cell lines were assessed for the expression levels of the target gene PDGFRA using the Western blotting assay.
Quantitative PCR (qPCR)
Total RNAs were extracted using TransZol Up Plus RNA kit (Beijing TransGenBiotech, China) and quantified by Nanodrop 2000 (ThermoFisher, USA). 1 µg of total RNA was reverse-transcribed into cDNA by Transcriptor First Strand cDNA Synthesis Kit (Roche Ltd., Basel, Switzerland). Quantitative PCR was performed with SYBR Green qPCR Master mix (DBI-2233, DBI, Germany). Human 18 S rRNA was used as endogenous control. RT-qPCR was carried out under the following conditions: 95 °C for 5 min, 40 cycles at 95 °C for 10 s, 60 °C for 30 s and 72 °C for 30 s. The relative expression of RNA was calculated using the 2-ΔΔCt method.
The qPCR primer sequences were as follow:
PDGFRA-F: (5’-3’) GACTTTCGCCAAAGTGGAGGAG;
PDGFRA-R: (5’-3’) AGCCACCGTGAGTTCAGAACGC.
Western blot analysis
Total proteins were extracted by using RIPA buffer (Beyotime) supplemented with 1% protease inhibitor cocktails (Roche), and the concentration of proteins was measured using the BCA Protein Assay Kit (Transgene). The proteins were loaded and resolved on 10% SDS-PAGE (Bio-Rad) and transferred to nitrocellulose membranes (PALL Corporation). After blocking in 5% skim milk for 1 h at room temperature, the membranes were incubated with primary antibodies overnight at 4ºC. The membranes were incubated with horseradish peroxidase (HRP)-conjugated secondary antibodies (Abcam) for 1 h at room temperature. The blot signals were visualized using ECL reagent (ThermoFisher) and detected using the ChemiDoc MP Imaging System (Bio-Rad).The primary antibodies were as follows: β-actin (ab115777; Abcam), mTOR (2983P, CST), p-mTOR (5536P, CST), AKT (4691p, CST), p-AKT (4060p, CST), MEK (9122, CST), p-MEK (9121, CST), ERK (ab17942, abcam), p-ERK (4370, CST), PTEN (9188,CST), GSK3β (12456, CST), p-GSK3β (9323,CST), GADPH (5174T, CST), PDGFRA (60045-1-lg, proteintech), and β-catenin (8480p, CST),
Colony formation assay
The cell lines were seeded in a six-well plate (2 × 10³ cells/well), ensuring a uniform distribution of cells across the surface. Then, the plates were cultured with complete medium at 37 °C and 5% (vol/vol) CO2. The cells were then allowed to adhere and grown for a period of 10–14 days. After the incubation period, cells were stained with 0.5% crystal violet to visualize the clones. Photographs were captured, and the number of colonies was counted using Image J software.
Patient-derived organoids (PDO)
Firstly, the tissues derived from patients were mechanically cut into small pieces of 1-3mm3. Then the tissue fragments were digested with 10mL of Tumor Tissue Digestion Solution (K601003, bioGenousTM) in a 15mL conical tube at 37 °C, with variable incubation times ranging from 15 to 45 min. The digestion was terminated with FBS (10%) addition. Then, the suspension was filtered with 100 μm strainer and centrifuged for 3 min at 300 g. Aspirate The supernatant was aspirated and the pellet was resuspended in ECM (M315066, bioGenousTM). The PDOs were seeded in 24-well plates. The plates were placed into a humidified incubator at 37 °C and 5% CO2 for 15–25 min to let the ECM solidify. Organoid complete medium (K2105-HCC, bioGenousTM) was added to each well. Organoids were passaged after dissociation with Organoid Dissociation Solution (E238001, bioGenousTM). For storage, the organoids were resuspended in Organoid Cryopreservation Medium (E238023, bioGenousTM) and frozen following standard procedures.
To evaluate the cell killing effect of avapritinib and lenvatinib in PDOs, the PDOs were seeded in 96-well plates and further incubated for 24 h. Thereafter, complete growth medium containing increasing concentrations of avapritinib and lenvatinib were added into the PDOs. Then, the PDOs were incubated for another 72 h. Afterwards, the PDOs were stained with Calcein-AM and propidium iodide (PI) for 30 min and then imaged by confocal laser scanning microscope. The cytotoxicity of avapritinib and lenvatinib in PDO was quantified by CellTiter-Glo®3D Cell Viability Assay (Promega, G9681). CellTiter-Glo®3D Reagent was added to the PDOs, and shaking for 5 min was performed. After 25 min incubation, the chemiluminescence was determined using a microplate reader according to the manufacturer instructions.
Animal experimentation
All animal experiments were conducted in strict accordance with protocols approved by the Animal Ethics Committee of Mengchao Hepatobiliary Hospital of Fujian Medical University (MCHH-AEC-2022-12). For the subcutaneous tumor model, wild-type SMMC-7721 cells and lenvatinib-resistant SMMC-7721 cells (5 × 10⁶cells/mouse) were subcutaneously injected into the right axilla of 6-week-old male NCG mice (n = 5 per group). Tumor volume was determined using caliper measurements and calculated using the modified ellipsoidal formula: tumor volume = 0.5×length×width2. Upon reaching a tumor volume of approximately 200 mm3, mice were randomly assigned to one of three treatment groups, with treatments administered five days per week: those implanted with wild-type SMMC-7721 cells received either vehicle control or lenvatinib (4 mg/kg, orally), whereas those with lenvatinib-resistant cells were treated with lenvatinib (4 mg/kg, orally).
For further assessment, SMMC-7721 lenvatinib-resistant cells (5 × 10⁶ cells/mouse) were subcutaneously injected into the right axilla of 6-week-old male NCG mice (n = 5 per group). Once the tumor volume reached approximately 200 mm^3, mice were randomly assigned to receive treatment five days per week with either vehicle, lenvatinib (4 mg/kg, oral gavage), avapritinib (10 mg/kg, oral gavage), or a combination of both drugs, administered at the same dosage and schedule as monotherapy. In addition, SMMC-7721 cells overexpressing PDGFRA were implanted subcutaneously in NCG mice, following the same methodology. After tumor establishment, these mice were similarly assigned to the corresponding treatment groups.
For orthotopic tumor model, male C57L/J mice (8–10 weeks old, n = 10 per group) were orthotopically implanted with 5 × 10⁵ Hepa1-6 cells. The cells were suspended in a 25 µl mixture of serum-free DMEM and Matrigel (BD Biosciences) at a 1:1 ratio. Under isoflurane anesthesia, an 8-mm transverse incision was made in the upper abdomen, and the cell suspension was injected directly into the left hepatic lobe using a microsyringe. Mice implanted with Hepa1-6 cells or PDGFRA-overexpressing Hepa1-6 cells were randomly assigned to receive either vehicle control or lenvatinib (4 mg/kg, via oral gavage) for three weeks. For mice implanted with PDGFRA-overexpressing Hepa1-6 cells, treatment was administered five days per week with either PBS, lenvatinib (4 mg/kg), avapritinib (10 mg/kg), or a combination of both drugs, following the same dosing and scheduling as the monotherapy. After three weeks of treatment, half of the mice were euthanized.
Body weight was monitored throughout the treatment period, and tumor weight was measured at the study’s endpoint. Tumor fluorescence intensity was monitored using the IVIS Spectrum Animal Imaging System (PerkinElmer, USA). For survival analysis, treatment continued until the tumor fluorescence intensity reached 109.
Patient-derived xenografts (PDXs)
Surgically resected tumor tissues from HCC patients were utilized for xenotransplantation following informed consent and approval by the Medical Ethics Committee of Mengchao Hepatobiliary Hospital of Fujian Medical University (MCHH-AEC-2022-12). Patient-derived samples were collected, trimmed, and sectioned into fragments measuring 20–30 mm³. These fragments were subcutaneously implanted into the right axilla of anesthetized, 6–8-week-old male NCG mice within two hours post-resection. Tumor growth was monitored every three days using calipers, and the establishment of PDXs in each mouse was confirmed over a minimum period of three months. Once the tumors reached a volume of 1000 mm³, the mice were euthanized, and tumor fragments were excised for implantation into the right axillary region of subsequent generations of NCG mice. Tumors were passaged once before being implanted subcutaneously into new NCG mice. When the tumor volume approximated 200 mm³, the mice were randomly assigned to receive treatment five days per week with either vehicle control, lenvatinib (4 mg/kg, via oral gavage), avapritinib (10 mg/kg, via oral gavage), or a combination of both drugs, following the same dosage and schedule as the monotherapy.
Hematoxylin and eosin staining and immunohistochemistry
Tumor samples were formalin-fixed, paraffin-embedded, and sectioned at 4 μm thickness for staining with hematoxylin and eosin (H&E) and immunohistochemistry.
Immunohistochemical analysis was performed using the PDGFRA antibody (sc-398206, Santa Cruz) on formalin-fixed paraffin-embedded HCC samples. Xenografted tumors were similarly probed with antibodies against Ki-67 (D2H10, CST) and PDGFRA. After primary antibody incubation, positive staining was visualized using DAB + as a chromogen.
Quantitative analysis was conducted using QuPath (0.4.3) software, assessing the percentage of positively stained cells and staining intensity per high-power field in representative sections. H-score assessment was also performed using QuPath (0.4.3). Membrane PDGFRA staining was categorized and scored as follows: 0 for no staining, 1 + for light staining visible at high magnification, 2 + for intermediate staining, and 3 + for dark staining visible at low magnification. The H-score was calculated using the formula: 1×(% of 1 + cells) + 2×(% of 2 + cells) + 3×(% of 3 + cells). Each patient was assigned a score from 0 to 300, with a threshold of 200 used for discrimination. An H-score below 109.5 indicated low PDGFRA expression, while an H-score of 109.5 or above was considered high PDGFRA expression.
Statistical analysis
All data analyses were performed using GraphPad (version 8.0). The data are presented as the mean ± SD with minimally three independent replicates. Statistical analyses of normally distributed variables were performed using the Student’s t test, and analyses of data with skewed distributions were performed using the Mann-Whitney U test.


Comments (0)