
Remember me


Provided that TGFβ induces myofibroblastic differentiation, and based on our previous study where C2-CAF demonstrated myofibroblastic phenotype; we first tested if C1-CAF may acquire status of C2-CAF upon TGFβ induction. Interestingly, stimulation of TGFβ (10 ng/ml) led to a significant increase in frequency of cells having αSMA-positive stress fibers in all three tested, patient-derived C1-CAF; indicative of myofibroblastic differentiation (Figure S1 A). Moreover, TGFβ-induction resulted in gain of C2-CAF associated genes (FN1, SERPINE1, ITGB1); while, genes associated with C1-CAF state (FOXF1, EYA1, RUNX2) were downregulated compared to untreated control, suggesting TGFβ-induced transition of C1-CAF to C2-CAF status (Figure S1B). αSMA is associated with contractile apparatus of smooth muscle cells and myofibroblasts and exhibits matrix remodelling ability [34]. Notably, TGFβ-induced CAF had better matrix remodelling ability than untreated C1-CAF group (Figure S1 C, i-ii). Taken together, TGFβ-induction clearly converted C1-CAF (αSMAlow) to C2-CAF (αSMAhigh). For ease of understanding, we have labelled C1-CAF as UT-CAF and TGFβ-induced C1-CAF as TGF-CAF.
To explore tumor-stroma interaction, UT-CAF or TGF-CAF were co-cultured with cancer cells. Following co-culture, cells were separated using FACS and bulk-RNAseq was performed on sorted cells, subsequently (Fig. 1A). We found that 886 and 1065 genes were upregulated and downregulated respectively (log2 FC > 1, p value ≤ 0.05) in TGF-CAF compared with UT-CAF (Table S1). Gene set enrichment [37], with Cytoscape analyses, suggested the enrichment of key regulatory pathways involving RTKs, PI3 K/AKT, focal adhesion, JAK-STAT pathway, cytokines- and interleukins-mediated pathways (Table S2) in TGF-CAF (Figure S2 A-D). Receptor tyrosine kinases (RTKs) are key regulatory trans-membrane receptors which made them suitable candidates for therapeutic target [38]. Activation of RTK leads to downstream activation of MAPK and PI3 K-AKT pathway. With the aim to identify the common regulators among RTKs; TEK (Tie2), ERBB3, FGFR2, EREG, TGFA, FGF5, MET, and FGF2 were commonly upregulated in TGF-CAF (Fig. 1B, S2E), with Tie2 being the most upregulated RTK among these common genes. Also, genes associated with Tie2 signaling were significantly enriched in TGF-CAF (Figure S2 F-i) and Tie2 upregulation was verified by qPCR (Figure S2 F-ii). This observations collectively prompted us to explore the expression and function of Tie2 in oral-CAF in response to TGFβ.
Fig. 1
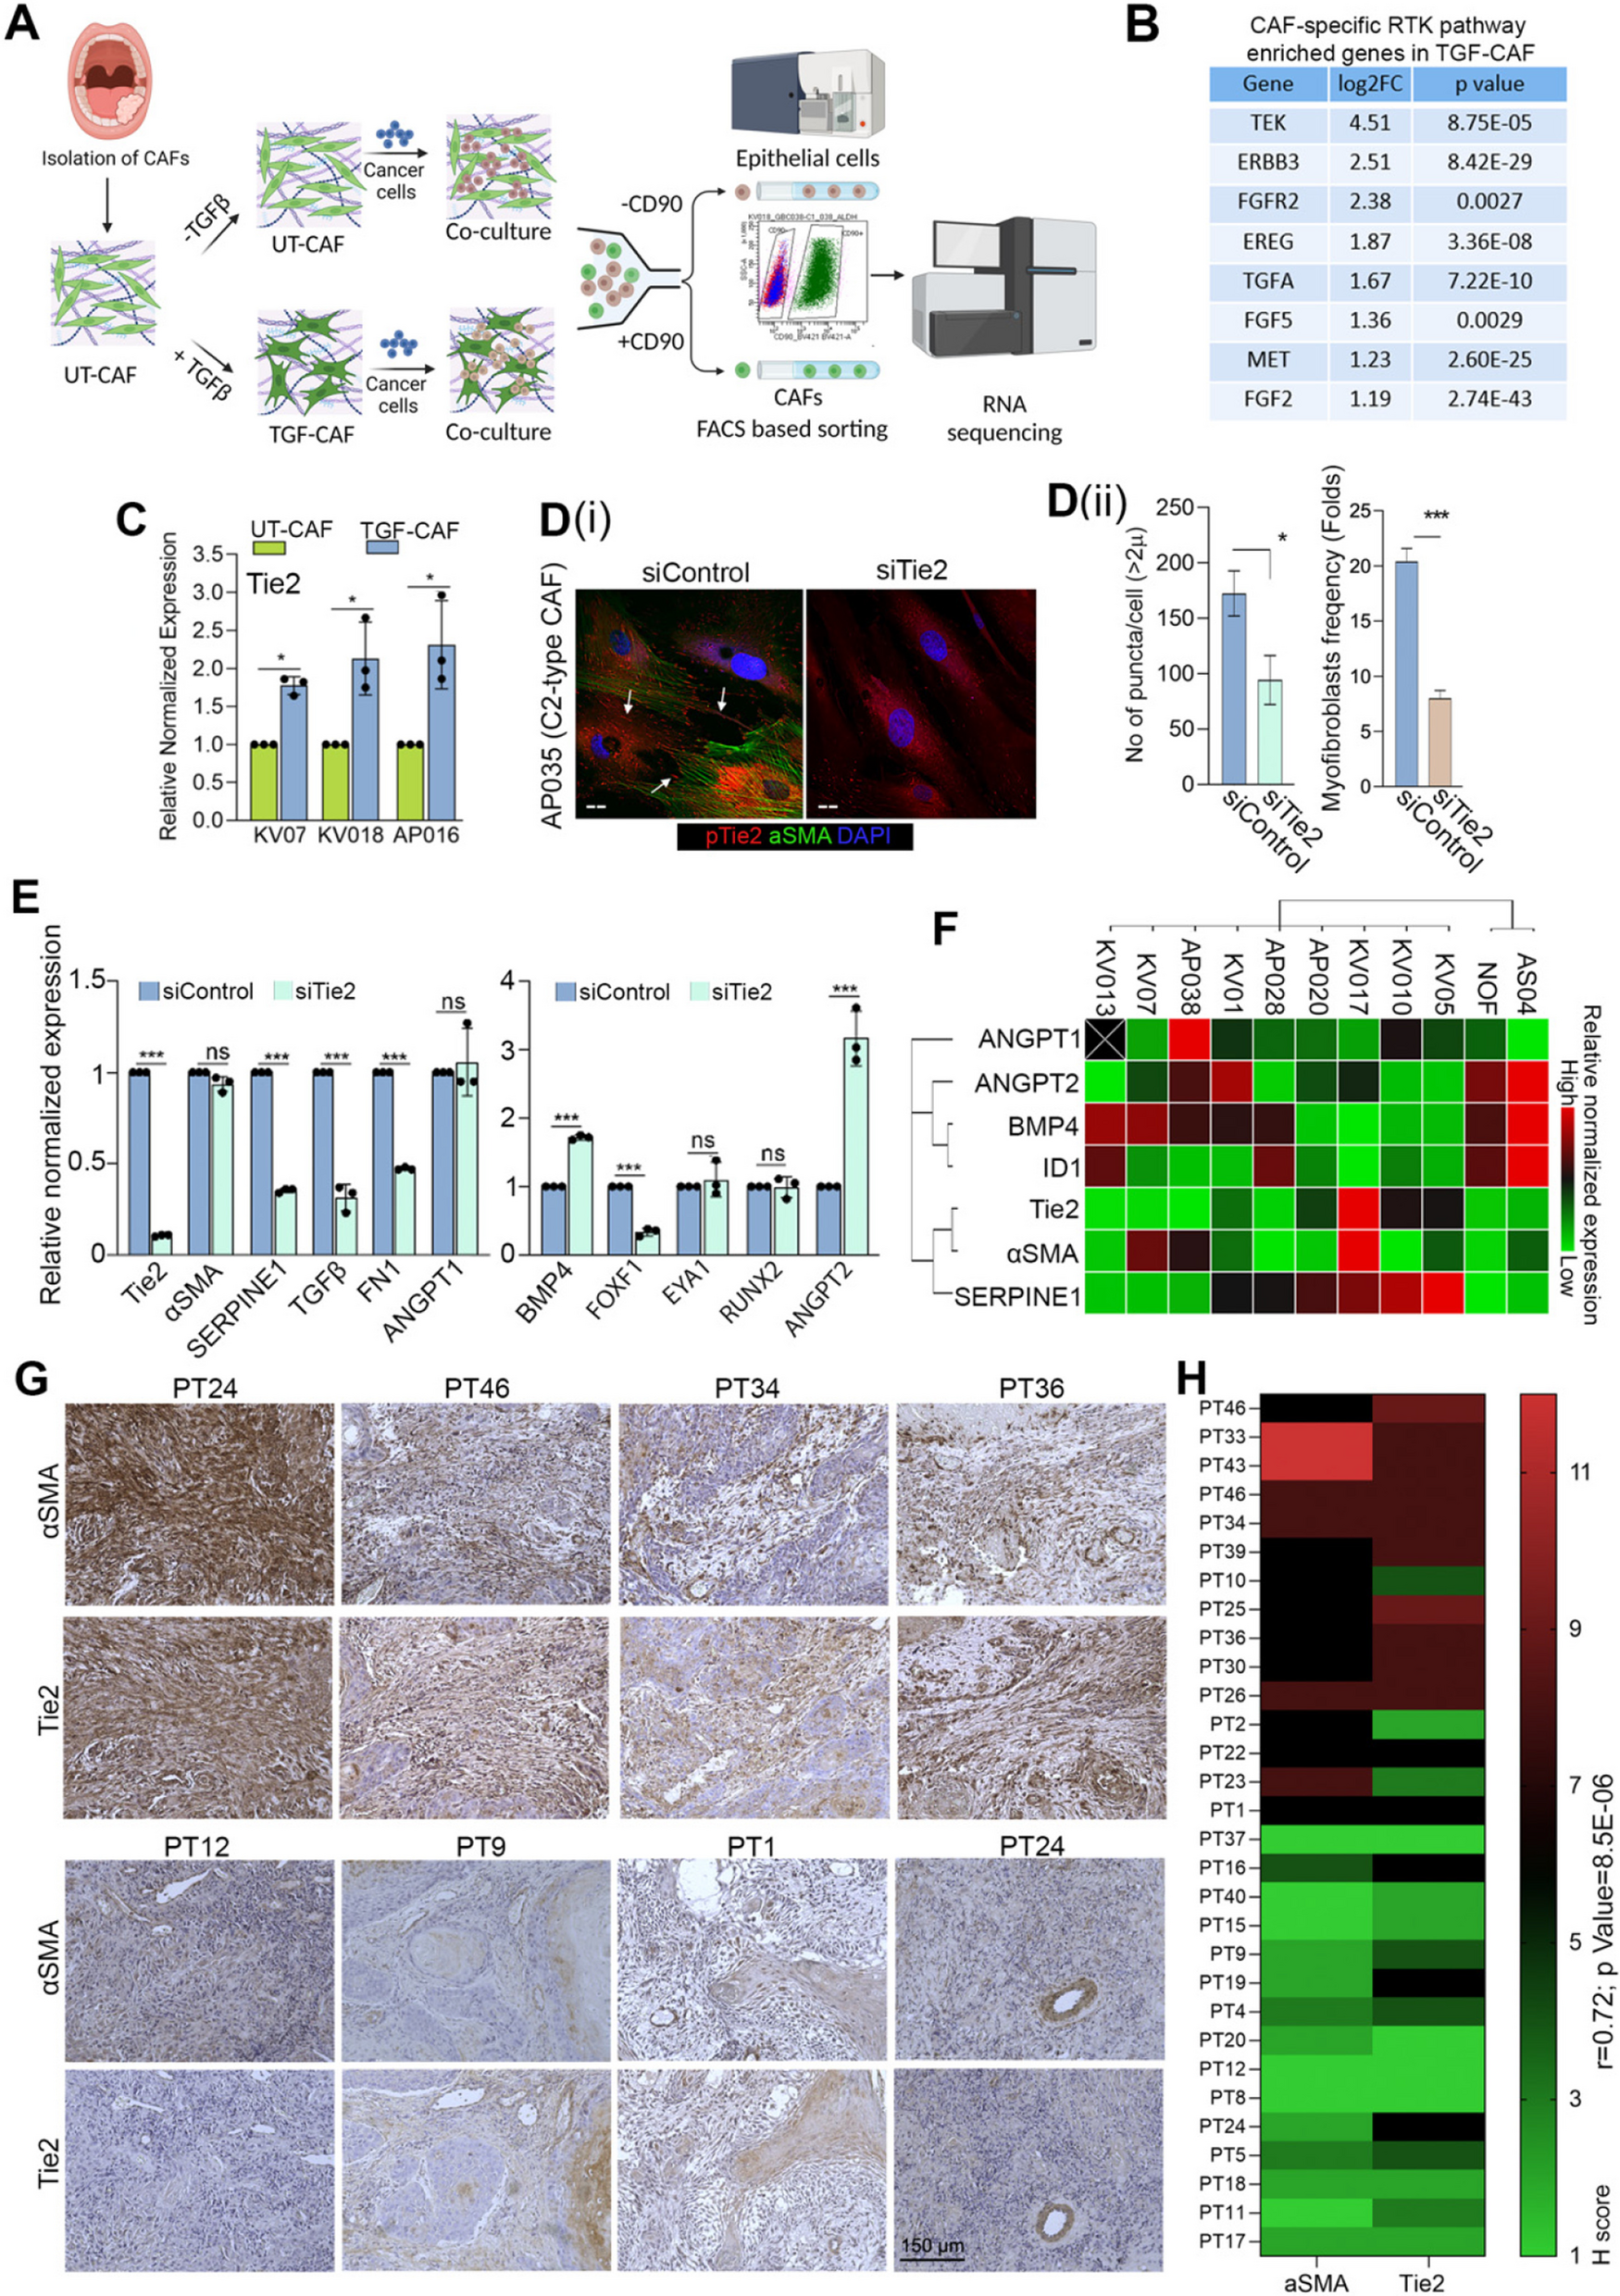
C2-CAF expressed higher levels of Tie2 and positively correlated with αSMA-high stromal fibroblasts in primary tumors.(A) A schematic depicting the experimental design for co-culture of UT-CAF and TGF-CAF with cancer cells and downstream processing. (B) List of eight common upregulated genes between RTK, PI3 K, MAPK in TGF-CAF. (C) qPCR analysis of Tie2 in three different primary CAF under untreated (UT-CAF) or 10 ng/ml TGFβ-induced (TGF-CAF) conditions. (D) (i) Images of constitutively activated C2-CAF (AP035), stained for aSMA (green), pTie2 (Y992) (Red), and nucleus (DAPI, purple) after RNAi mediated silencing of Tie2 (siTie2). Scrambled siRNA (siControl) was used as a control. Arrowhead indicates pTie2 (Y992) positive puncta. (ii) frequency of CAF with myofibroblast-phenotype (with aSMA- positive stress fiber) and pTie2 (Y992) puncta was quantified using ImageJ. Scale bars, 20 µm. (E) qPCR analysis of C1-CAF related genes (BMP4, EYA1, RUNX2, FOXF1, ANGPT2) and C2-CAF related genes (Tie2, TGFꞵ, SERPINE1, aSMA, FN1, ANGPT1) in constitutively activated C2-CAF following Tie2 knock-down. (F) Heatmap showing qPCR-based expression of C1- and C2- CAF related genes across different primary CAF from oral cancer patients and normal oral fibroblasts. (G) Representative images of human oral tumor tissues detected for αSMA and Tie2 protein expression using IHC. (H) Heatmap showing correlation between H-score of αSMA and Tie2 protein in oral tumor stroma. Scale bars = 20 µm. *P<0.05, **P<0.01, ***P<0.001
Interestingly, after TGFβ treatment, direct upregulation of Tie2 was observed in all tested CAF, independent of co-culture with cancer cells (Fig. 1C). Thus, we first explored the Tie2 association with myofibroblastic phenotype and maintenance of C2-like state of CAF. Interestingly, silencing of Tie2 in patient derived C2-CAF resulted in significant loss of myofibroblasts frequency, compared to control (Fig. 1D, i-ii). Reduced Tie2-phosphorylation (Y992) of the activation loop suggest the downregulation of Tie2-activity [39, 40]. Upon Tie2-silencing we observed the loss of phosphorylated Tie2 (Y992) puncta, possibly due to the reduced number of mature focal adhesions [41]. Importantly, Tie2 silencing in C2-CAF also resulted in concomitant downregulation of tested C2-CAF related genes (SERPINE1, FN1, TGFβ) whereas the C1-CAF related gene BMP4 was upregulated. Additionally, ANGPT2 was upregulated in Tie2 silenced C2-CAF without having any effect on its agonist, ANGPT1 (Fig. 1E). Therefore, to substantiate, we further explored this correlation in ten different oral tumor derived CAF and normal oral mucosal fibroblast (NOF). Interestingly, gene expression based unsupervised clustering grouped Tie2 with αSMA and SERPINE1; whereas ANGPT2 clustered with BMP4 and its downstream gene ID1. ANGPT1 expression did not specifically associate with any specific group (Fig. 1F). Collectively, results established a strong correlation between Tie2 expression with myofibroblastic C2-like state of CAF. Encouraged from these results, we evaluated the tumor stromal expression of αSMA and Tie2 on serial sections of surgically resected human oral tumor tissues (n = 30) (Fig. 1G). To our interest, we observed significantly higher H-score of Tie2 in tumors having αSMA-high stromal fibroblasts as compared to tissues having αSMA-low stroma (Fig. 1H); strongly suggesting the presence of Tie2-positive CAF in oral tumor stroma.
Tie2 plays an essential role in induction as well as sustenance of TGFβ-induced myofibroblastic differentiation of CAFTie2 silencing experiment clearly suggested that Tie2 function may be required for TGFβ-induced myofibroblastic differentiation. We next used a commercially available small molecule inhibitor, selective against Tie2 kinase (Tie2i) [42]. Similar to our observation with Tie2 silencing, one hour pre-treatment with Tie2i before TGFβ induction showed significantly less frequency of myofibroblasts compared to DMSO control (Fig. 2A) in two different patient-derived C1-CAF. More importantly; even after CAF were successfully induced to myofibroblasts by TGFβ, Tie2i effectively reversed this myofibroblast phenotype (Fig. 2A) and downregulated C2-CAF associated genes αSMA, SERPINE1 and Tie2 (Figure S3 A, S3B).
Fig. 2
Tie2 plays essential role in induction as well as sustenance of TGFβ-induced myofibroblastic differentiation of CAF. (A) (i) Representative images and quantification of myofibroblasts frequency in UT-CAF and TGF-CAF. Tie2-inhibitor was added 1 h before TGFβ induction (Tie2i > > TGF-CAF) or 48 h after TGFβ induction (TGF-CAF > > Tie2i). Cells were quantified using ImageJ. (ii-iii) Frequency of αSMA stress fibre-positive cells were plotted for three different patient derived CAF. (B) (i) Representative images of Tie2 and pTie2 (Y992) in UT-CAF and TGF-CAF after Tie2-inhibition for 1 h before (Tie2i > > TGF-CAF) or 6 h after TGFβ induction (TGF-CAF > > Tie2i). (ii-v) Bar graph showing quantification of total Tie2 protein and pTie2 (Y992) puncta, calculated using ImageJ software. (C) (i) Representative images of αSMA and pTie2 (Y992) in UT-CAF, TGF-CAF or with increasing doses of ANGPT2 (200 ng/ml, 400 ng/ml) in the presence of TGFβ. Arrowhead indicates pTie2 (Y992) puncta. (ii) Bar graph showing cell frequency with αSMA stress fiber-positive CAF and (iii) pTie2 (Y992) expression by CAF in given conditions. Scale bar = 20 µm. *P < 0.05, **P < 0.01, ***P < 0.001
Further, upon TGFβ-induction a significant increase in total-Tie2 protein and frequency of phosphorylated-Tie2 (Y992) puncta (Figure S3 C (i, ii)) were observed for tested CAF (Fig. 2B, i-v). Importantly, one hour pre-treatment with Tie2i before TGFβ induction as well as six hour of Tie2-inhibition after complete myofibroblastic differentiation by TGFβ (post-treatment), both conditions showed reduced number of Tie2-phosphorylated puncta. Since, ANGPT2 is a known to act as an antagonist of Tie2-receptor activation, we next used soluble ANGPT2 to inhibit Tie2 signaling. Very interestingly, similar to Tie2i, reduced frequency of myofibroblasts (Fig. 2 C, i-ii) and number of Tie2-phoshorylated puncta (Fig. 2 C-iii) was observed after ANGPT2 addition. Taken together, results provided novel insights, where CAF-specific Tie2 activity was responsible for induction and maintenance of TGFβ-induced myofibroblastic phenotype as well as transition to transcriptional state of C2-CAF.
Tie2-activity is regulated in an autocrine mannerTo strengthen the link between TGFβ and Tie2 in CAF, we next used pharmacological inhibitor of these regulators on a patient-derived C2-CAF (AP035), having constitutive-myofibroblastic phenotype (Fig. 3A). As anticipated, Galunisertib (TGFβi) or Tie2i independently led to reduction in frequency of constitutive phospho-Tie2 (Y992) positive puncta as well as myofibroblast frequency, as compared to control (Fig. 3B, i,ii); suggesting cell autonomous TGFβ receptor activation as cause for constitutive activation of Tie2 in C2-CAF. More interestingly, both Tie2- and TGFβ-inhibited C2-CAF showed significant downregulation of genes associated with C2-CAF (αSMA and SERPINE1) with concomitant upregulation of genes associated with C1-CAF (BMP4 and ANGPT2) (Fig. 3 C, i-iii); indicating a transition of C2-CAF, back to C1-CAF.
Fig. 3
Tie2-activity is regulated in an autocrine manner.(A) Representative images of constitutively active C2-CAF (AP035) detected for αSMA and pTie2 (Y992) protein. Increasing doses of Tie2 inhibitor and TGFβ inhibitor (Galunisertib; 1µM) were used to block respective receptor activity. Cells were quantified using ImageJ software. (B) (i) quantification of pTie2 (Y992) puncta and (ii) myofibroblasts frequency under these conditions. (C) qPCR analysis of (i) C2-CAF related genes (SERPINE1, αSMA), (ii) C1-CAF related genes (BMP4, EYA1, RUNX2, FOXF1), and (iii) ligand of Tie2 receptor (ANGPT1, ANGPT2) following Tie2 inhibitor and TGFβ inhibitor treatment in constitutively activated C2-CAF. Unstimulated CAF in same media was used as control. (D) (i) Representative images of C1-CAF (KV07) exposed to conditioned media from C1-CAF (KV07), C2-CAF (AP035), TGFβ inhibited C2-CAF (TGFβi > C2 CAF), Tie2 inhibited C2-CAF (Tie2i > C2 CAF), for 48 h, detected for αSMA and pTie2 (Y992) (ii) myofibroblasts frequency and (iii) pTie2 (Y992) puncta was quantified using ImageJ. Arrowhead indicates pTie2 (Y992) puncta. Scale bar = 20 µm *P < 0.05, **P < 0.01, ***P < 0.001
Since both TGFβ and Tie2 signaling are activated through receptor-ligand interactions, we explored if secreted factors from C2-CAF may act as drivers for acquiring and maintaining C2-CAF-like state. Conditioned media of KV07 (C1-CAF) and AP035 (C2-CAF) were collected and put over KV07 (C1-CAF) (Fig. 3D-i). Interestingly, conditioned media of C2-CAF was sufficient to increase both, myofibroblasts frequency (Fig. 3Di) and number of Phospho-Tie2 (Y992)-positive puncta in C1-CAF (Fig. 3Dii). This was significantly reduced when C1-CAF were exposed to conditioned media collected after TGFβ- or Tie2-inhibition in C2-CAF (Fig. 3Di, iii), suggesting the maintenance of Tie2 activity in C2-CAF through autocrine TGFβ signaling.
TGFβ-induced histone deacetylation drives transcriptional state change associated with C1- to C2-CAF transitionTo delve into the possible mechanisms, we performed TGFβ-induced gene expression analysis in a timeseries manner (Fig. 4A). Activation of TGFβ-signal increased expression of SERPINE1 at as early as 6 h which was maximum at 12 h. Expression of endogenous TGFβ and Tie2 genes also showed its peak levels by 12 h of TGFβ-induction. Interestingly, αSMA gene showed upregulation only after 48 h; suggesting that Tie2 upregulation preceded αSMA-upregulation during myofibroblastic differentiation by TGFβ. While genes associated with C2-CAF showed upregulation; we observed very sharp and sustained downregulation of C1-CAF specific genes BMP4 and ANGPT2, at as early as 6 h. Antagonist ANGPT2 was very significantly suppressed for entire test-period (96 h) of TGFβ induction, agonist ANGPT1 was significantly upregulated at later time points. Overall, these results indicated the presence of TGFβ-induced feed-forward loop of Tie2-activation by rapid suppression of ANGPT2 followed by upregulation of endogenous TGFβ, Tie2 and ANGPT1. Since, our results clearly showed that ANGPT2 was sufficient to block TGFβ-induced myofibroblastic differentiation (Fig. 2C); thus, rapid suppression of ANGPT2 may be one of the most crucial events in TGFβ-induced transition of C1-CAF into C2-CAF. Thus, we next performed chromatin immunoprecipitation to evaluate activation-marks using H3 K27-acetylation for ANGPT2 and BMP4 locus. Interestingly we observed reduced H3 K27-acetylation on TATA binding site (−1600 bp) and initiator site (−400 bp) of ANGPT2 promoter and the tested locus of BMP4 promoter (−708 bp) in TGF-CAF, compared to UT-CAF (Fig. 4B, i, ii); with concomitant increased binding of histone deacetylase 2 (HDAC2) and absence of acetyl transferase (p300) on the ANGPT2 and BMP4 initiator/promoter locus upon TGFβ-induction (Fig. 4B, iii, iv). Next, using three different C1-CAF, we tested the effect of TGFβ-induction in presence of potent histone deacetylase (HDAC) inhibitor, Valproic acid (VPA). Suppressive effect of TGFβ on all tested C1-CAF associated genes, BMP4, EYA1, FOXF1, RUNX2 and ANGPT2 were significantly much lower, in presence of VPA (Fig. 4C).
Fig. 4
TGFβ-induced histone deacetylation drives transcriptional state changes associated with transition of C1- to C2-CAF.(A) (i-vii) qPCR analysis of SERPINE1, αSMA, TGFꞵ, Tie2, BMP4, ANGPT2 and ANGPT1 in C1-CAF following 10 ng/ml TGFβ stimulation in time dependent manner as indicated. Relative abundance of mRNA was normalized with unstimulated CAF (Control) of respective time points. (B) Chromatin immunoprecipitation analysis of H3 K27-acetylation status on (i) ANGPT2 (TATA binding site −1600 bp; initiator site −400 bp) and (ii) BMP4 promoter (−708 bp) in C1-CAF; as well as (iii) HDAC2 and p300 on ANGPT2 initiated (−400 bp) and (iv) BMP4 promoter (−708 bp) locus with 10 ng/ml TGFβ (TGF-CAF). Unstimulated CAF (UT-CAF) were used as control. Data is representative on number of copies detected by ddPCR relative to ChIP DNA for Histone H3. (C) qPCR analysis showing expression of C1-CAF related genes, BMP4, EYA1, RUNX2, FOXF1 and ANGPT2 with or without valproic acid (3 mM, 5 mM) in presence of 10 ng/ml TGFβ. Unstimulated CAF were used as control. (D) Representative images of αSMA and pTie2 (Y992) in UT-CAF and TGF-CAF. ROCK and SRC inhibition was done 1 h before (ROCKi > > TGFCAF or Srci > > TGFCAF) TGFβ-induction. Bar graph showing quantification of myofibroblasts frequency and pTie2 (Y992) puncta, calculated using ImageJ software. (E) Western blot analysis of the expression of pSRC and SRC in UT-CAF, TGF-CAF and Tie2i > > TGF-CAF. (F) Schematic model of HDAC-mediated suppression of C1-CAF related genes. Scale bar = 20 µm. *P < 0.05, **P < 0.01, ***P < 0.001
In order to explore the possible mechanism of Tie2-signalling in mediating the TGFβ-induced myofibroblastic differentiation, we explored the known players in the process. As anticipated, inhibition of Src kinase activity by a potent inhibitor Dasatinib [43], or the ROCK activity by Y27632; both resulted in significant loss of stress fiber formation as well as Tie2-phophorylation, clearly demonstrating their regulatory role in TGFβ-induced Tie2-activity (Fig. 4D). Interestingly, Tie2-inhibition significantly reduced the phosphorylation of Src (Y418) (Fig. 4E), indicating the crucial role for Tie2 in TGFβ-induced Src-activation. Therefore, Tie2 may reciprocally activate Src, and may serve as novel mediator of TGFβ-induced stress fiber formation in myofibroblasts. Thus, overall as one of the possible mechanisms, the TGFβ-induced deacetylation of open chromatin on C1-CAF associated genes including ANGPT2, led to the activation of Tie2-Src-ROCK circuit during myofibroblastic differentiation and transition into C2-CAF (Fig. 4F).
Endogenous TGFβ is necessary and sufficient for driving Tie2-ANGPT signallingSince TGFβ-induced suppression of ANGPT2 was found important for Tie2-phosphorylation and myofibroblastic differentiation, we next explored if downregulating endogenous ANGPT2 may be sufficient for Tie2-phosphorylation in oral CAF. As such, ANGPT2 silencing in C1-CAF did not result in any significant change in pTie2 (Y992)-positive puncta (Fig. 5A); however, addition of ANGPT1 increased the number of phosphorylated-Tie2 puncta in ANGPT2-silenced C1-CAF (Fig. 5B-C). Thus, downregulation of ANGPT2 was necessary for ANGPT1 induced Tie2-phosphorylation in oral CAF. Since, TGFβ-induced CAF showed upregulation of endogenous-TGFβ, Tie2 and ANGPT1 along with suppression of ANGPT2, we next silenced increased levels of TGFβ, Tie2 or ANGPT1 in TGF-CAF. As anticipated, Tie2 and ANGPT1 silencing resulted in decreased pTie2 (Y992) levels and reduced frequency of myofibroblasts in TGF-CAF (Fig. 5D, 5E). Interestingly, even silencing of upregulated endogenous-TGFβ also suppressed Tie2-phosphotylation; supporting the role of endogenous-TGFβ in maintaining myofibroblast phenotype, as observed with the constitutive C2-CAF (Fig. 3). Silencing of respective genes was confirmed by qPCR (Fig. 5F). Importantly, reducing the levels of all three genes showed increased expression of ANGPT2 in TGF-CAF, suggesting it to be in an interconnected regulatory signaling loop (Fig. 5F).
Fig. 5
Endogenous-TGFβ is necessary and sufficient in driving Tie2-ANGPT signaling.(A) Representative images of ANGPT2 silenced C1-CAF with or without ANGPT1 stimulation (400 ng/ml) for 6 h, detected for pTie2 (Y992) protein. Scrambled siRNA was used as control. (B) qPCR analysis of ANGPT2 following ANGPT2 knockdown in C1 CAF. (C) Quantification of pTie2 (Y992) puncta using ImageJ. (D) Representative images of αSMA and pTie2 (Y992) protein detected by immunofluorescence staining, upon gene silencing of TGFβ, Tie2 and ANGPT1 in TGF-CAF. Scrambled siRNA was used as a control. (E) Myofibroblasts frequency and pTie2 (Y992) puncta was quantified using ImageJ. (F) qPCR analysis of TGFβ, Tie2, ANGPT1 and ANGPT2 followed by knockdown of TGFβ, Tie2 and ANGPT1 in TGF-CAF. (G) Schematic model suggesting experimental design of conditioned media (CM) collection from TGF-CAF following TGFβ, Tie2 and ANGPT1 gene knockdown. (H) Representative images showing myofibroblasts frequency in uninduced C1-CAF exposed to the CM collected from TGF-CAF after TGFβ, Tie2 or ANGPT1 gene-silencing. C1-CAF exposed to C1-CAF CM was used as control. Myofibroblasts frequency was quantified using ImageJ. Scale bar = 20 μm. *P < 0.05, **P < 0.01, ***P < 0.001
Since, there was an increase in ANGPT2 expression after silencing of induced levels of TGFβ, Tie2 or ANGPT1 in TGF-CAF, this prompted us to test if conditioned media (CM) from these experiments may show reduced myofibroblastic differentiation potency (Fig. 5G). As anticipated, conditioned media from control-siRNA transfected TGF-CAF was sufficient to significantly increase the myofibroblasts frequency in UT-CAF. However, UT-CAF, when exposed to CM collected from TGFβ, Tie2 or ANGPT1 siRNA transfected TGF-CAF showed significantly lower frequency of myofibroblasts (Fig. 5H). Collectively, these results led us to conclude that either extrinsic or endogenous-TGFβ in oral CAF led to the activation of Tie2-ANGPT signal; possibly as one of the most responsible factors for transitioning of C1-CAF to C2-CAF and acquiring myofibroblast phenotype.
C1-CAF or C2-CAF derived gene expression signatures showed concordance respectively with BMP4-High and ITGA3-High CAF, in situTo get deeper understanding about the intricate interplay between different CAF-phenotypes and their influence on oral cancer cells, we performed single cell RNA sequencing (scRNAseq) for co-cultures of oral cancer cells with C1-CAF (UT-CAF) or TGFβ-induced CAF (TGF-CAF) or TGFβ-induced-Tie2-inhibited (TGF > > Tie2i-CAF), separately (Figure S4 A, B (i,ii,iii)). Based on module scores of canonical markers of epithelial (KRT5, KRT14, KRT17) and CAF (FAP, THY1, PDGFRA, PDPN) related genes from gene-set [44], we identified CAF clusters from each of the co-culture conditions, having high-scores for CAF gene-set and low score for cytokeratin enriched epithelial gene set (Figure S5 A, Fig. 6 A). Unsupervised re-clustering of segregated 11,391 CAF from 3 different conditions (Fig. 6B) showed transcriptional divergence on UMAP projection acquiring three distinct transcriptional states. ‘Pseudotime analysis’ performed using ‘Monocle3’, demonstrated the origin of TGF-CAF from UT-CAF at significant scale and depth; whereas, TGF > > Tie2i-CAF displayed a retrogressive transcriptional behaviour to remain in middlemost part of trajectory indicating a reversal of TGF-CAF towards UT-CAF upon Tie2-inhibition (Fig. 6C (i, ii), S5B). Clusters belonging to UT-CAF such as 10,8,11,13 had a lower pseudotime value than that of clusters comprises of TGF-CAF and TGF > > Tie2i-CAF, depicting a continuous evolution of CAF phenotypes from UT CAF to TGF-CAF through TGF > > Tie2i-CAF (Figure S5B). Next, we performed pseudo-bulk analysis of scRNAseq data to evaluate the cell-state specific combined features; where individual UT-CAF (Red), TGF-CAF (Green) and TGF > > Tie2i-CAF (Blue) were computed for ‘AUCell scores’ for TGFβ- or Tie2-signaling associated gene-sets as signatures. Interestingly, it showed significantly higher score for both signature in TGF-CAF with significant downregulation in TGF > > Tie2i-CAF (Fig. 6D, S5 C-i,ii). This clearly supported the reversal of C2-CAF towards transcriptional state of C1-CAF, upon Tie2-inhibition, as observed from pseudotime analysis.
Fig. 6
TGFβ-induced myofibroblastic C2-CAF reprograms oral-cancer cells to acquire embryonic-like transcriptome state.(A) Feature plot showing expressions of epithelial and CAF marker modules on UMAP projection from three conditions of co-cultures as indicated. Circled clusters are annotated as CAF clusters with high CAF marker module scores and negativity for epithelial markers module scores. (B) UMAP plot shows re-clustering of CAF clusters from all the three conditions merged, revealing 13 clusters with a total of 11,391 cells. A split view of major clusters in a sample specific manner is provided on side panel. (C) (i) An UMAP plot visualizing sample wise grouped CAF clusters. (ii) Monocle3 pseudotime -time analysis showing CAF dynamic transition along the trajectory. (D) Violin plot showing enrichment of TGFβ and Tie2 signaling AUC scores generated by R tool ‘AUCell’, upon TGFβ treatment of CAF, which was significantly decreased followed by Tie2-inhibition. (E) AUC scoring of CAF from classified patient groups (High BMP4 (C1-like)/High ITGA3 (C2-like)) from Puram et al. and Quah et al. HNSCC datasets shows significant enrichment of C1-CAF DEGs in High BMP4 group, and C2-CAF DEGs and Tie2 signaling in High ITGA3 group. (F) Subset of 32,354 epithelial cells from all three conditions were merged and re-clustered, identified 16 clusters, projected on UMAP plot. (G) Pseudotime analysis exploring transition trajectory of cancer cells. (H) Bubble plot showing GO biological process analysis of gene-set among single cell and bulk RNA sequencing of cancer cells co cultured with TGF-CAF. Size of bubble represents numbers of associated genes and colour corresponds to given p value
To evaluate the presence of C1-type and C2-type CAF in patient derived samples, we investigated the single cell transcriptome datasets of treatment-naive HNSCC tumors from two independent earlier studies by Puram et. al. and Quah et. al. [44, 45]. Based on the consistent differential expression of BMP4 and ITGA3 in our current datasets and previously reported study from our group [15], we considered BMP4 and ITGA3 as markers for C1-type and C2-type CAF, respectively. Patients with higher than median expression score of BMP4 and concomitant lower than the median expression score for ITGA3 were classified as High-BMP4-CAF patients. Vice versa, individual patients with higher than the median expression score of ITGA3 and lower than the median expression score for BMP4 were classified as High-ITGA3-CAF patients (Supplementary Figure S6 A, B, C). Crucially, the AUCell scoring was performed for the classified patient groups using scRNAseq-DEGs between our UT-CAF and TGF-CAF (Adj. P value < 0.05) (Table S3). Validating the classification, CAF in high-BMP4-CAF patient group showed significantly higher score for upregulated UT-CAF-DEGs, whereas; CAF in high ITGA3-CAF patient group showed significantly higher score for upregulated TGF-CAF-DEGs (Fig. 6E), for both Puram et. al. and Quah et. al. studies. Furthermore, in both these studies, CAF in high-ITGA3 group patients showed significantly higher score for Tie2 signaling, aligning with our observation of Tie2 pathway enrichment in TGF-CAF or C2-CAF derived from patients (Fig. 6E).
CAF-specific Tie2 activity regulates cancer cell plasticity and stemness in oral cancer cellsPreviously we have reported that myofibroblastic C2-CAF drives stemness in oral cancer cells [15]. Therefore, TGFβ induced Tie2-signal in CAF might act as a potential target against C2-CAF driven cancer cell reprogramming. Thus, we next performed deeper investigation on the cancer cell reprogramming ability of Tie2-activity in C2-CAF by evaluating the transcriptome state of cancer cells using our co-culture derived scRNAseq data. A total of 32,354 epithelial cells were clustered together from all the conditions to broaden our knowledge on how different subtypes of CAF modulate cancer cell transcriptome (Fig. 6F). Re-clustering patterns of cancer cells revealed 3 major clusters with a total of 18 sub-clusters encompassing different transcriptional states (Figure S7 A-i,ii,iii) 6 F). While the one major subset of clusters (clusters 6,10–12,14) was common in all three conditions; surprisingly we observed other sets of cancer cells (clusters 0,1,4,5,8,13) shared majorly common clustering neighbourhood when co-cultured with UT-CAF or with TGF > > Tie2i-CAF, suggesting close similarity in their gene expression patterns. Interestingly, a very distinct subset of clusters (clusters 2,3,7,9,15–18) was comprised of cancer cells from TGF-CAF coculture (Table S4), depicting TGF-CAF induced transcriptional reprogramming of cancer cells, which was apparently absent when cancer cells were co-cultured with Tie2-inhibited TGF-CAF (Fig. 6F). Pseudotime analysis suggested a dynamics of cancer cell transition trajectory, highlighting that upon co-culture with TGF-CAF this subset of oral cancer cell acquired more evolved state on transition-axis with respect to clusters which were unchanged in any co-culture conditions (Fig. 6G, S7B). Further, relative position of cancer cells in co-culture with UT-CAF and with TGF > > Tie2i-CAF were almost indistinguishable in axis, implying that Tie2-inhibition in C2-CAF suppressed the cancer cells reprogramming ability of C2-CAF.
Emergence of this unique transcriptionally reprogrammed subset of cancer cells upon co-culture with TGF-CAF prompted us to further characterize their molecular nature. We overlapped the differentially upregulated genes in this unique subset of cancer cells (clusters 2,3,7,9,15–18) with genes which were differentially upregulated in cancer cells co-cultured with TGF-CAF in comparison to UT-CAF from our bulk-RNAseq data (Fig. 1). 150 DEGs were identified as common among both lists; majorly harboured biological process of early developmental processes, indicating an embryonic-like reprogramming of cancer cells by TGF-CAF (Fig. 6H, S7 C, Table S5, S6). Taken together, our data clearly suggested that TGFβ induced myofibroblastic C2-CAF, reprograms oral-cancer cells to acquire an undifferentiated phenotype which may have more aggressive functions.
Our bulk-RNAseq analysis revealed a total of 1843 and 1568 genes upregulated and down-regulated respectively in cancer cells co-cultured with TGF-CAF compared to UT-CAF (Table S7). GSEA analysis identified enrichment of signatures for stem cell, EMT, cytokine-cytokine interaction and downregulation of cell-cycle in cancer cells co-cultured with TGF-CAF group (Fig. 7A). In support of obtained downregulation of cell cycle marker gene-set; frequency of Ki67-positive cells was found to be reduced in cancer cells co-cultured with TGF-CAF, as compared to UT-CAF (S8 A-i, ii). Previous data from our lab has demonstrated an increased frequency of ALDHHigh stem-like cancer cells (SLCCs) in co-culture with C2-type CAF [15]. Similarly, significantly higher frequency of ALDHHigh phenotype was observed when oral cancer cells were exposed to TGF-CAF CM (Fig. 7B, S8B). Recently we have revealed plasticity in oral cancer cells having ALDHHigh and ALDHLow phenotype [46]. This instigated us to sort ALDHLow cells and coculture with UT-CAF and TGF-CAF for four days. Results clearly suggested that TGF-CAF can significantly favour the shift of ALDHLow cells into ALDHHigh cells (Fig. 7B, S8 C). Further, gene expression of cancer cells showed upregulation of stemness associated genes NANOG, OCT4, CK14 and CD44 in two different cancer cell lines exposed to CM of TGF-CAF compared to that of UT-CAF (Fig. 7C); suggesting the possibility of induction of stemness in cancer cells by TGF-CAF.
Fig. 7
CAF-specific Tie2 regulates cancer cell plasticity and stemness in oral cancer cells.(A) Gene set enrichment analysis (GSEA) from transcriptome data of cancer cells, co-cultured with UT-CAF or TGF-CAF for four days. Datasets were obtained from MsigDB database. (B) Bar graph showing conversion of ALDH-Low cells into ALDH-High cells upon exposing to conditioned media of UT-CAF or TGF-CAF or upon co-culture as indicated. (C) qPCR analysis of stemness associated genes (OCT4, NANOG, CD44 and KRT14 (CK14) in two different oral cancer cell lines (SCC070 and SCC032) exposed to CM from KV07 or KV018 CAF, respectively. (D) (i) Representative image of 3D-spheroids of SCC070 cell line exposed to CM from TGFβ > > siTie2 or TGFβ > > siControl, followed by testing in spheroid formation assay. (ii) Dot plot showing diameter of formed spheroids of cancer cells from these conditions and bar graph showing sphere forming efficiency of cancer cells exposed to both these conditions. Sphere size was quantified using ImageJ. Spheres of < 60 µm diameter were excluded from study. (iii). qPCR analysis of stemness associated genes (ALDH1 A1, OCT4, NANOG, CD44 and KRT14/CK14) in cancer cells following exposed to CM from TGFβ > > siControl or TGFβ > > siTie2 in monolayer culture for 48 h. (E) Representative images of zebrafish xenografts taken using confocal microscope. GFP positive oral cancer cells (SCC070) were exposed to conditioned media of UT-CAF, TGF-CAF or TGF > > Tie2i-CAF for 48 h. Cells were harvested and 100 cells were inoculated into yolk sac of each zebrafish embryo (2-day post fertilization). GFP-positive cell colonies were visible on 4 th day of inoculation. (F) Kaplan Meier survival plots showing a probability of deaths in zebrafish embryos due to increased tumor burden. (G) (i) Representative phase contrast images of MOC2 cells cultured with conditioned media of UT-CAF, TGF-CAF and TGF > > Tie2i CAF for 48 h in monolayer culture (2D) and representative images of 3D spheroids of MOC2 cells exposed to CAF-CM from all three conditions as mentioned. (ii) Tree plot showing sphere forming efficiency of MOC2 cells exposed to conditioned media of UT-CAF, TGF-CAF and TGF > > Tie2i CAF. Spheres of < 60µ diameter were excluded from study. (iii) MOC2 cells cultured in conditioned media of UT-CAF, TGF-CAF and TGF > > Tie2i CAF for 48 h in monolayer culture. These CM exposed MOC2 cells (3 × 10⁵ cells/mice) were subcutaneously inoculated into syngeneic C57BL/6 mouse models and monitored for 10 days. On day 10 th of transplantation, mice were sacrificed and tumors were harvested. Volume of these tumors were measured using ImageJ and plotted in GraphPad prism. **P < 0.05, **P < 0.01, ***P < 0.001. Scale bars, 275 µm
So far, transcriptome data suggested an ability of TGF-CAF in educating cancer cells to acquire more aggressive transcription state which was significantly suppressed after inhibition of Tie2 activity in CAF. Therefore, this possibility was next evaluated against stemness in cancer cells by targeting Tie2 expression and activity in TGF-CAF. Oral cancer cell (SCC070) exposed to CM collected from TGF-CAF transfected with Tie2-siRNA (TGF > > siTie2-CAF) showed significant downregulation of tested stemness related genes NANOG, OCT4, ALDH1 A1, CK14 and CD44 (Fig. 7D) as well as spheroid forming efficiency, as compared to CM collected from CAF transfected with control-siRNA (TGF > > siControl-CAF) (Fig. 7D, i-ii). Similar results were obtained with sphere forming efficiency of two different oral cancer cell lines. This was significantly increased when exposed to conditioned media of TGF-CAF compared to control (UT-CAF); whereas it was suppressed when exposed to CM from TGF > > Tie2i-CAF in both the tested cell lines (Figure S9 Ai-ii, S9B) without showing any effect of growth properties of cells growing in adherent condition with serum. Suggesting the reduced 3D-spheroids growth to be an indicator of affected stemness in cancer cells (Figure S9 C). Together, our scRNAseq data analysis and cellular functional assays strongly supported the notion that TGF-CAF-expressed Tie2 may play one of the most crucial role in driving cellular plasticity and maintaining higher stemness in oral cancer cells.
We next evaluated the impact of CAF-induced cancer cell reprogramming on tumor forming ability of oral cancer cells. First, GFP expressing SCC070 oral cancer cell line was exposed to CM obtained from UT-CAF, TGF-CAF or TGF > > Tie2i-CAF for 48 h. Cells were harvested and 100 cells were injected into yolk sac of each 2 dpf (two days post fertilization) embryo. Cancer cell foci formation was monitored under fluorescent microscope for up to seven days and mortality was recorded. Confocal images were taken after 4 days post injection of cancer cells. Interestingly, similar to the results obtained with sphere formation; SCC070 cells incubated with CM of TGF-CAF showed maximum tumor foci formation and also highest mortality of embryos (Fig. 7E, F). Interestingly, embryos injected with SCC070 exposed to CM of UT-CAF and TGFβ > > Tie2i-CAF did not show significant cancer cell foci formation within the tested time period (Fig. 7E). Importantly, we observed better survival of embryos injected with cancer cells which were exposed to CM of TGFβ > > Tie2i-CAF (Fig. 7F). Encouraged from these observations, we next aimed to perform tumor formation assay using murine syngeneic mouse model of oral cancer. Towards this, we first tested if human-CAF-derived CM may exert similar effect on C57BL/6 mouse oral cancer derived cell line, MOC2. Very interestingly, similar to human oral cancer cell lines, sphere forming efficiency of MOC2 cells was significantly increased when exposed to conditioned media of TGF-CAF compared to control and suppressed when exposed to CM from TGF > > Tie2i-CAF (Fig. 7G, i-ii); without showing any effect on growth of adherent cell culture with serum (Fig.
Comments (0)