
Remember me
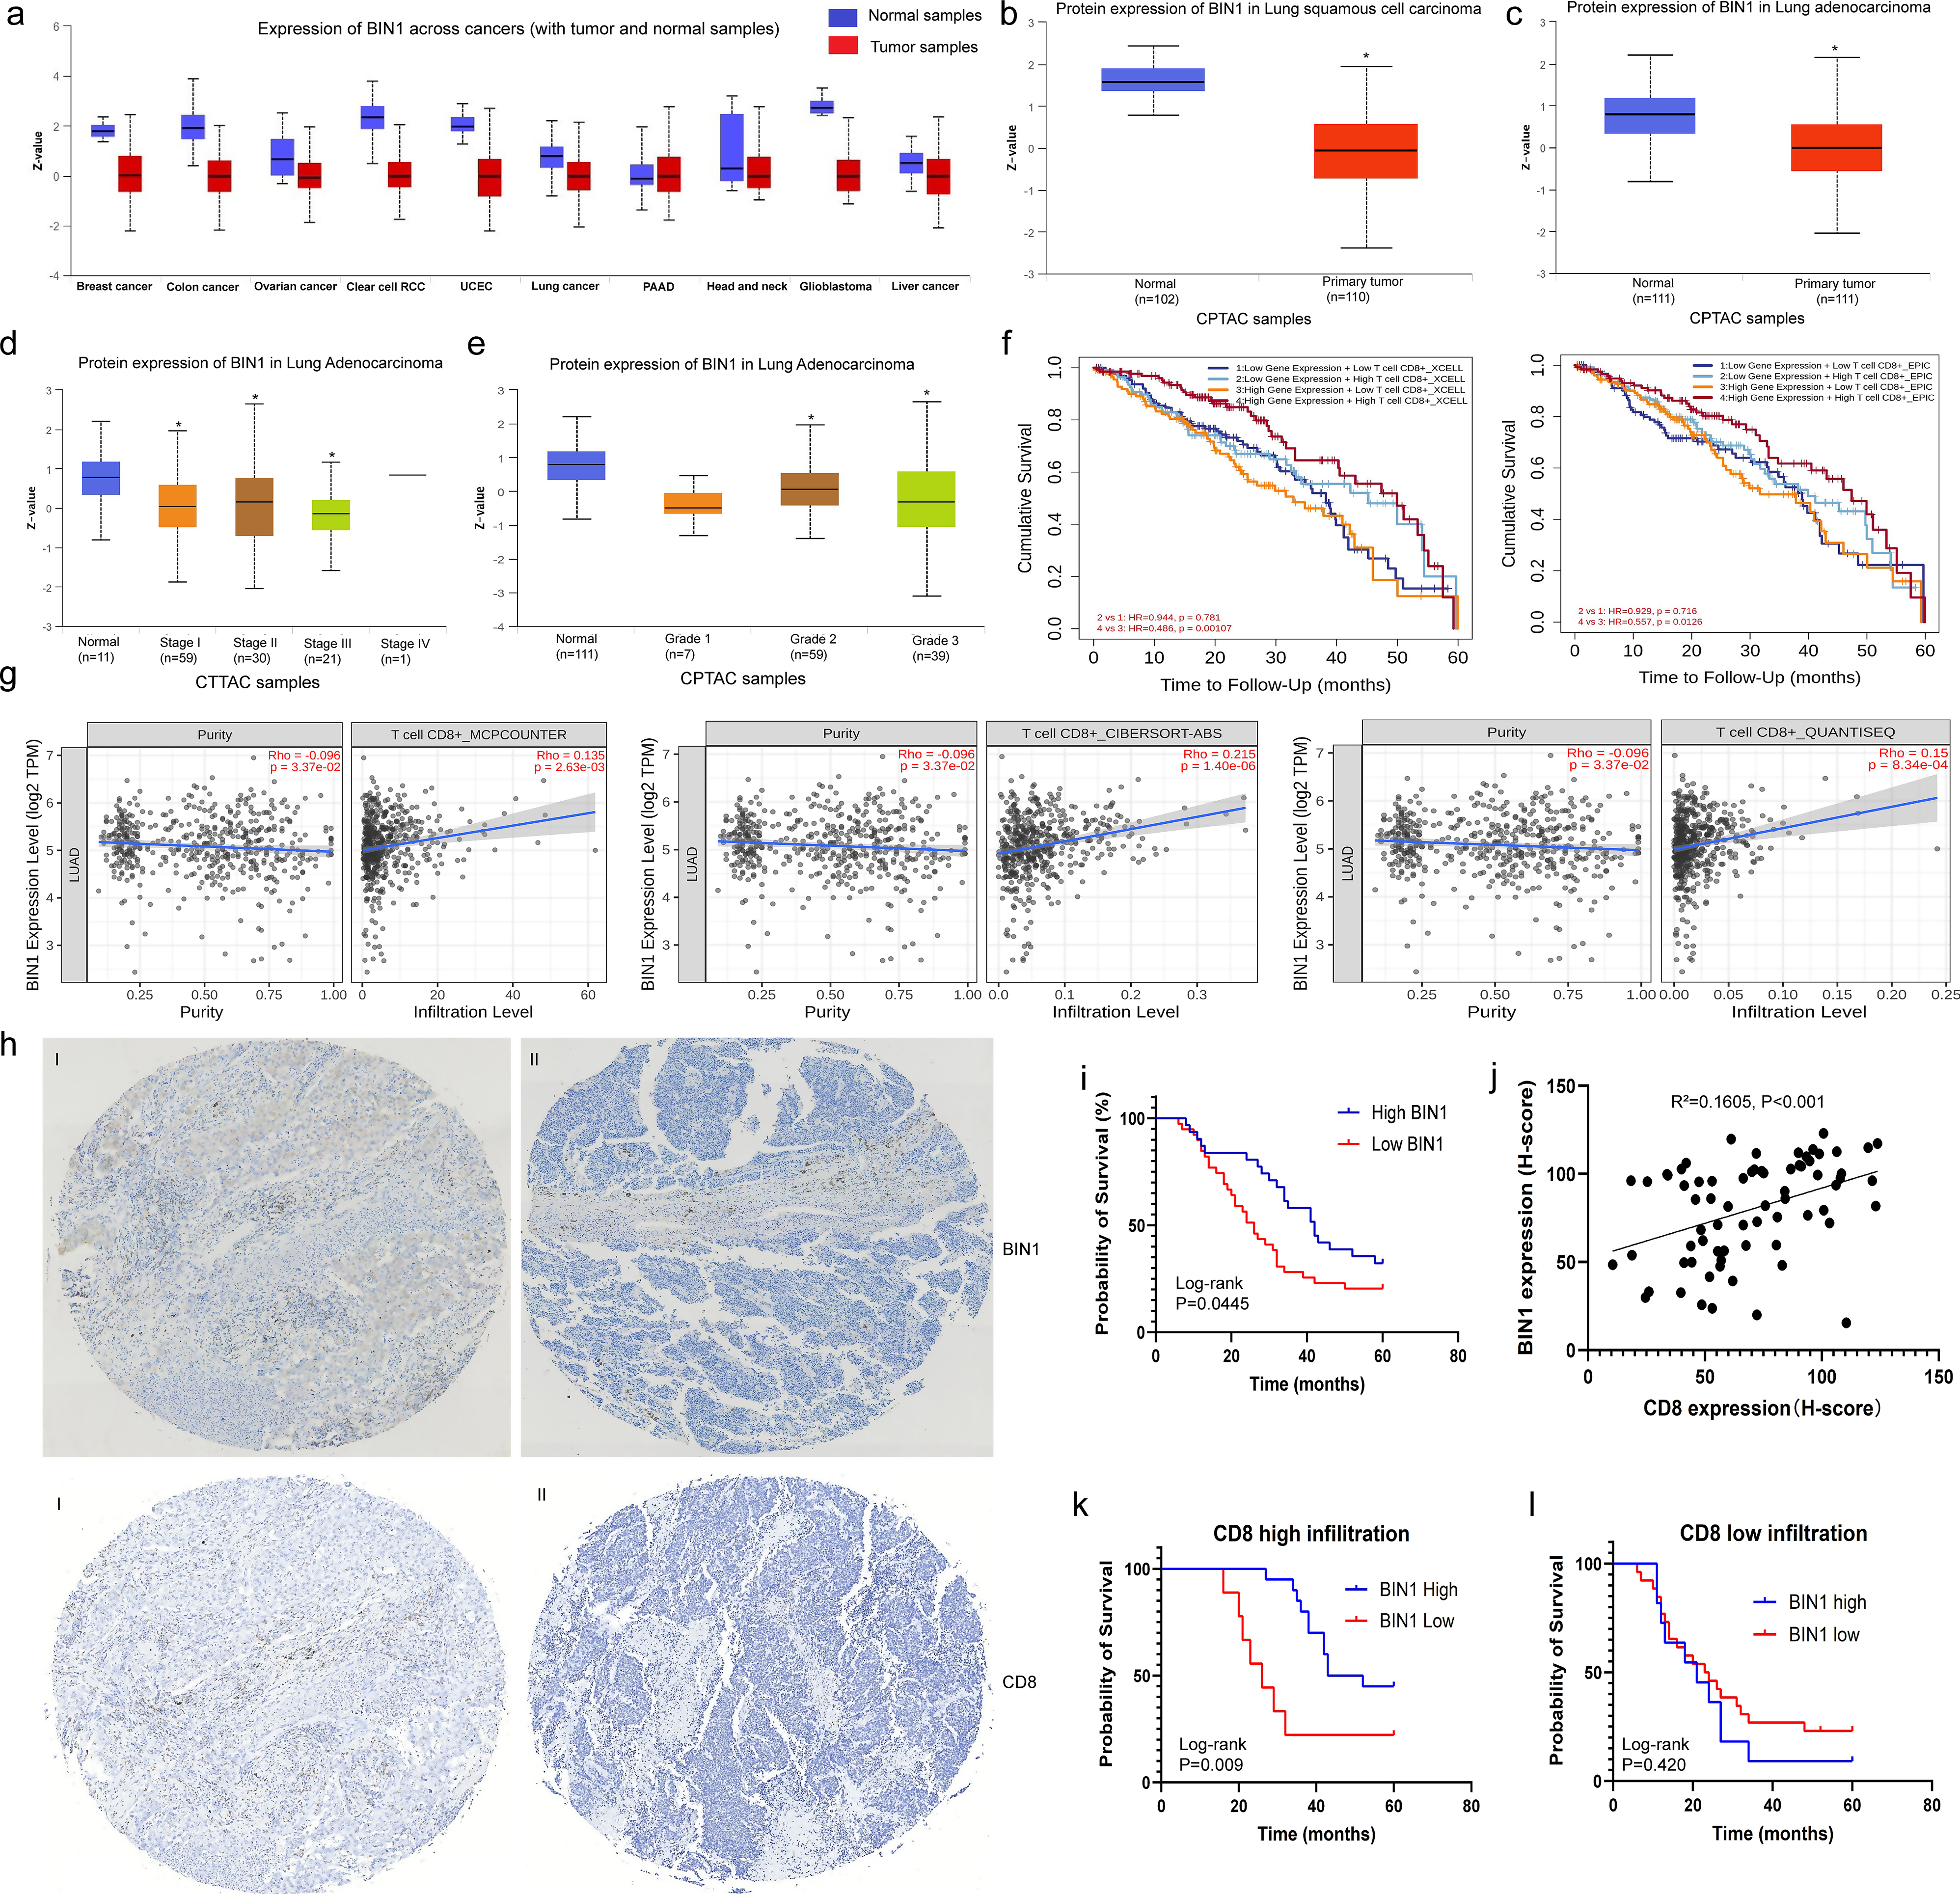


We analyzed the protein expression levels of BIN1 across various cancers using the CPTAC dataset. BIN1 was found to be downregulated in breast cancer, colon cancer, ovarian cancer, clear cell renal cell carcinoma (RCC), uterine corpus endometrial carcinoma (UCEC), lung cancer, glioblastoma, and liver cancer, suggesting its potential role as a key regulator in cancer progression (Fig. 1a). Additionally, further analysis of the CPTAC database revealed significantly reduced BIN1 expression levels in both lung adenocarcinoma (LUAD) and lung squamous cell carcinoma (LUSC) (Fig. 1b and c). Moreover, lower BIN1 expression was strongly associated with advanced clinical stages and higher histologic grades, as evidenced in the CPTAC database based on TCGA data (Fig. 1d and e) (Supplementary Fig. 1a-c). These findings indicate that reduced BIN1 expression is closely linked to advanced progression in NSCLC.
Fig. 1
BIN1 Attenuation Predicts Advanced Progression and Poor Prognosis in NSCLC a: Protein expression levels of BIN1 across various cancers, as analyzed using the CPTAC dataset. b: Protein expression levels of BIN1 in LUSC. c: Protein expression levels of BIN1 in LUAD. d-e: The relationship between BIN1 expression levels and both clinical stages and histological differentiation degrees. f: The correlation between BIN1 expression and overall survival (OS) in NSCLC patients. g: The combined impact of BIN1 and CD8 co-expression on the prognosis of NSCLC patients. h: Tissue microarray analysis of BIN1 and CD8 expression levels in NSCLC samples (I: BIN1 high expression. II: BIN1 low expression. Scale bar = 10 μm). i: Kaplan-Meier analysis illustrating the association between BIN1 expression and the prognosis of NSCLC patients. j: Spearman correlation analysis was conducted to explore the relationship between BIN1 and CD8+ T cell infiltration in NSCLC. k-l: Kaplan-Meier survival analysis was used to observe the correlation between the expression level of BIN1 and the prognosis of NSCLC patients under different CD8+ T cell infiltration states
To elucidate the clinical significance of BIN1 in lung cancer, we analyzed the correlation between BIN1 expression levels and the prognosis of lung cancer patients using the StarBase2.0 and TIMER2.0 databases, both derived from TCGA data. The results indicated that BIN1 expression levels were not significantly associated with the overall survival (OS) of LUAD patients (Fig. 1f, Supplementary Fig. 1d). However, a noteworthy finding from the TIMER2.0 database revealed that NSCLC patients exhibiting both high BIN1 and high CD8 expression demonstrated significantly improved OS compared to those with high BIN1 but low CD8 expression (Fig. 1f). Further analysis was conducted to investigate the relationship between BIN1 expression and CD8+ T cell infiltration using Spearman correlations within the TIMER2.0 database. Additionally, results from CIBERSORT, MCP-counter, and QUANTISEQ analyses consistently showed that BIN1 was positively correlated with CD8+ T cell infiltration levels (Fig. 1g). Taken together, these findings suggest that the regulatory role of BIN1 in NSCLC is intricately linked to CD8+ T cell infiltration.
A tissue microarray consistently revealed a significant decrease in BIN1 expression within NSCLC tissues (Fig. 1h, Supplementary 1e). Furthermore, low BIN1 expression was strongly associated with lymph node metastasis and more advanced clinical stages (Table 1). Kaplan-Meier survival analysis further demonstrated that NSCLC patients with diminished BIN1 expression experienced shorter overall survival (OS) times (Fig. 1i). To further investigate the association between BIN1 expression status and CD8+ T cell infiltration, we evaluated CD8 expression in NSCLC tissues using immunohistochemistry. Spearman correlation analysis revealed a significant positive correlation between BIN1 expression and CD8+ T cell infiltration (R2 = 0.1605, P < 0.001) (Fig. 1j). Additionally, we investigated the association between BIN1 expression and patient prognosis across different stages and varying CD8+ T cell infiltration statuses. Kaplan-Meier analysis showed that in stage I/II lung cancer, high BIN1 expression correlated with improved survival compared to low expression (Supplementary Fig. 1g). In stage III, BIN1 expression was not significantly associated with prognosis (Supplementary Fig. 1h). Furthermore, in cases with CD8+ T cell infiltration, high BIN1 expression was linked to better prognosis. Conversely, in low CD8+ T cell infiltration cases, BIN1 expression did not significantly affect prognosis (Fig. 1k and l). These results suggest that low BIN1 expression is significantly associated with poor prognosis and reduced CD8+ T cell infiltration in NSCLC patients.
Table 1 The relationship between BIN1 expression and clinicopathologic features in lung cancerKnockout of BIN1 inhibits the expression of immune-related genes and the activation of immune-related pathwaysWe utilized CRISPR-Cas9 technology in the murine NSCLC line LLC to generate clonal variants with BIN1 loss-of-function mutations (Supplementary Fig. 2a-d), referred to hereafter as LLC-BIN1KO. EdU incorporation, wound healing, Transwell migration, and invasion assays demonstrated that BIN1 knockout markedly enhanced the proliferation, migration, and invasion of LLC cells (Supplementary Fig. 2e-h). Moreover, BIN1 knockout significantly reduced the apoptosis rate of LLC cells, as indicated by additional analysis (Supplementary Fig. 2i).
Furthermore, to investigate the biological function of BIN1 in vivo, we injected LLC-BIN1WT and LLC-BIN1KO cells into nude mice (n = 5 mice/group) to establish subcutaneous mouse models. The growth rate and average tumor weights derived from LLC-BIN1KO group cells were significantly faster and heavier than those of the control (Fig. 2a-c). Previous studies have demonstrated that BIN1 is closely associated with CD8+ T cell infiltration. Therefore, we utilized immunocompetent C57 mice to investigate the in vivo regulatory role of BIN1 (n = 5 mice/group). The results revealed that the tumor growth rate and tumor weight in the BIN1 knockout group were significantly higher compared to those in the control group (Fig. 2d-f). Meanwhile, IHC staining for Ki-67, a proliferation marker, was significantly increased in orthotopic tumors of the LLC-BIN1KO group (Fig. 2g). In summary, our findings demonstrate that BIN1 loss-of-function mutations enhance LLC cell proliferation, migration, and invasion, while also promoting tumor growth and reducing apoptosis, both in vitro and in vivo.
Fig. 2
BIN1 Knockout Suppresses the Expression of Immune-Related Genes and Inhibits the Activation of Immune-Related Pathways a-c: The impact of BIN1 knockout on tumorigenicity in nude mice. d-f: The impact of BIN1 knockout on tumorigenicity in C57BL/6 mice. g: Immunohistochemical analysis of Ki67 expression in tumor tissues from C57BL/6 mice across different groups. h: Heatmap illustrating differentially expressed genes between BIN1 knockout and control LLC cells. i: GO enrichment analysis of differentially expressed genes between BIN1 knockout and control LLC cells. j: KEGG pathway analysis of differentially expressed genes between BIN1 knockout and control LLC cells. k: Heatmap depicting differentially expressed genes between BIN1 knockout and control tumors. l: GO enrichment analysis of differentially expressed genes between BIN1 knockout and control tumors. m: KEGG pathway analysis of differentially expressed genes between BIN1 knockout and control tumors
To elucidate the genome-wide expression patterns regulated by BIN1, we conducted RNA-seq analysis in paired LLC-BIN1KO and LLC-BIN1WT C57BL/6 allograft tumors in vivo and LLC-BIN1KO and LLC-BIN1WT cells in vitro. Kyoto Encyclopedia of Genes and Genomes (KEGG) and Gene Ontology (GO) analyses revealed that gene sets involved in immune response regulation, cytokine production, interferon-γ (IFN-γ) response, and antigen processing and presentation were significantly downregulated in both LLC-BIN1KO tumors and LLC-BIN1KO cells (Fig. 2h-m). The IFN-γ pathway plays a critical role in the tumor’s response to immunotherapy. In LLC-BIN1KO tumors and LLC-BIN1KO cells, the key transcription factor STAT1 in the IFN-γ pathway was markedly downregulated (Fig. 2h and k). Additionally, BIN1 inactivation led to decreased expression of IFN-γ and its induced chemokine genes CXCL10 and CCL5 both in vitro (Fig. 2h) and in vivo (Fig. 2k). The STAT1-IFNγ regulatory axis has been reported to enhance anti-tumor immunity by recruiting CXCR3+CD8+ T cells and CXCR3+ NK cells [22]. Collectively, these findings suggest that BIN1 knockout leads to decreased STAT1 expression, consequently suppressing the IFN-γ pathway, downregulating immune-related gene expression, and impairing the activation of immune-related pathways.
Deletion of BIN1 inhibits CD8+ T cell infiltration and impairs their cytotoxic function in the NSCLC TMETo further evaluate whether host BIN1 influenced the TME, we analyzed tumor-infiltrating immune cells in detail. Mass cytometry revealed a significant increase in CD8+ T cells within the draining lymph nodes of LLC-BIN1KO mice compared to LLC-BIN1WT mice (Fig. 3a; Supplementary 3a, b). Subsequently, multi-color flow cytometry was performed to assess immune cell infiltration in tumor tissues across each group of mice. In the TME of LLC-BIN1KO mice, we observed a substantial decrease in CD8+ T cells and a concurrent increase in CD8+TIM3+PD-1+ T cells, relative to LLC-BIN1WT mice (Fig. 3b, c). Other immune cell populations—such as CD4+ T cells, CD8+ T cells, M-MDSCs, macrophages, monocytes, neutrophils, and NK cells—showed minimal differences in the spleen, draining lymph nodes, and tumors (Fig. 3d, e; Supplementary 3a-g). Furthermore, immunohistochemical staining for CD8 on LLC tumor tissues from LLC-BIN1KO mice verified a reduced presence of CD8+ T cells (Fig. 3f).
Fig. 3
Deletion of BIN1 Inhibits CD8+ T Cell Infiltration and Impairs Their Cytotoxic Function in the NSCLC TME a: Flow cytometry mass spectrometry analysis was conducted on tumor-draining lymph nodes from BIN1-KO and BIN1-WT mice (1: CD8+ T. 2–3: CD4+ T. 4, 5, 6, 11, 13, 16, 17, 18, 19, 20: B cell. 7: MDSC. 8: Neutrophils. 9, 12, 14, 15: T cell. 10: DC). b: The proportion of CD8+ T cells in tumor tissues was analyzed across each group of mice using flow cytometry. c: Flow cytometry detected the proportion of exhausted CD8+ T cells in the tumor tissues of each group of mice. d: The proportion of CD4+ T cells in tumor tissues from each group of mice was assessed via flow cytometry. e: Flow cytometry identified the proportion of CD4+ CD8+ T cells in the tumor tissues of each group of mice. f: Tissue immunofluorescence was used to evaluate the infiltration level of CD8+ T cells in the tumor tissues from each group of mice. g: The effect of BIN1 knockout on CXCL10, CCL5 and IFN-γ expression in mouse tumor tissues were determined. h: Flow cytometry was employed to assess the alterations in cytotoxic factors within CD8+ T cells following co-culture with LLC-BIN1WT and LLC-BIN1KO cells. i: Flow cytometry was employed to assess the cytotoxic activity of CD8+ T cells co-cultured with LLC-BIN1WT and LLC-BIN1KO cells against LLC cells
To further explore the effect of BIN1 on the TME in NSCLC, RNA sequencing analysis was conducted on tumor tissues from both BIN1-KO and BIN1-WT mice. The results demonstrated a significant reduction in the expression levels of CD8 surface markers CD8a and CD28 in the BIN1-KO group. Additionally, the expression of GZMB, a cytotoxic molecule crucial for CD8+ T cell functionality, was markedly reduced (Fig. 2k). These findings highlight the suppressed antitumor activity of CD8+ T cells within the TME of LLC-BIN1KO mice.
RNA-seq analysis of LLC cells with BIN1 knockout compared to the control group revealed a significant reduction in the expression levels of STAT1, IFN-γ, CXCL10, and CCL5, which are key factors involved in CD8+ T cell chemotaxis (Fig. 2h, k). To validate these findings, we measured the expression levels of IFN-γ, CXCL10, and CCL5 in LLC-BIN1KO and LLC-BIN1WT mice using ELISA. The results confirmed that the BIN1 knockout group exhibited markedly lower levels of IFN-γ, CXCL10, and CCL5 compared to the control group (Fig. 3g).
To investigate the effect of BIN1 knockout in tumor cells on CD8+ T cell function, LLC-BIN1WT and LLC-BIN1KO cells were co-cultured with CD8+ T cells. After 6 days, flow cytometry was employed to evaluate the expression levels of cytotoxic factors (IFN-γ, TNF-α, and GZMB) in CD8+ T cells from each co-culture system. The results demonstrated that the expression levels of IFN-γ, TNF-α, and GZMB were significantly reduced in CD8+ T cells co-cultured with LLC-BIN1KO compared to those co-cultured with LLC-BIN1WT (Fig. 3h). Furthermore, CD8+ T cells isolated from each co-culture system were re-co-cultured with LLC cells, and the apoptosis rate of LLC cells was assessed by flow cytometry. The findings revealed that CD8+ T cells co-cultured with LLC-BIN1KO exhibited decreased cytotoxic activity against LLC cells compared to those co-cultured with LLC-BIN1WT (Fig. 3i). These observations led to the hypothesis that BIN1 deficiency facilitates tumor progression by modifying the TME, thereby impairing the antitumor response.
BIN1 modulates STAT1 stabilization by competitively binding to G3BP1To investigate the role of BIN1 in regulating CD8+ T cell infiltration, we conducted immunoprecipitation-mass spectrometry to identify its interacting partners (Fig. 4a). GO analysis of the differentially expressed proteins between the IgG group and the IP group revealed that the potential binding partners of BIN1 were associated with GTPase binding, GTPase activity, and GTP binding (Fig. 4b). Among these, we focused on Ras-GTPase-activating protein-binding protein 1 (G3BP1). To determine whether BIN1 binds to G3BP1, we first performed molecular docking experiments to assess their binding potential and identify the binding sites between BIN1 and G3BP1 (Fig. 4c). The docking analysis produced a score of -298.51, suggesting a strong interaction between BIN1 and G3BP1. Further investigation revealed that their interaction is primarily facilitated by hydrogen bonds and salt bridges (Fig. 4d). G3BP1, a stress granule (SG) assembly factor, has been implicated in SG formation and cancer progression [23], making it a key protein of interest. For further validation, Co-IP assays were performed and confirmed that endogenous BIN1 interacts with G3BP1 in LLC cells (Fig. 4e and f). Additionally, database analyses showed that G3BP1 expression is significantly upregulated in NSCLC tissues and correlated with advanced clinical stages. However, no significant association was observed between G3BP1 expression and the prognosis of NSCLC patients (Supplementary Fig. 4b, d and f). These findings highlight the importance of the BIN1-G3BP1 interaction and its potential implications in cancer progression.
Fig. 4
BIN1 Modulates STAT1 Stabilization by Competitively Binding to G3BP1 a: Immunoprecipitation-mass spectrometry analysis identifying the interacting partners of BIN1. b: GO analysis of differentially expressed proteins in the IgG and IP groups. c: Molecular docking experiments assessing the binding potential and identifying the interaction sites between BIN1 and G3BP1. d: Identification of the binding sites between BIN1 and G3BP1. e-f: Co-IP confirming the interaction between BIN1 and G3BP1. g: Analysis of the regulatory effect of BIN1 knockout on the transcriptional level of G3BP1. h: Analysis of the regulatory effect of BIN1 knockout on the protein level of G3BP1. i: Immunofluorescence assay detecting the effects of BIN1 knockout on G3BP1. j-k: Investigation of G3BP1 protein stability in the presence of BIN1 following CHX intervention. l: Immunofluorescence assay examining the co-localization of BIN1 and G3BP1. m: Co-IP validation of the interaction between STAT1 and G3BP1 in BIN1 wild-type (WT) cells. n: Co-IP validation of the interaction between STAT1 and G3BP1 in BIN1 knockout (KO) cells. o-p: Western blot analysis determining the effect of G3BP1 knockdown on STAT1 expression. q: BIN1 influences STAT1 expression through G3BP1
We next investigated whether BIN1 influences the expression of G3BP1. Western blotting and immunofluorescence (IF) demonstrated that G3BP1 protein expression was significantly upregulated upon BIN1 knockout (Fig. 4h and i). However, no regulatory effect was observed at the transcriptional level (Fig. 4g). Moreover, BIN1 knockout was found to preserve G3BP1 stability in the presence of the protein synthesis inhibitor cycloheximide (CHX) (Fig. 4j and k). This interaction was further validated by the colocalization of BIN1 and G3BP1 in the cytoplasm, as shown through IF staining (Fig. 4l). These findings indicate that BIN1 knockout markedly enhances the stability of the G3BP1 protein.
To further investigate the potential mechanism through which BIN1/G3BP1 influences the TME, we systematically analyzed the potential binding proteins of G3BP1 using databases BioGRID and IntAct, and further investigated the interaction between G3BP1 and STAT1 through molecular docking experiments, the docking score was − 246.23 (Supplementary Fig. 4a). To confirm this interaction, we conducted Co-IP experiments, which demonstrated that G3BP1 indeed binds to STAT1 (Fig. 4m). Interestingly, we observed that the binding affinity between G3BP1 and STAT1 was significantly enhanced in BIN1-knockout LLC cells (Fig. 4n). Western blot analysis demonstrated that G3BP1 knockdown significantly upregulated STAT1 expression (Fig. 4o and p). Additionally, Western blot results demonstrated that BIN1 knockout inhibited STAT1 expression, an effect that was antagonized by G3BP1 knockdown (Fig. 4q). The above results indicate that BIN1 knockout enhances the interaction between G3BP1 and STAT1 by stabilizing G3BP1.
To verify the clinical significance of STAT1 in NSCLC, we analyzed publicly available databases and found that STAT1 expression was significantly downregulated in NSCLC. However, the expression level of STAT1 was not significantly correlated with either the clinical stage or prognosis in NSCLC patients (Supplementary Fig. 4c, e and g). Collectively, these findings suggest that BIN1 regulates STAT1 expression by competing with G3BP1 for binding interactions.
BIN1 knockout inhibits CD8+T cell infiltration by inactivating the STAT1 signaling pathwayTo investigate whether BIN1 influences CD8+ T cell infiltration through the STAT1 signaling pathway, subcutaneous tumor models were established using LLC cells in BIN1-KO and BIN1-WT groups. The STAT1 agonist SB02024 was administered intraperitoneally when tumor volumes reached 100 mm³. The results showed that SB02024 significantly inhibited the tumorigenic potential of LLC cells and counteracted the pro-tumorigenic effects of BIN1 knockout (Fig. 5a–c). ELISA analyses revealed that CXCL10 and CCL5 expression levels in tumor tissues were significantly lower in BIN1-KO mice compared to BIN1-WT mice (Fig. 5d, e). Furthermore, treatment of BIN1-KO mice with SB02024 markedly upregulated CXCL10 and CCL5 expression levels relative to untreated BIN1-KO mice (Fig. 5d, e). These findings indicate that BIN1 regulates the expression of the chemokines CXCL10 and CCL5 via the STAT1 signaling pathway. In addition, we evaluated the regulatory effects of the STAT1 agonist SB02024 on the immune microenvironment of NSCLC using multi-color flow cytometry. Compared to the BIN1-WT group, the proportion of CD8+ T cell infiltration in tumor tissues was increased in the BIN1-WT + SB02024 group, while the proportion of CD8+PD-1+TIM3+ T cell infiltration was reduced (Fig. 5f, g). Similarly, in the BIN1-KO group, SB02024 treatment elevated the proportion of CD8+ T cell infiltration and decreased the proportion of CD8+PD-1+TIM3+ T cell infiltration compared to untreated BIN1-KO mice (Fig. 5f, g). Tissue fluorescence staining further demonstrated that SB02024 increased the infiltration of CD8+ T cells in the TME and partially reversed the inhibition of CD8+ T cell infiltration caused by BIN1 knockout (Fig. 5h). IHC) analysis revealed that SB02024 significantly reduced Ki67-positive rates in tumor tissues. Specifically, the positive rate of Ki67 expression in the BIN1-WT + SB02024 group was markedly lower than in the BIN1-WT group. Similarly, the BIN1-KO + SB02024 group exhibited a significantly reduced Ki67-positive rate compared to the BIN1-KO group (Fig. 5i). In a word, these findings suggest that the STAT1 agonist SB02024 can reverse the immunosuppressive microenvironment induced by BIN1 knockout and enhance anti-tumor immune responses.
Fig. 5
BIN1 Knockout Inhibits CD8+ T Cell Infiltration by Inactivating the STAT1 Signaling Pathway a-c: The impact of the STAT1 agonist, SB02024, on the tumorigenic potential of BIN1-KO cells. d: The effect of the STAT1 agonist, SB02024, on CXCL10 expression in tumors derived from BIN1-KO cells. e: The influence of the STAT1 agonist, SB02024, on CCL5 expression in tumors derived from BIN1-KO cells. f: The role of the STAT1 agonist, SB02024, in modulating CD8+ T cell infiltration within tumors derived from BIN1-KO cells. g: The effect of the STAT1 agonist, SB02024, on the infiltration of exhausted CD8+ T cells in tumors derived from BIN1-KO cells. h: The effect of the STAT1 agonist, SB02024, on the infiltration of CD8+ T cells in tumors derived from BIN1-KO cells. i: The influence of the STAT1 agonist, SB02024, on the expression of Ki-67 in tumors derived from BIN1-KO cells
In addition, we examined whether the effects of BIN1 knockout on the malignant biological behavior of NSCLC were associated with STAT1. EdU assays demonstrated that, compared to the BIN1-WT group, cells in the BIN1-WT + SB02024 group exhibited a significantly reduced proliferative capacity. Similarly, cells in the BIN1-KO + SB02024 group displayed markedly decreased proliferation compared to the BIN1-KO group (Supplementary Fig. 5b). Scratch healing assays showed that, compared to the BIN1-WT group, cells in the BIN1-WT + SB02024 group exhibited notably diminished migratory ability. Consistently, cells in the BIN1-KO + SB02024 group also exhibited significantly reduced migration relative to the BIN1-KO group (Supplementary Fig. 5c). Furthermore, Transwell migration and invasion assays revealed that, compared to the BIN1-WT group, cells in the BIN1-WT + SB02024 group showed a pronounced reduction in migration and invasion capabilities. Similarly, cells in the BIN1-KO + SB02024 group exhibited significantly diminished migration and invasion when compared to the BIN1-KO group (Supplementary Fig. 5d). Collectively, these findings suggest that the STAT1 agonist SB02024 effectively suppresses the proliferation, migration, and invasion of NSCLC cells, partially counteracting the pro-tumorigenic effects induced by BIN1 knockout.
These results indicate that BIN1 influences the expression of CXCL10 and CCL5 in the tumor microenvironment by modulating STAT1, thereby suppressing CD8+ T cell infiltration and affecting tumor progression. However, the precise mechanisms through which BIN1 and STAT1 regulate the proliferation, migration, and invasion of NSCLC cells remain to be elucidated.
BIN1 regulates ferroptosis in NSCLC cells via STAT1/GSH pathwayTo further elucidate the biological processes underlying BIN1’s role in NSCLC progression, we performed untargeted metabolomics to identify the critical metabolic pathways associated with BIN1 function. Through PLS-DA analysis, we observed a clear segregation of metabolic profiles between the BIN1-KO and BIN1-WT groups, signifying a significant and consistent metabolic shift resulting from altered BIN1 expression levels (Fig. 6a). The findings revealed that metabolites such as glutathione (GSH) and gamma-glutamylcysteine were markedly upregulated in BIN1 knockout cells (Fig. 6b-e). Moreover, KEGG pathway analysis identified glutathione metabolism in cancer as the most significantly altered pathway, based on the number of differing metabolites and statistical relevance (Fig. 6f). Additionally, we observed an increase in the GSH/GSSG ratio within the BIN1 knockout group (Fig. 6g). In summary, these results demonstrate that BIN1 knockout leads to glutathione accumulation in LLC cells.
Fig. 6
BIN1 Regulates Ferroptosis in NSCLC Cells via the STAT1/GSH Pathway a: PLS-DA analysis. b–e: Expression levels of metabolites in BIN1-KO cells. f: KEGG analysis of differentially expressed metabolites between the BIN1-WT and BIN1-KO cell groups. g: GSH/GSSG ratio in BIN1-WT and BIN1-KO cells. h–i: Levels of MDA and ROS in BIN1-WT and BIN1-KO cells. j: CCK-8 assay used to evaluate the effects of various death inducers and inhibitors on the viability of BIN1-WT and BIN1-KO cells. k: The effect of the STAT1 agonist SB02024 on the activity of Erastin-induced BIN1-KO cells analyzed via CCK-8
The intracellular GSH levels in tumor cells are strongly linked to ferroptosis. To explore the connection between BIN1 and ferroptosis, we performed malondialdehyde (MDA) detection and reactive oxygen species (ROS) measurement. Our findings revealed that MDA and ROS levels were significantly reduced in comparison to the BIN1-WT group (Fig. 6h and i). Subsequently, to further investigate the relationship between BIN1 and ferroptosis, we conducted a CCK-8 assay and analyzed morphological changes in cells under various treatment conditions. As illustrated in Fig. 6j, BIN1 knockout significantly suppressed erastin-induced cell death in LLC cells when compared to the BIN1-WT group. This suppressive effect was reversed by ferrostatin-1 and the apoptosis inhibitor Z-VAD-FMK but remained unaffected by the autophagy inhibitor 3-methyladenine.
To further determine whether BIN1 modulates ferroptosis in NSCLC cells through the STAT1/GSH pathway, we conducted an additional CCK-8 assay (Fig. 6k). The results showed that, compared to the BIN1-WT group, cell viability was significantly lower in the BIN1-WT + Erastin group. Furthermore, compared to the BIN1-WT + Erastin group, cell viability was markedly higher in the BIN1-KO + Erastin group. Notably, compared to the BIN1-KO + Erastin group, cell viability significantly decreased in the BIN1-KO + SB02024 + Erastin group. These observations suggest that BIN1 knockout diminishes the sensitivity of NSCLC cells to ferroptosis inducers, while the STAT1 agonist SB02024 can effectively counteract this effect. These results demonstrate that BIN1 regulates ferroptosis in NSCLC cells through the STAT1/GSH pathway.
BIN1 modulates the immune microenvironment and progression in NSCLC via the G3BP1/STAT1 axisTo investigate whether BIN1 promotes the progression of NSCLC through the G3BP1/STAT1 pathway, we developed a BIN1 knockout cell line with reduced G3BP1 expression. Initially, we observed that G3BP1 knockout could mitigate the GSH induction triggered by BIN1 knockout in NSCLC cells (Fig. 7a). Results from the EdU assay revealed that the proliferation of cells in the BIN1-WT + sh-G3BP1 group was significantly lower than that in the BIN1-WT group. Similarly, the proliferation of cells in the BIN1-KO + sh-G3BP1 group was markedly reduced compared to the BIN1-KO group (Fig. 7b). The scratch healing assay demonstrated that the migration repair capacity of cells in the BIN1-WT + sh-G3BP1 group was notably diminished compared to the BIN1-WT group. Likewise, the migration repair ability in the BIN1-KO + sh-G3BP1 group was significantly impaired relative to the BIN1-KO group (Fig. 7c). Moreover, the Transwell migration and invasion assays indicated that the migration and invasion abilities of cells in the BIN1-WT + sh-G3BP1 group were significantly reduced compared to the BIN1-WT group. Similarly, these abilities were markedly decreased in the BIN1-KO + sh-G3BP1 group compared to the BIN1-KO group (Fig. 7d). Apoptosis detection results further revealed that, compared to the BIN1-WT group, the level of apoptosis was significantly upregulated in the BIN1-WT + sh-G3BP1 group. Likewise, apoptosis levels in the BIN1-KO + sh-G3BP1 group were significantly elevated compared to the BIN1-KO group (Fig. 7e). In summary, knockdown of G3BP1 partially counteracts the regulatory effects of BIN1 on the proliferation, migration, invasion, and apoptosis of LLC cells. To further verify that BIN1 mediates its effects via the G3BP1/STAT1 axis, we established LLC cell lines overexpressing both G3BP1 and STAT1 (Supplementary Fig. 5h-i). EDU and Transwell assays revealed that G3BP1 overexpression promoted the proliferation, migration, and invasion of LLC cells, whereas STAT1 overexpression attenuated these effects induced by G3BP1 overexpression (Supplementary Fig. 5e-f). Additionally, overexpression of G3BP1 significantly suppressed ROS levels in LLC cells, whereas STAT1 overexpression partially abrogated this suppressive effect (Fig. 8a). Furthermore, G3BP1 overexpression suppressed Erastin-induced ferroptosis in LLC cells, an effect that was counteracted by STAT1 overexpression (Fig. 8b). These findings suggest that BIN1 regulates the malignant biological behaviors of LLC cells through G3BP1/STAT1 axis.
Fig. 7
BIN1 modulates the immune microenvironment and progression of NSCLC via the G3BP1/STAT1 axis. a: The impact of G3BP1 knockdown on the GSH/GSSG ratio in BIN1-KO cells. b: The effect of G3BP1 knockdown on cell proliferation in BIN1-KO cells. c: The influence of G3BP1 knockdown on cell migration in BIN1-KO cells. d: The role of G3BP1 knockdown in modulating both migration and invasion in BIN1-KO cells. e: The effect of G3BP1 knockdown on apoptosis in BIN1-KO cells. f–g: The influence of G3BP1 knockdown on the tumorigenic ability of BIN1-KO cells. h: The impact of G3BP1 knockdown on CD8+ T-cell infiltration in tumors derived from BIN1-KO cells. i: The effect of G3BP1 knockdown on CXCL10 expression in tumors derived from BIN1-KO cells. j: The effect of G3BP1 knockdown on CCL5 expression in tumors derived from BIN1-KO cells. k: The impact of G3BP1 knockdown on Ki-67 and STAT1 expression in tumors derived from BIN1-KO cells
Fig. 8
G3BP1 modulates the immune microenvironment and progression of NSCLC via STAT1. a: The impact of the STAT1 overexpression on the ROS level of G3BP1-OE cells. b: The effect of the STAT1 overexpression on the activity of Erastin-induced G3BP1-OE cells analyzed via CCK-8. c-e: The impact of the STAT1 overexpression on the tumorigenic potential of G3BP1-OE cells. f: The effect of the STAT1 overexpression on CCL5 expression in tumors derived from G3BP1-OE cells. g: The influence of the STAT1 overexpression on CXCL10 expression in tumors derived from G3BP1-OE cells. h: The role of the STAT1 overexpression in modulating CD8+ T cell infiltration within tumors derived from G3BP1-OE cells
Importantly, we investigated whether BIN1 reshapes the immune microenvironment of NSCLC via the G3BP1/STAT1 pathway in vivo. Tumor formation assays demonstrated that tumorigenicity in mice from the BIN1-WT + sh-G3BP1 group was markedly reduced compared to the BIN1-WT group. Similarly, tumorigenicity in mice from the BIN1-KO + sh-G3BP1 group was significantly decreased compared to the BIN1-KO group (Fig. 7f, g). Fluorescence tissue staining revealed a substantial increase in the number of CD8-positive T cells within tumor tissues in the BIN1-WT + sh-G3BP1 group, compared to the BIN1-WT group. Likewise, the number of CD8-positive T cells in the BIN1-KO + sh-G3BP1 group was significantly higher than in the BIN1-KO group (Fig. 7h). ELISA results indicated that serum levels of CXCL10 and CCL5 were notably elevated in the BIN1-WT + sh-G3BP1 group compared with the BIN1-WT group. A similar elevation in CXCL10 and CCL5 levels was observed in the BIN1-KO + sh-G3BP1 group compared to the BIN1-KO group (Fig. 7i, j). IHC analysis further demonstrated a significant reduction in the positive rates of G3BP1 expression and upregulation in the positive rates of STAT1 expression within tumor tissues in the BIN1-WT + sh-G3BP1 group compared to the BIN1-WT group. Correspondingly, compared with the BIN1-KO group, the BIN1-KO + sh-G3BP1 group exhibited a significantly reduced positive rate of G3BP1 expression in tumor tissues, whereas the positive rate of STAT1 expression was markedly increased (Fig. 7k). Meanwhile, we observed that G3BP1 overexpression promoted the tumorigenicity of LLC cells and inhibited CD8+T cells infiltration (Fig. 8c-h). In contrast, STAT1 overexpression partially attenuated the tumor-promoting effects of G3BP1 overexpression and its suppression of CD8+ T cell infiltration (Fig. 8c-h).
In summary, BIN1 regulates STAT1 expression through its interaction with G3BP1. STAT1, in turn, plays a dual role: it modulates CD8+ T-cell infiltration by controlling the expression of the chemokines CXCL10 and CCL5, and it affects ferroptosis in NSCLC cells via the GSH pathway.
Comments (0)