
Remember me
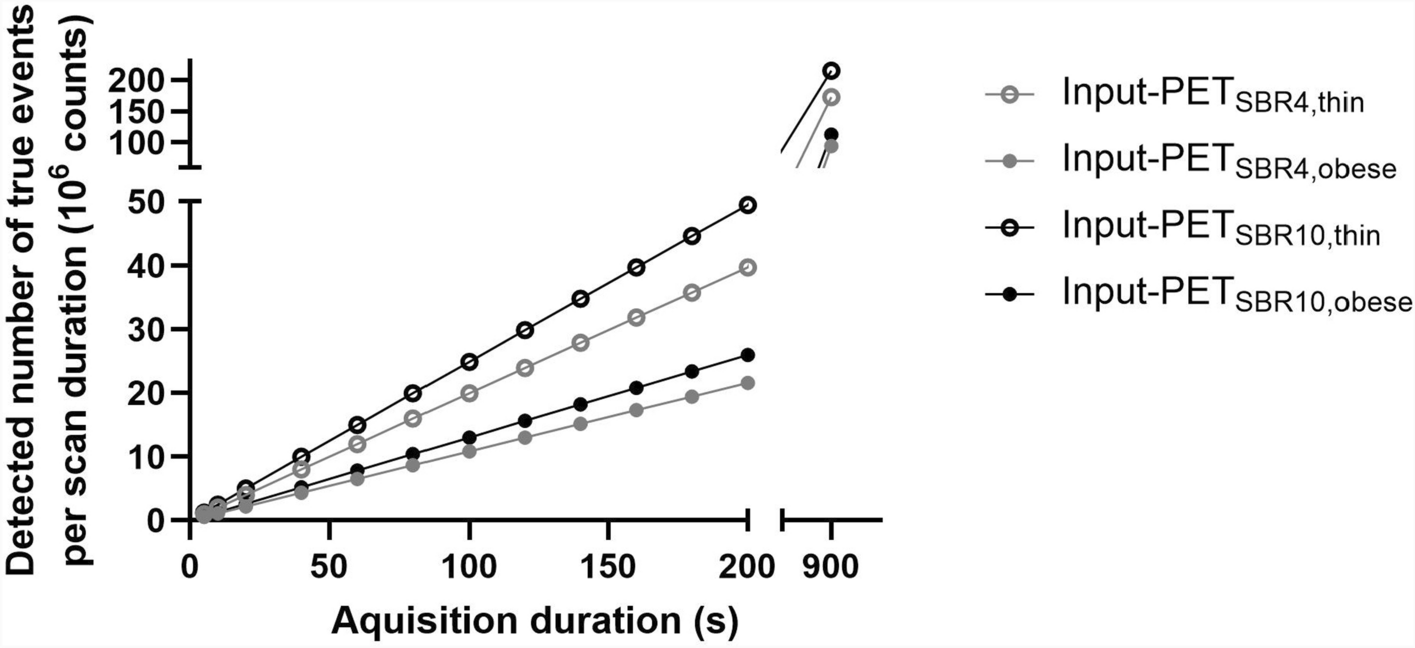


Image statics are shown in Fig. 1. The detected number of true events per reconstructed Input-PET scan increased linearly with increasing acquisition duration. In Input-PETSBR4, obese and Input-PETSBR10, obese scans, respectively, image statistics were reduced to 54% and 52% relative to the corresponding scans of the thin phantom setup. For thin and obese phantom setup scans, the number of true events detected in SBR10 compared to SBR4 scans were 25% and 20% higher, respectively, due to the varying amounts of activity in the phantom at the timepoint of imaging.
Fig. 1
Image statistics. Image statistics were determined as the detected number of true events as a function of acquisition duration (5 s, 10 s, 20 s to 200 s in steps of 20 s and 900 s) of the Input-PET scan with SBR4 (gray) and SBR10 (black) and thin (open circle) as well as obese phantom setups (closed circle). The detected number of true events increased linearly with increasing acquisition duration and was only 54% and 52% in the Input-PETSBR 4, obese and Input-PETSBR 10,obese scans, receptively, relative to the corresponding thin phantom setup scans
Image quality : qualitative and semi-quantitative evaluation (CoV BG and CNR)For qualitative comparison of image quality between low- and high-count Input-PET, corresponding AI-enhanced AI-PET and corresponding ground truth scans, Fig. 2 exemplarily illustrates the Input-PET and AI-PET scans of the NEMA PET body phantom with SBR4 and thin as well as obese phantom setup for different acquisition durations.
Fig. 2
Qualitative comparison of Image Quality between Input-PET, ground truth and AI-PET scans. PET scans of the NEMA PET body phantom with SBR4 as well as the corresponding AI-PET scans are shown at the same axial position for thin and obese phantom setup scans and for different acquisition durations ranging from 5 s (column 1) to 900 s (column 6). For both phantom setups, the Input-PET scan, which was considered as reference ground truth scan, is edged in gray
Compared to the corresponding ground truth scan, image quality of the low-count Input-PET improved with increasing acquisition duration and became more and more similar to the ground truth scan: noise in the background compartment decreased and (especially small) lesions were better visible (Fig. 2). Consistently, CoVBG decreased in Input-PET scans with increasing acquisition duration/image statistics and became more and more similar to the CoVBG in the ground truth scan (Fig. 3 and supplementary Table S.4), the relationship follows a power law (r2 = 1 for all 4 setups). In addition, CNR increased with increasing acquisition duration in Input-PET, which indicates improving visibility of the spheres in scans featuring higher image statistics (Fig. 4).
Fig. 3
Image noise (CoVBG) of Input-PET and AI-PET scans as function of acquisition duration. Image noise (CoVBG) is shown as a function of acquisition duration (5 s, 10 s, 20 s to 200 s in steps of 20 s and 900 s) of Input-PET (solid line) and AI-PET scans (dashed line) for each of the four phantom setups (SBR4: gray circle; SBR10: black square; thin: open circle/square; obese: closed circle/square). The smaller image in the top right-hand corner shows the CoVBG for a smaller range of 0 ≤ CoVBG ≤ 27
Fig. 4
Contrast Noise Ratio (CNR) of Input-PET and AI-PET scans for each of the four phantom setups. Contrast Noise Ratio (CNR) of Input-PET (solid lines, circles) and corresponding AI-PET scans (dashed lines, squares) is shown for each of the four phantom setups (SBR4: gray; SBR10: black; thin: open circles/squares; obese: closed circles/squares). CNR values of the 10 s acquisition duration scans (A) and 180 s acquisition duration scans (B) are shown as a function of the inner sphere diameter ranging from 10 to 37 mm. CNR values of the sphere of the NEMA phantom with 10 mm (C), 13 mm (D) and 17 mm (E) inner diameter are shown as a function of acquisition duration (5 s, 10 s, 20 s to 200 s in steps of 20 s and 900 s)
Visual evaluation of Fig. 2 revealed that image quality of AI-PET scans was much better than that of the low-count Input-PET scans for very short acquisition durations ≤ 20 s: image noise was lower and the visibility of lesions was better, especially for small lesions. Consistenty, semi-quantitative evaluation of image quality revealed that the deep-learning neural network was very well able to reduce CoVBG when applied to ultra-short Input-PET scans ≤ 60 s featuring very high noise levels (Fig. 3 and supplementary Table S.4). Even when Input-PET scans featured a CoVBG of up to 126.63%, as for the SBR4, obese setup and 5 s scan time, the AI algorithm was able to strongly reduce the noise level to 26.0% (supplementary Table S.4).
Both in Input-PETSBR4, thin and Input-PETSBR4, obese scans, the two smallest spheres of the phantom featuring an inner diameter of 10 mm and 13 mm, respectively, were no longer detectable in ultra-short scans of 5 s acquisition duration (Fig. 2). Consistently, CNR of those two spheres was ≤ 5 in Input-PETSBR4, thin with 5 s acquisition duration and in Input-PETSBR4, obese scans with 5 s and 10 s acquisition duration, respectively (Fig. 4), indicating that lesions were no longer visible as of the Rose criterion [10]. In comparison, in AI-PETSBR4, thin scans, even in ultra-short recordings as short as 5 s, all spheres were visible (Fig. 2) and CNR values were > 5 for all spheres (Fig. 4).
Although image quality of low-count Input-PET scans improved both visually and semi-quantitively with increasing acquisition duration, visual image quality of AI-enhanced AI-PET scans was similar in all AI-PET scans ≥ 40 s acquisition duration and therefore almost independent of the quality of the corresponding Input-PET scans (Fig. 2). Consistent with visual evaluation, CoVBG was in a similar range in all AI-PET scans ≥ 20 s acquisition duration and similar to that of the corresponding ground truth Input-PET scan (Fig. 3 and supplementary Table S.4) Similarly, for each phantom setup, semi-quantitative evaluation of CNR revealed similar values in all AI-PET scans with ≥ 60 s acquisition duration of the corresponding Input-PET scans and much lower CNR values compared to the corresponding ground truth Input-PET scan (Fig. 4).
However, when acquisition duration of the Input-PET scans exceeded that of the corresponding ground truth scan, visual image quality of Input-PET was better than that of the corresponding AI-PET (Fig. 2). Consistently, in cases where Input-PET data were of very high statistics and subsequently of low CoVBG, the AI-algorithm generated AI-PET data of paradoxically increased CoVBG, as for example for the SBR4, thin phantom setup and 900 s acquisition duration (supplementary Table S.4). In addition, in all Input-PET scans with scan durations ≥ 60 s, CNR values of all spheres were higher than in the corresponding AI-PET images (Fig. 4), indicating better visibility of lesions in Input-PET compared to corresponding AI-PET scans (Fig. 4). When analyzing each individual Input-PET dataset, CNR values were comparable between spheres of different sphere diameters. In comparison, CNR values decreased with decreasing sphere diameter in each AI-PET scan, indicating a deterioration of the visibility of lesions with decreasing lesion size (Fig. 4).
While in Input-PETSBR4, thin and Input-PETSBR4, obese scans with acquisition duration ≥ 20 s all spheres were visually detectable, the smallest sphere of 10 mm diameter was difficult or impossible to visually detect in all AI-PETSBR4, obese and AI-PETSBR4, thin scans, respectively, even for very long acquisition durations of 900 s (Fig. 2). Consistently, CNR of the 10 mm diameter sphere were far below 5 in all AI-PETSBR4, obese scans (maximum: 3.45 in AI-PETSBR4, obese of 20 s duration) and much lower in AI-PETSBR4, thin compared to corresponding Input-PETSBR4, thin scans for acquisition durations ≥ 20 s (Fig. 4).
AI-PETSBR4, obese scans were conspicuous since CNR values of the two smallest spheres were not only < 5 for ≤ 20 s acquisition duration scans (as for the other three phantom setups), but CNR values of the two smallest spheres were < 5 in all scans of this scenario and therefore independent of the count statistics of the Input-PET (Fig. 4).
Image-to-image comparison using image quality measurement metrics (SSIM, PSNR, MAE)In accordance with the original paper [5] and as in other studies on the use of AI for image enhancement [3], also in the phantom validation performed here the application the AI Algorithm to Input-PET data with short acquisition duration well restored structural information and enhanced image quality in AI-PET images compared to low count Input-PET data, as assessed semi-quantitively by an increase in SSIM and PSNR and a decrease in MAE (Table 1 and supplementary Tables S.7 and S.8). As summarized in Table 1, the phantom-based validation resulted in similar SSIM values as in the clinical validation in [5]. Other AI-based algorithms for image enhancement of low-dose whole-body PET images also revealed similar SSIM values when evaluated on clinical data [3].
Table 1 Image-to-image metric Structural Similarity Index Measure (SSIM) comparing Input-PET or AI-PET scans with the respective ground truth scanAll AI-generated image data featured strip-shaped artifacts, as illustrated in Fig. 5 representatively for the 180 s acquisition durations. This is probably the main reason why all AI-PET scans showed an increased MAE, even when PET scans of high image quality served as AI-input like the ground truth data or Input-PET scans with even longer acquisition durations.
Fig. 5
Maximum intensity projection of AI-PET scans. Maximum intensity projection of the AI-PET scans of the four phantom setups and at 180 s acquisition duration in axial (colum 1), axial/lateral (colum 2), and lateral view (colum 3)
Compared to the clinical validation presented in [5], the phantom validations provide further information: For Input-PET data, SSIM and PSNR decreases and MAE increase with decreasing acquisition duration, which means a change of structural information, deterioration in image quality and noise increase as compared to the ground truth data (Table 1 and supplementary Tables S.7 and S.8). Such an image deterioration is to be expected by the decreasing image statistics. However, when acquisition duration was sufficiently long (≥ 140 s) or even longer than the ground truth data, structural information remained uniform and unchanged in Input-PET data (which is reflected in a SSIM of 1 in those Input-PET data, Table 1). However, an application of the AI algorithm to Input-PET data with higher acquisition duration than the ground truth data (resulting in no change of structural information and an unchanged SSIM of 1 in the Input-PET data) resulted in a slight decrease of SSIM, strong decrease in PSNR and increase in MAE in AI-PET compared to ground truth scans, meaning a deterioration of image quality and slight modification of structural information compared to the ground truth data.
Quantitative accuracy: recovery coefficients and SUVFor spheres with inner diameter > 10 mm and acquisition durations > 10 s, RCmean values were similar in all Input-PET scans and ranged between 0.95 and 1.12 (Fig. 6). In Input-PET, RCmean of the smallest sphere of 10 mm diameter fluctuated a bit more and reached values between 0.84 (Input-PET5s, SBR4, obese) and 1.39 (Input-PET10s, SBR4, thin). Comparing AI-PET with ground truth or with all other Input-PET scans for corresponding sphere diameter and the four phantom setups, RCmean values were much lower in all AI-PET datasets except for the largest sphere of 37 mm diameter. While RCmean values were independent of sphere diameter in the respective ground truth scans, RCmean values strongly decreased with decreasing sphere diameter in all AI-PET scans. The maximum underestimation of SUVmean occurred in AI-PET5s, SBR4, obese: RCmean was as low as 0.2 for the 10 mm inner diameter sphere.
Fig. 6
Mean Recovery Coefficient (RCmean) of Input-PET and AI-PET scans for each of the four phantom setups. The Mean Recovery Coefficient (RCmean, determined as the measured SUVmean relative to the actual activity concentration in the phantom sphere) is shown as a function of the inner sphere diameter ranging from 10 to 37 mm of Input-PET (solid lines, circles) and AI-PET scans (dashed lines, squares) for different acquisition durations (5 s to 900 s: light gray to black) for each of the four phantom setups (SBR4: upper row; SBR10: lower row; thin: left column; obese: right column)
As of Fig. 7, RCmax values were much lower in AI-PET compared to the respective ground truth or all other Input-PET datasets for all phantom setups and for all spheres featuring an inner diameter ≤ 22 mm. While RCmax values increased with decreasing acquisition time/statistics in Input-PET scans, RCmax values were similar in all AI-PET scans of differing acquisition durations. RCmax values strongly decreased with decreasing sphere diameter in each of the AI-PET scans, while no such dependence of RCmax on sphere diameter occurred in ground truth scans (but in Input-PET data of low statistics). Absolut differences in SUVmax between Input-PET and corresponding AI-PET were comparable for differing acquisition durations but increased with decreasing sphere diameter and ranged between mean ± SD of 1.55 ± 0.42 for smallest spheres of the SBR4 and obese phantom scans and 0.02 ± 1.36 for spheres of 37 mm diameter in the SBR4 and thin phantom scan.
Fig. 7
Maximum Recovery Coefficient (RCmax) of Input-PET and AI-PET scans for each of the four phantom setups. Maximum Recovery Coefficient (RCmax, determined as the measured SUVmax relative to the actual activity concentration in the phantom sphere) as function of the inner sphere diameter ranging from 10 to 37 mm for Input-PET (solid lines, circles) and AI-PET scans (dashed lines, squares) for different acquisition durations (5 s to 900 s: light gray to black) for each of the four phantom setups (SBR4: upper row; SBR10: lower row; thin: left column; obese: right column)
As shown in the supplementary Tables S.5 and S.6, the validation of the semi-quantitative accuracy of the AI algorithm using phantom data (at SBR4 and thin patient setup) yielded similar values as using clinical data in [5] for the absolute difference of SUVmean and SUVmax values between AI-PET and the respective ground truth scan, respectively, when analyzing all lesions or more specifically only lesions in lymph nodes. A higher sphere-to-background contrast ratio of 10 in the phantom validation resulted in higher absolute SUVmean and SUVmax differences, respectively, than the validation using clinical data presented in [5]. Except for ultrashort scans with acquisition durations ≤ 20 s (which corresponds to a ≤ 10-times reduced acquisition duration), the SUV differences in all AI-PET scans of different acquisition durations were of a similar order of magnitude. In contrast, the acquisition duration of the ground truth Input-PET scans can be shortened to an acquisition duration of about half of that of the ground truth Input-PET scans without introducing any SUVmean and strong SUVmax differences, respectively. Even for Input PET scans with acquisition durations of about 1/3 of that of the ground truth scans and longer, the SUV differences compared to ground truth scans were smaller than those of AI-generated AI-PET scans.
AI versus Gaussian filterFigure 8 and Table 2 compare unfiltered and post-filtered Input-PETSBR4, thin scans with 10 s acquisition duration with the AI-PETSBR4, thin, 10 s scan and the ground truth scan, respectively.
Fig. 8
Qualitative and semi-quantitative comparison of unfiltered and post-filtering Input-PET scans and the corresponding AI-PET. Qualitative (A) and semi-quantitative (B–D) comparison of the impact of post-filtering of the Input-PETSBR4, thin scans with 10 s acquisition duration as well as the AI-PETSBR4, thin scan corresponding to the unfiltered Input-PET scan. Post-filtering of the Input-PETSBR4, thin scan was applied using a Gaussian filter with 2 mm FWHM (G2), 5 mm FWHM (G5), 10 mm FWHM (G10), 15 mm FWHM (G15), and 20 mm FWHM (G20, A). For qualitative comparison in A, all scans are shown at the same axial position and using the same color scale. For semi-quantitative comparison, Mean and Maximal Recovery Coefficient (RCmean/RCmax, determined as the measured SUVmean/SUVmax relative to the actual activity concentration in the phantom sphere) are shown in B/C as a function of the inner sphere diameter ranging from 10 to 37 mm for Input-PET without and with G2 to G20 filtering (solid lines, circles) and AI-PETSBR4, thin scans (dashed line, blue). Contrast Noise Ratio (CNR) is shown in D as a function of the inner sphere diameter ranging from 10 to 37 mm for Input-PET without and with G2 to G20 filtering (solid lines, circles) and AI-PETSBR4, thin scans (dashed line, blue)
Table 2 Semi-quantitative comparison of unfiltered and post-filtering SBR4,thin,10 s-Input-PET scans with respective ground truth scanIn summary, the AI algorithm improved image quality better than when a Gaussian filter was applied to the data, with the FWHM of 5 mm to 10 mm filter performing best when considering the different Gaussian filter sizes. In detail, a visual analysis revealed an almost as good image quality (low background noise and good recognizability of the spherical structures) in ground truth and AI-PET10s scans and only little deterioration in the 5 mm or 10 mm FWHM filtered scans, while it was worse in 2 mm, 15 mm and 20 mm FWHM post-filtered scans.
Semi-quantitative analyses confirmed that CoVBG was in the same order of magnitude in AI-PET10s and ground truth scans and only slightly lower in the Input-PET10s, G10 scan, but higher in the Gaussian-filtered images when using a lower filter size than 10 mm (Table 2). The image quality measurement metrics analyses confirmed a very high structural similarity (SSIM ≥ 0.998) and the smallest differences in PSNR and MAE when comparing the ground truth scan with the AI-PET, 5 mm, or 10 mm Gaussian filtered images, while it was worse in the Gaussian filtered images using a FWHM of 2 mm, 15 mm or 20 mm (Table 2). Due to the strong reduction of image noise by post-filtering, CNR decreased significantly for the smallest spheres as the filter size increased (Fig. 8). As CNR is a measure of lesion visibility, this confirmed the visual impression that the small lesions became blurred with increasing filter size and were increasingly difficult to distinguish from the ground.
While compared to the ground truth data the image quality was better in the AI-PET scan than in the post-filtered data, qualitative accuracy was worse. Underestimation of SUVmean increased with increasing Gaussian filter size (increase in SUVmean difference and decrease in RCmean with values lower 1, Fig. 8 and Table 2) and SUV inaccuracy was higher in AI-PET compared to post-filtered scans when a FWHM of 2 mm to 10 mm FWHM filter size was used. SUV values were only consistent between spheres of different sizes in Input-PET10s, G2 and Input-PET10s, G5 scans, but not in the AI-PET scan or stronger filtered images.
Comments (0)