
Remember me
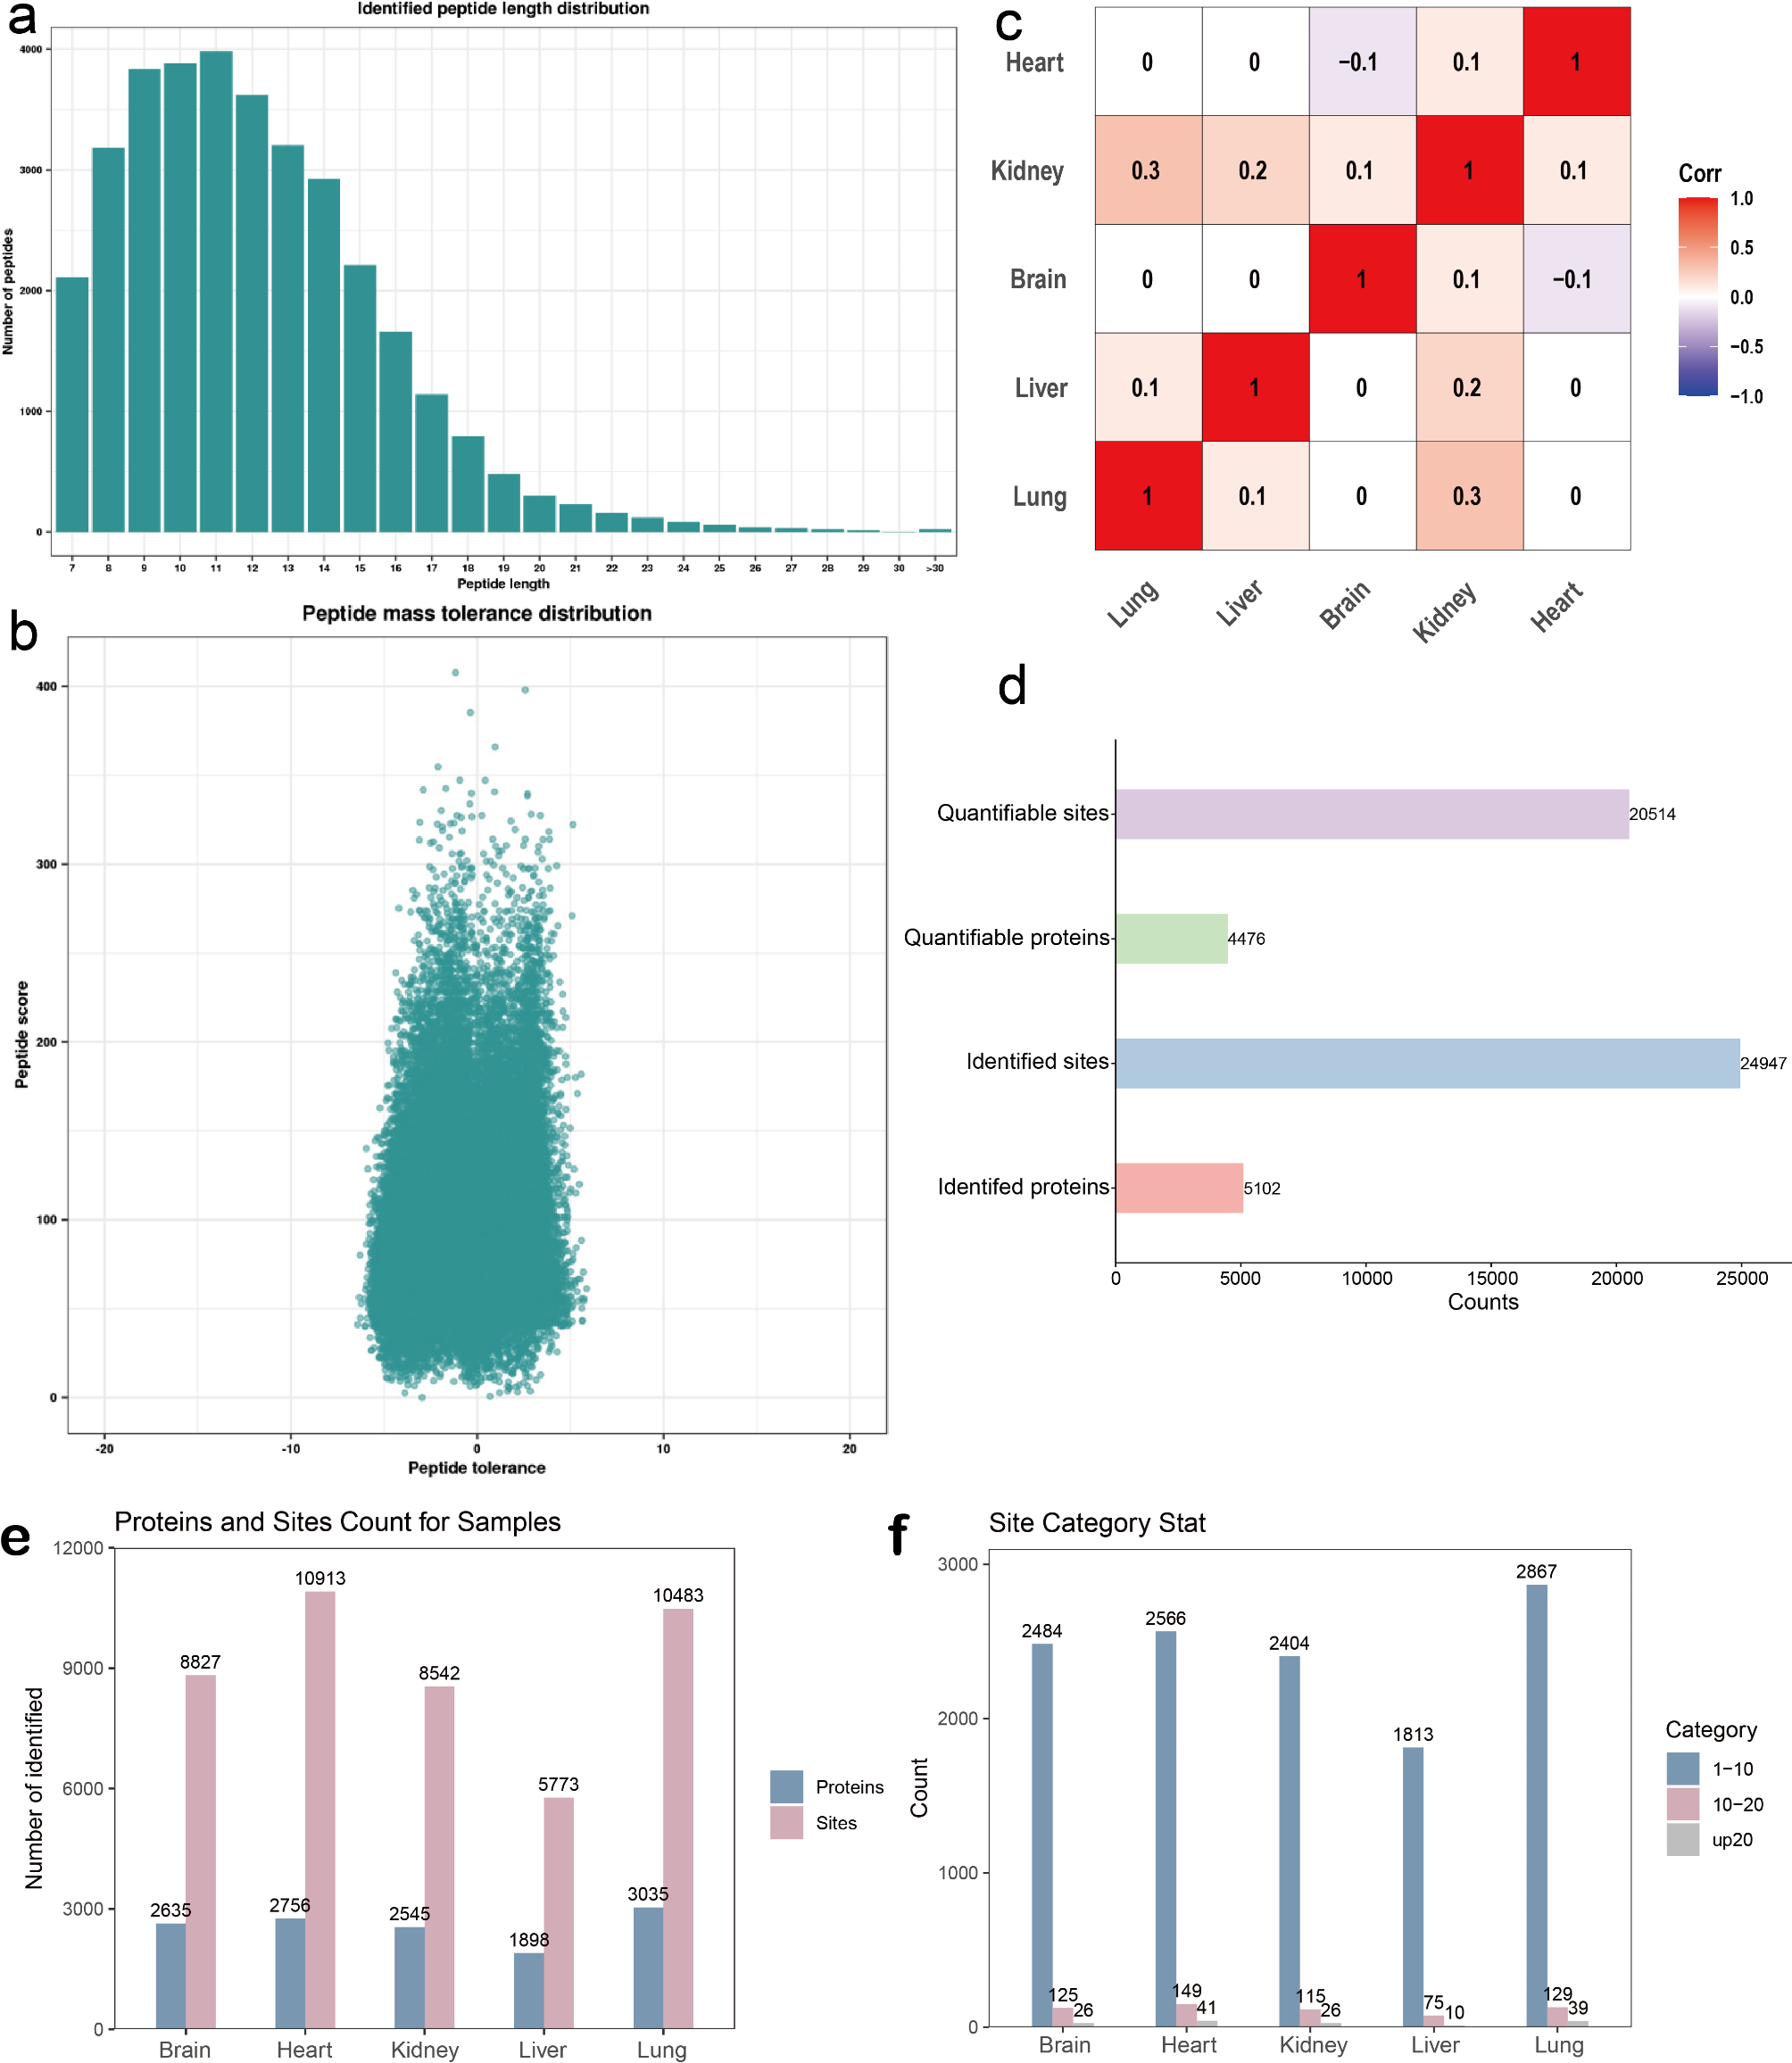


We collected a case of flow products and analyzed Kcr modifications on brain, heart, kidney, liver and lung. The majority of the peptides were dispersed between 7 and 20 amino acids, according to mass spectrometry-based assay quality control, which is in line with the general pattern of trypsin digestion and HCD rupture mode (Fig. 1a). Furthermore, mass errors for the great majority of the detected peptides were within 10 ppm (Fig. 1b). These outcomes demonstrate the accuracy of our crotonylation data. Heterogeneity among the five samples was discovered by correlation analysis, and the findings are displayed as a heat map (Fig. 1c).
Fig. 1
Lysine crotonylation modifications of brain, heart, kidney, liver, and lung organs in 17-week fetus. (a) The length distribution of all identified lysine crotonylation peptides. (b) Mass accuracy distribution of all identified Kcr peptides. (c) Correlation heat map analysis of each organ sample. (d) Basic information statistics of mass spectrometry data results of lysine crotonylation assay for each organ. (e) Number of detected Kcr proteins and sites in each organ. (f) Crotonylation modification sites from each organ are distributed in a single protein
The results revealed that 5,102 proteins and 24,947 Kcr modification sites were discovered (Fig. 1d). Kcr protein sites identified in each organ are shown in Fig. 1e and f. In brain tissue, 2,635 proteins and 8,827 Kcr modification sites were identified, with 2,484 proteins having low modification sites (1 to 10 Kcr modification sites one protein), 125 proteins having medium modification sites (10–20 Kcr modification sites one protein), and 26 proteins having high modification sites (more than 20 Kcr modification sites one protein). In heart tissue, 2,756 proteins and 10,913 Kcr modification sites were found, with 2,566 low modification sites, 149 middle modification sites, and 41 high modification sites. In kidney tissues, 2,545 proteins and 8,542 Kcr modification sites were discovered, with 2,404 being low modification sites, 115 middle modification sites, and 26 high modification sites. There were 1,898 proteins and 5,773 Kcr modification sites found in liver tissue, with 1,813 being low modification sites, 75 being medium modification sites, and 10 being high modification sites. In lung tissue, 3,035 proteins and 10,483 Kcr modification sites were identified, with 2,867 low, 129 medium, and 39 high.
Subcellular localization analysis and GO classification of co-expressed Kcr proteinsWe used Venn analysis to investigate the correlation and heterogeneity of Kcr proteins in the five organs and discovered that 1,154 proteins were expressed in all five organs, with 311 proteins specifically expressed in the heart, 457 proteins in the brain, 386 proteins in the lungs, 147 proteins in the liver, and 106 proteins in the kidney (Fig. 2a). The proteins that were co-expressed in the five organs were classified using subcellular localization (Fig. 2b) and GO (Fig. 2c). As demonstrated, the greatest component was cytoplasm (43.12%), followed by the nucleus (23.81%) and mitochondria (13.16%). It was projected that some co-expressed Kcr proteins would be dispersed in the extracellular (7.27%), plasma membrane (3.90%), and cytoplasm (4.85%). The results of GO classification revealed that cellular process (22.81%) was the largest category in the classification of biological processes, followed by biological regulation (17.41%) and metabolic process (16.27%). The largest group of cellular components was organelle (15.42%), followed by cytosol (10.17%) and membrane (9.95%). In molecular function classification, binding (45.58%) was the most common category, followed by catalytic activity (19.58%) and molecular function regulator activity (7.06%).
Fig. 2
Functional annotation of co-expression Kcr proteins in brain, heart, kidney, liver and lung organs. (a) Venn analysis screening for co-expression Kcr proteins in brain, heart, kidney, liver and lung organs. (b) Subcellular localization analysis of co-expression Kcr proteins. (c) GO classification of co-expression Kcr proteins
Functional enrichment analysis of co-expressed Kcr proteinsTo further study the biological functional significance of the co-expressed Kcr proteins, GO and KEGG enrichment analysis were carried out on the proteins from all five organs. The findings of the GO analysis are displayed in Fig. 3a-c. In terms of biological processes, co-expressed Kcr proteins were considerably enriched in purine-containing compound metabolic process, RNA splicing, purine nucleotide metabolic process, and genetic material synthesis (Fig. 3a). Significantly associated with cell-substrate junction, focal adhesion and vesicle lumen cellular components (Fig. 3b). In terms of MF, it was significantly correlated with cadherin binding, actin binding, and ATP hydrolysis activity functions (Fig. 3c). Based on KEGG pathway enrichment analysis, our visualization of the top 30 significantly enriched pathways revealed that co-expressed Kcr proteins were significantly enriched in Pathways of neurodegeneration - multiple diseases, Amyotrophic lateral sclerosis, and Alzheimer’s disease (Fig. 3d). Most importantly, the terms “transcription” and “translation” were confirmed. Furthermore, we divided the KEGG enrichment results into six categories: metabolism, human biseases, organismal systems, cellular processes, genetic information processing, and environmental information processing, and the results are given in the form of hierarchical network diagram (Fig. 4).
Fig. 3
Enrichment analysis of co-expression Kcr proteins. GO enrichment analysis of co-expression Kcr proteins, including biological processes (a), cellular components (b) and molecular functions (c). (d) KEGG enrichment analysis of co-expression Kcr proteins
Fig. 4
Based on the results of KEGG enrichment analysis, a hierarchical network diagram depicts the six biological categories of co-expression Kcr proteins and their interrelationships in the brain, heart, kidney, liver, and lung organs
PPI analysis of co-expressed Kcr proteinsPPI analysis of co-expressed Kcr proteins was performed using the string database, and the interacting proteins were categorized into five clusters by different algorithms: translation and ribosome, mitochondrial and ribonucleoside, catabolic process, splicing and telomere regulation, and it was found that there was a correlation between the co-expressed Kcr proteins (Fig. 5a). Translation and ribosome functions have the strongest interactions with Kcr proteins.
Fig. 5
PPI network analysis (a) and site motif analysis (b) of co-expression Kcr proteins. (c) Number of the Kcr peptides in each motif
Motif analysis of co-expressed Kcr proteinsTo establish the Kcr proteomic profile during fetus development. We analyzed the Motif features of the crotonylation sites on five organ co-expressed Kcr proteins. Heatmaps reflect peptide sequences consisting of 10 amino acids upstream and downstream of the identified modification sites (Fig. 5b-c). Lysine (K), alanine (A), and glutamic acid (E) residues all occur with high frequency in the top 10 positions upstream and downstream of the modification site. In contrast, cysteine (C) and serine (W) residues occur less frequently.
Functional enrichment analysis of specifically expressed proteinsTo investigate the heterogeneity of the brain, heart, kidney, liver, and lung during development, we used heat map analysis of specific modification sites and functional enrichment analysis of specific expressed proteins from the five organs (Fig. 6). The figure depicts 982 specific Kcr modification sites on brain-specific expression proteins, 1,570 specific Kcr modification sites on heart-specific expression proteins, 158 specific Kcr modification sites on kidney-specific expression proteins, 300 specific Kcr modification sites on liver-specific expression proteins, and 501 specific Kcr modification sites on liver-specific expressed proteins.
GO-BP analysis revealed that brain-specific expressed proteins were substantially linked with synapse organization axonogenesis, regulation of neuron projection development、modulation of chemical synaptic transmission, and regulation of transsynaptic signaling. Myofibril assembly mitochondrial gene expression, striated muscle cell development, cellular component assembly involved in morphogenesis, and mitochondrial translation biological processes functioned with significant correlation in the heart. Kidney-specific expression of proteins was significantly associated with the establishment or maintenance of epithelial cell apical/basal polarity, establishment or maintenance of apical/basal cell polarity, establishment or maintenance of bipolar cell polarity, positive regulation of T cell receptor signaling pathway, and positive regulation of antigen receptor-mediated signaling pathway. Liver-specific expressed proteins were significantly associated with small molecule catabolic process, organic acid catabolic process、carboxylic acid catabolic process, alpha-amino acid metabolic process, and amino acid catabolic process.
Fig. 6
Biological process analysis and KEGG analysis were used to examine the functional enrichment of Kcr proteins expressed in various organs
In addition, Axon guidance Endocytosis Salmonella infection, Ras signaling pathway, and Pathways of neurodegeneration-multiple diseases were specifically enriched in the brain according to KEGG enrichment analysis. Cytoskeleton in muscle cells Dilated cardiomyopathy, Hypertrophic cardiomyopathy, Arrhythmogenic right ventricular cardiomyopathy, and Cardiac muscle contraction were specifically enriched in the heart. Specifically expressed proteins in the kidney were significantly enriched in Arginine and proline metabolism, Sphingolipid metabolism Tight junction, and Renin-angiotensin system Rap1 signaling pathway. specifically expressed proteins in the liver were significantly enriched in Peroxisome Mineral absorption, PPAR signaling pathway, Alanine, aspartate and glutamate metabolism, and Arginine biosynthesis. Polycomb repressive complex, Ribosome biogenesis in eukaryotes, small cell lung cancer, AGE-RAGE signaling pathway in diabetic complications, and Vascular smooth muscle contraction were specifically enriched in lung.
Motif analysis of specifically expressed proteinsMotif analysis revealed that, overall, Kcr modification sites had comparable characteristics in all five organs, with considerable enrichment in glutamate (E), lysine (K), and valine (L) residues (Fig. 7). However, there were variations in the frequency of site enrichment. In brain organs, E residues were more common at modification sites 1, -1, and − 2, K residues at modification sites 8, -7, and − 9, and L residues at modification sites − 3 and − 4. In cardiac organs, E residues appeared in higher frequency at modification sites 1, -1, -2 and K residues appeared in higher frequency at modification sites 6, 7, -6, -9. In heart organs, E residues appeared in higher frequency at position − 1 of the modification site, K residues appeared in higher frequency at position 6 of the modification site, and L residues appeared in higher frequency at positions 1, 5, -4, -6, and − 7 of the modification site. In the liver organ, E residues appeared in higher frequency at modification sites 1 and − 1, K residues appeared in higher frequency at modification site 5, and L residues appeared in higher frequency at modification site 2. In lung organs, E residues appeared at higher frequency at modification site 3, K residues at modification site − 5, L residues at modification sites 4, -2, -3, -4, -7, and R residues at modification sites 5 and − 9.
Fig. 7
Heatmap illustrating the amino acid composition around the Kcr modification site, as expressed in various organs, showing the frequency of the first ten different types of amino acids upstream and downstream of the residue. Red represents enrichment, whereas blue signifies depletion
Screening and motif analysis of highly modified sites for KcrVenn analysis results revealed a total of 5 significantly changed proteins in 5 organs: SPTBN1, HSP90AA1, MYH9, MYH10, and SPTAN1 (Fig. 8a). In addition, 12 highly modified proteins were specifically expressed in the brain, 19 in the heart, 2 in the kidney, 2 in the liver, and 11 in the lung. Meanwhile, alanine (A), glutamic acid (E), lysine (K), and valine (L) residues appeared at higher frequencies in the top 10 positions upstream and downstream of the highly modified sites, in contrast to cysteine (C) residues, which appeared at lower frequencies (Fig. 8b).
Fig. 8
Motif analysis of crotonylation high modification sites, with more than 20 modification sites in each organ. (a) Venn diagram showing the high modification sites of each organ. (b) A heatmap of high modification1 sites that are co-expressed in the brain, heart, kidney, liver, and lung
Comments (0)