
Remember me


Ethics committee approval was obtained before the commencement of the study from Eskişehir Osmangazi University Non-Interventional Clinical Research Ethics Committee (decision no: 54, dated:23.07.2024; ethics committee approval protocol number: 2024 − 253). A total of 24 patients with transverse maxillary narrowing who applied to Eskişehir Osmangazi University, Faculty of Dentistry, Department of Orthodontics and Oral and Maxillofacial Surgery between 2013 and 2024 were included in this study. The scientific ethical compliance of this study was ensured by informing the participants and/or their parents, both verbally and in writing, about the purpose and methodology of the study, and obtaining their signed consent.
Inclusion criteriaPatients diagnosed with transverse maxillary narrowing.
Patients who underwent either RME or SARME between 2013 and 2024.
Availability of preoperative (T0) and 3-month postoperative (T1) CBCT images for analysis.
Patients without systemic diseases or syndromes that could affect bone regeneration or healing.
Patients not taking regular medications that could interfere with skeletal or dental responses.
Exclusion criteriaPatients with systemic diseases or syndromes that might impact the study outcomes.
Patients who were taking medications regularly that could affect bone density or suture healing.
Patients who did not complete the 3-month retention period or had incomplete CBCT records.
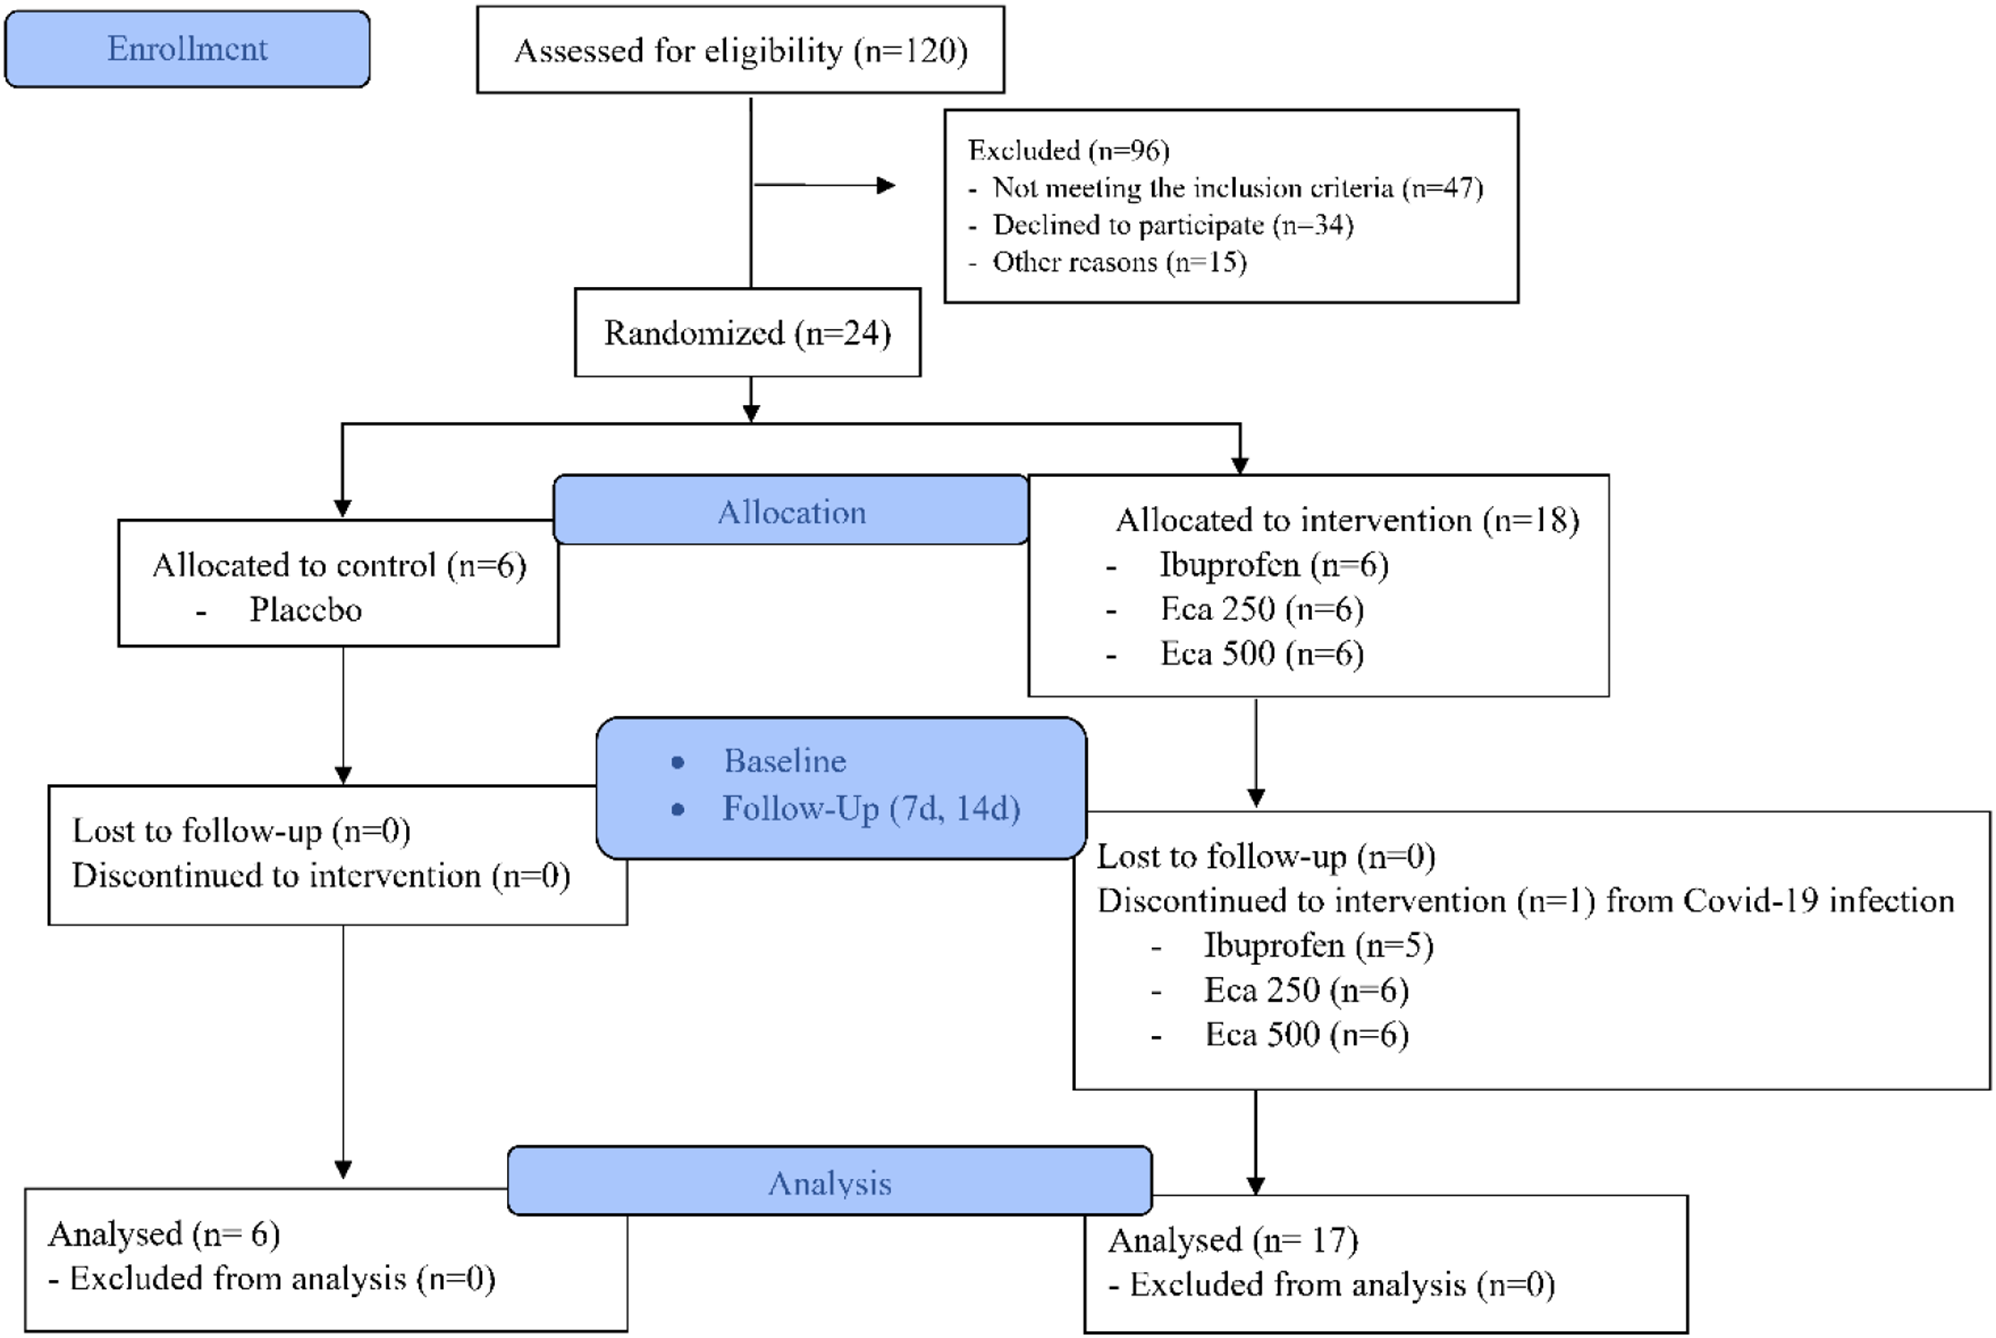
Sample sizeIn this study, the required sample size calculation was made using G*Power 3.1.9.4 software. A two-tailed t-test was selected to compare the means of two independent groups. In the calculation, the effect size (Cohen’s d) was determined as 1.4, α error probability as 0.05 and power (1-β) as 0.80. The sample sizes for RME and SARME were calculated as 11 and 9, respectively. In this direction, a total of 24 samples were included.
Interventions and proceduresRationale for RME and SARME selectionThe choice between RME and SARME was determined based on the patient’s age, clinical evaluation, and radiographic assessment of the MPS maturity. RME was performed on patients with open or partially fused MPS, typically observed in younger individuals where non-surgical expansion was expected to achieve sufficient maxillary widening. SARME was indicated for patients with fully fused MPS or advanced skeletal maturity, commonly seen in older adolescents or adults, where surgical intervention was necessary to enable effective expansion. This decision-making process ensured that the most appropriate technique was applied to maximize treatment efficacy and minimize complications.
RME protocolAfter the placement of mini screws and molar bands, impressions were taken with alginate. The appliance was cemented using dual-cure glass ionomer cement for molar bands and light-cured composite filling material for recesses. Hyrax expansion screws were activated twice daily (0.25 mm per turn), continuing until the desired transverse width was achieved. The appliance was retained in situ for 3 months to stabilize the expansion.
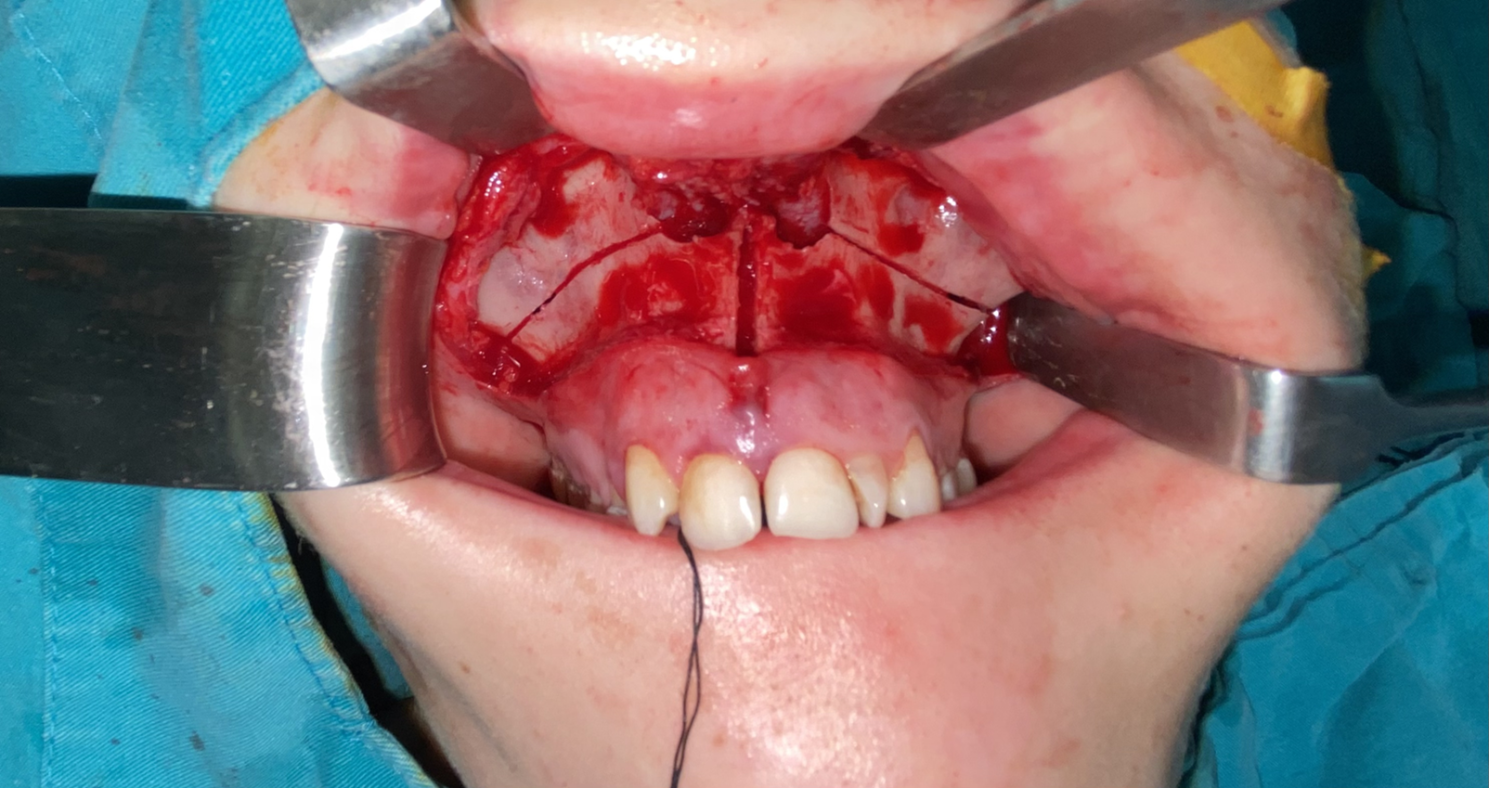
SARME protocolThe operations were performed under general anesthesia. A horizontal incision was made with a number 15 scalpel approximately 5 mm above the mucogingival junction, covering the right and left first molars of the maxilla. The mucoperiosteal flap was elevated upwards, and the apertura piriformis, anterior nasal spine, nasal cavity, infraorbital foramen, zygomaticomaxillary junction, and the tuberosity and pterygomaxillary junction were made completely visible with the help of subperiosteal dissection in the posterior region. After adequate dissection and removal of the soft tissue, an osteotomy was performed at least 5 mm apical to the tooth roots and approximately 10°-15° to the occlusal plane. This procedure was performed in a region starting from the edge of the piriformis aperture, covering the anterior lateral nasal wall, the lateral wall of the maxillary sinus, and the zygomaticomaxillary resistance zone, extending to the pterygomaxillary junction. After the completion of the lateral wall osteotomies, a vertical osteotomy was performed using piezoelectric surgery, starting from the anterior nasal spine level and extending between the central tooth roots, along the MPS. Care was taken not to damage the tooth roots during the procedure. The osteotomy line was carefully deepened with the help of an osteotome and a hammer, and depth control was provided by palpating the palatal surface of the premaxilla with the index finger of one hand. In continuation of this procedure, an osteotomy was performed using a chisel and the MPS was divided (Fig. 1). Afterwards, the incision lines were closed with 4.0 vicryl after bleeding control.
Fig. 1
This figure illustrates the post-operative lateral osteotomy areas following SARME. The highlighted regions include key anatomical landmarks such as the anterior nasal spine and zygomaticomaxillary junction, demonstrating the extent of surgical intervention
After the latent period, the hyrax screws of the expansion devices were activated 2 turns per day (0.25 mm per turn). After the desired expansion was achieved, the expansion was terminated and the device was kept in the mouth for retention.
The patients included in our study were divided into two groups as SARME group and RME group. Low-dose CBCT images were obtained from the patients preoperatively (T0) and at 3 months after retention (T1). The CBCT images were obtained in standingposition by using CBCT machine. FA evaluations were performed on CBCT routinely requested from patients before and after treatment.
Outcome measuresPrimary outcomeChanges in MPS density and complexity were evaluated using FA. FA was conducted on CBCT images using the ImageJ software, following the protocol established by White and Rudolph [21].
CBCT acquisitionImages were obtained using a Planmeca Promax 3D mid (Helsinki, Finland) CBCT machine. Axial sections with a thickness of 0.3 mm were analyzed.
Fractal analysisFractal analysis was performed using the image J program. Image J is an open source, Java-based image processing and analysis software developed by the National Institutes of Health (NIH). ImageJ has a comprehensive toolkit for processing 2D and 3D images, which is why it is widely used in medical and scientific research. The program can process various image formats, apply filters, perform measurements, and perform advanced mathematical calculations. It can be downloaded for free from https://imagej.nih.gov.
To measure the structural complexity of the mid-palatal suture, a mathematical method called box-counting was used. This method analyzes how many boxes “fill” the complex pattern in an image by overlaying it with a grid of squares (or boxes) of different sizes. In this way, it becomes possible to numerically measure the complexity of the shape and the density of detail.
On axial sections, a 20 × 100 pixel rectangular ROI (Region of Interest) was selected parallel to the long axis of the midpalatal suture, encompassing the bone tissue where the midpalatal suture was visualized (Fig. 2). Image preparation for fractal analysis followed the protocol established by White and Rudolph [21]. While preparing the image for fractal analysis, there is a stage where the differences between the original image and the image we will process are determined. For this reason, the ROI was duplicated (Fig. 3a). A Gaussian blur filter was applied to reduce noise in the image (Fig. 3b). To highlight the structural features of the mid-palatal suture, the blurred image was subtracted from the original ROI (Fig. 3c). 128 Gy tones were added to the image for a more controlled conversion to black and white (Fig. 3d). The processed image was converted to a binary (black and white) image (Fig. 3e). To improve this processed image, erosion was applied to remove small artifacts and then dilation was applied to highlight prominent features (Fig. 3f and g). The invert option was applied, the pixel values in the image are reversed (Fig. 3h). Skeletonization step was applied to obtain the representation of the basic contours of the midpalatal suture as lines (Fig. 3i). The skeletonized ROI was analyzed using the box-counting method, a tool in the ImageJ ‘Analysis’ menü (Fig. 4). The fractal value of the structural complexity of the midpalatal suture was obtained.
Fig. 2
The selected ROI on the MPS in CBCT axial slices is shown. This region represents the primary measurement area used for fractal analysis. The image contains a 20 × 100 pixel rectangle used as the starting point of the analysis process
Fig. 3
The image processing steps applied in ImageJ software are shown in detail. (a) Duplicated ROI, (b) Blurred image, (c) Subtracted image, (d) Added image 128 Gy values (e) Thresholded image (f) Eroded image, (g) Dilated image, (h) Inverted image, (i) Skeletonized image
Fig. 4
Fractal size calculation from processed ROI
All image analyses were conducted by the same observer. To assess intraobserver reliability, images from ten randomly chosen patients were re-evaluated after a two-week interval. Pearson correlation coefficients were calculated to evaluate the consistency of the measurements. No statistically significant differences were found between the initial and repeated measurements (p > 0.05), confirming consistent results. Intraclass Correlation Coefficient (ICC) was used for interobserver reliability. There is consistency between the measurements (p = 0.001). Retrospective design limitations, small sample size can be identified as potential bias in the study.
Statistical analysisFor the statistical analysis, the IBM SPSS Statistics Version 20 package program (IBM Corp.; Armonk, NY) was used. The Shapiro-Wilk test was used to assess the normality of data distribution for all variables. Independent t-tests were applied to compare FA values between the SARME and RME groups for normally distributed variables. The Mann-Whitney U test was used for non-normally distributed variables. The test results were considered statistically signifcant if p was < 0.05. One-way analysis of variance with covariates (UNIANOVA) was used, considering age and gender as covariates. This statistical method adjusted pre-post differences by taking into account these confounding variables.
Comments (0)