
Remember me
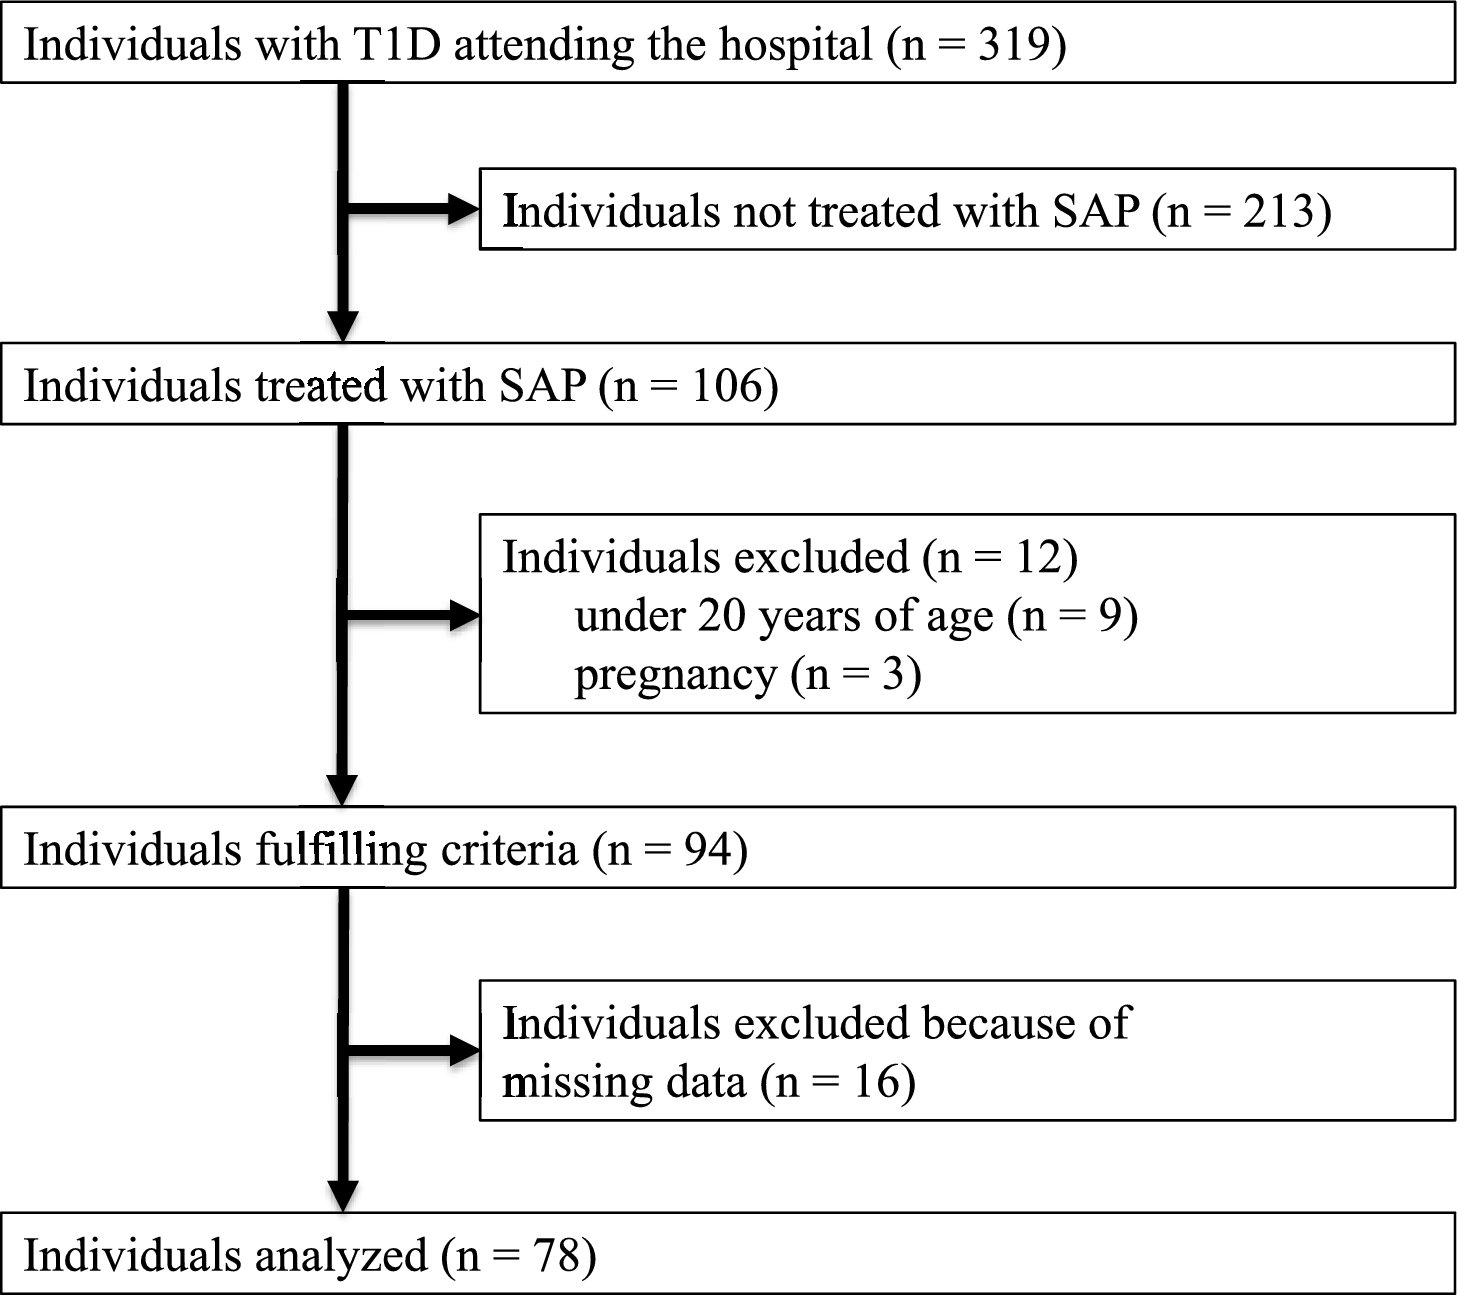
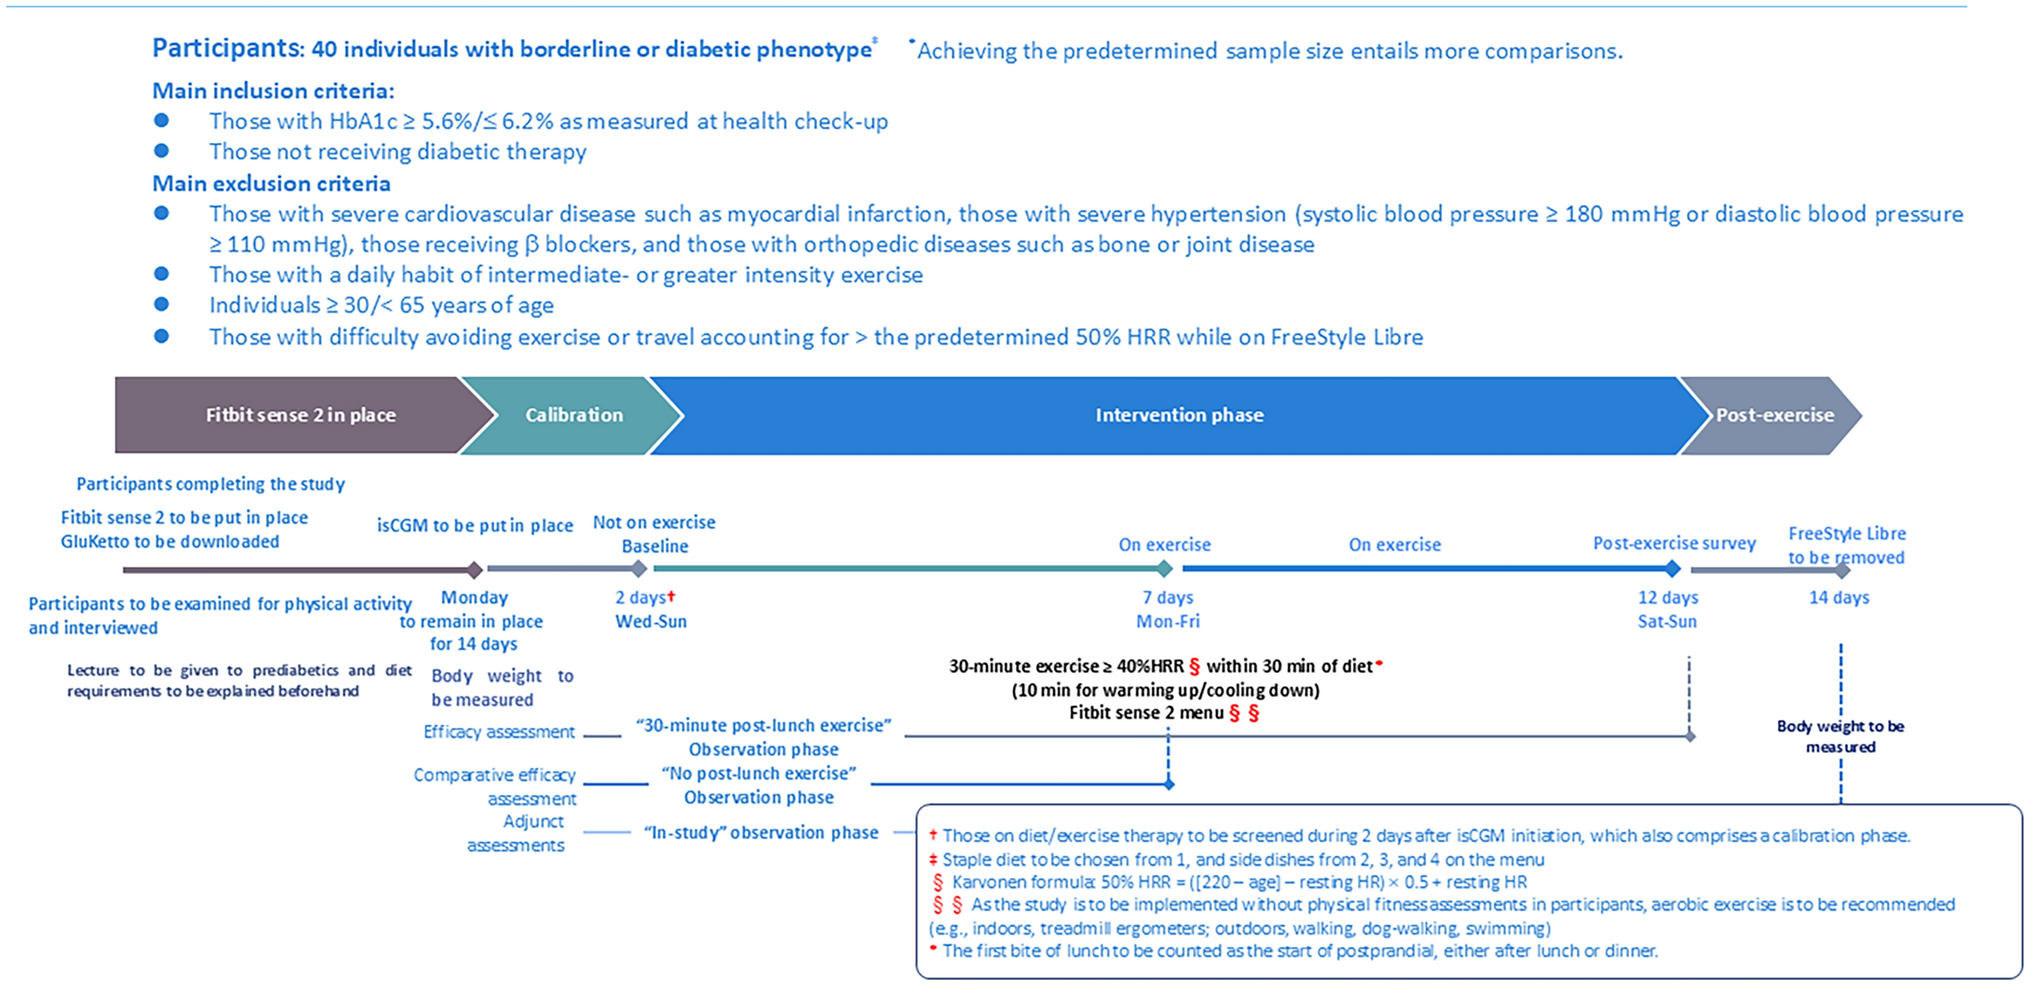
As an open-label, non-randomized, prospective interventional study (Fig. 1), the present study called for male applicants from among sedentary office workers 30 to < 65 years old at an information technology company who were regularly undergoing health checkups and who had HbA1c values ≥ 5.6%/ < 6.2%. Applicants were excluded if they met the following exclusion criteria: those with a diagnosis of diabetes, CVD, diseases of the digestive system, or conspicuous hypertension (systolic blood pressure [SBP] > 180 mmHg or diastolic blood pressure [DBP] > 110 mmHg), or skin allergies; those on β-blocker therapy; and those who had difficulty walking due to a bone/joint disease or a high degree of obesity, those who had a habit of regular high-intensity exercise, and those who had difficulty using smart phone applications. Participants were limited to males in light of the research finding that there exists a sex difference that differently affects the exercise-glucose profile relationship [11]. Again, participants were also limited to those with HbA1c values ≥ 5.6%/ < 6.2%, a lower value than that used in the diagnostic criteria for prediabetes, as the study aimed primarily to improve postprandial hyperglycemia, which is known to precede fasting hyperglycemia.
Fig. 1
Prior to the study, the latest relevant data available from their health checkups (i.e., height, body weight, body mass index [BMI] and HbA1c values) were retrieved for use with the approval of each applicant. All applicants were also assessed for their physical activity and dietary intake status prior to the study using the Japanese versions of the Global Physical Activity Questionnaire (GPAQ) and the Food Frequency Questionnaire (FFQ).
During the study, a physical activity tracker (Fitbit sense 2; San Francisco, CA, USA) was used to help the participants achieve and maintain their target physical activity intensity during the study-designated exercise; a dietary guidance application (CAReNA; NSD Co., Ltd., Japan) was also used to monitor their dietary intake during the study [12]. At the same time, a continuous glucose monitoring (CGM) device (FreeStyle Libre; Abbott Diabetes Care, Witney, UK) was used to record their glucose values throughout the study.
Study design and assessmentsThe study was designed to consist of 5 consecutive phases: a 1 week “familiarization” phase intended to help familiarize the participants with the use of Fitbit sense 2 and CAReNA; a 2 day calibration phase following initiation of CGM to allow its accuracy to be stabilized; a 5 day control phase involving no exercise; a 5 day exercise phase involving exercise; and a 2 day back-up phase. All necessary equipment and devices were handed over or sent by post to the participants beforehand, who were then instructed on their use on a face-to-face or online basis.
During the “familiarization” phase, all participants started wearing Fitbit sense 2 on day 1 with its software downloaded for use soon afterward to start recording their heart rates (HR); they also downloaded CAReNA onto their own smart phones and formulated such lunch meal plans as would minimize their day-to-day glucose variability (GV); it was also ensured that they grew used to how to photograph and record their lunch meals. They were also instructed to avoid exercise of greater intensity than usual during the control phase.
During the control phase all participants were assessed for their HR using Fitbit sense 2 without exercise; during the exercise phase that immediately followed, they were subjected to a regimen of 30 min walking within 30 min post-lunch. It was ensured that those who had difficulty implementing the regimen as planned during the exercise phase go on to implement it during the back-up phase that followed. They were also assessed for their glucose values during both phases using FreeStyle Libre. After completion of the study, their Fitbit sense 2-derived data were collected using its software, their glucose data collected from the FreeStyle Libre devices retrieved, and all their dietary records collected from CAReNA, for analysis.
Primary endpointsThe primary endpoints of the study were the hourly area under the glucose curve (AUC) and proportion of time spent in tight glucose range (%TITR), as well as the cumulative AUC and %TITR values, during a 4 h period after the start of lunch. Rates of change in median glucose curves (RCMC) were also assessed.
Physical activity targets and monitoringParticipants were instructed to wear Fitbit sense 2 (which is reported to provide excellent measurement accuracy as a physical activity tracker [13, 14]) on their wrist at all times except charging times to record their HR. The 30 min, intermediate-intensity exercise to be implemented during the exercise phase was defined as walking with the HR target ranging between 40 and 60% of maximum HR and with the walking pace adjusted to ensure that the participants remained within the target HR zone at all times, taking clues from the Fitbit sense 2 display screen while walking. The target HR zone was determined using the following Karvonen formula based on resting HR, known as the heart rate reserve (HRR) formula [15, 16]: target HRR = (220–age [years]–resting HR [bpm]) × intensity (0.4–0.6) + resting HR (bpm).
Continuous glucose monitoringParticipants were instructed to start wearing FreeStyle Libre on the back of their upper arm 2 days before the control phase with the device reader scans repeated at 8-h intervals and their subcutaneous glucose values recorded every 15 min for 14 days. In this, it was ensured that the participants were blinded to glucose readings displayed on the device screen, given that visual recognition of their real-time glucose values might prompt them to increase the amount of their exercise or decrease their dietary intake in an effort to further lower their glucose values, given the observation that not only 47% of individuals initiated on real-time CGM (rtCGM) increased the amount of their exercise but also 87% changed their dietary intake [17]. Again, given that FreeStyle Libre was reported to be associated with suboptimal accuracy on day 1 of its use [18, 19], day 3 of its use was defined as day 1 of the control phase.
Dietary managementAs postprandial glucose values are reported to vary widely depending on the diet [20], lunch meal plans for the participants were so designed as to ensure through guidance that their energy intake from lunch, as well as its nutritional composition, remained as constant and consistent as possible throughout the study. The lunch meals taken were recorded (i.e., not only photographed but entered on to the dietary management application) by the participants throughout the study; after completion of the study, the resulting meal records were used by the study-designated dietitians to calculate the energy taken by the participants from lunch, as well as its composition, i.e., amounts of proteins (P), fat (F) and carbohydrates (C), during the control and exercise phases. In dietary management, the participants were also encouraged not to drink alcohol, as a rule, but to drink a consistent amount if they would.
Statistical analysisOf the measured glucose values, those measured at time points closest to those marked as “start of lunch” on CAReNA by the participants were defined as postprandial 0 min values, and glucose values available every 15 min thereafter up to 240 min were used for analysis. With the 0 min glucose values as reference, their areas under the glucose curves (AUC) were calculated by subtracting the upper areas from the lower areas of their glucose curves for postprandial 0–1, 1–2, 2–3, and 3–4 h. %TITR values were calculated as proportions (%) of time spent in the target 70–140 mg/dL glucose range for every postprandial 60 min. The rationale for the use of %TITR was that it was deemed preferable that the participants, i.e., those with prediabetes, remain in the 70–140 mg/dL range and that, of the CGM-derived metrics, %TITR, a more rigorous metric than the rest, was recommended for CGM-based evaluations [21]. Again, with the postprandial 0-min values as reference, the rate of change in median glucose curves (RCMC) was defined as a mean of absolute values measured every 15 min during postprandial 0–1, 1–2, 2–3, and 3–4 h.
Resting HR was calculated as a mean of HR values displayed during sleep on Fitbit sense 2 for both control and exercise phases. Consistently with the glucose measurements, postprandial HR was calculated as a mean of HR values measured every 15 min until 60 min after the start of lunch in both control and exercise phases. Likewise, maximum HR was calculated as a mean of maximum HR values measured after the start of lunch until postprandial 240 min from among those measured every 15 min after the start of lunch for both the control and exercise phases. Exercise intensity was calculated as a mean of HRR values measured during a 30 min period after an increase was noted in HRR following the start of exercise.
All collected data were analyzed using Python 3.10.11, and comma-separated value (CSV)-formatted data/table manipulation, and data reduction were performed using Pandas 2.2.2. All analyses were tested for significance using Scipy 1.14.0, with the results assessed for normality using the Shapiro–Wilk test, and where the variables were found to be non-normally distributed, they were tested using the Mann–Whitney U test, with a P value of < 0.05 construed as indicating statistical significance.
Comments (0)