Study subjects
This work was conducted within the framework of the CORDIOPREV study. The rationale, methods, and baseline characteristics have been reported by Delgado-Lista et al. [14, 15] and provided in Clinicaltrials.gov (NTC00924937). The CORDIOPREV study is an ongoing prospective, randomized, single-blind, controlled dietary intervention trial in 1002 patients with coronary heart disease, at high cardiovascular risk. The inclusion/exclusion criteria have been described in detail elsewhere [15]. Briefly, the inclusion criteria were: patients with acute coronary syndrome (unstable angina, acute myocardial infarction) and high-risk chronic CHD according to the following criteria: (A) acute myocardial infarction; (B) unstable angina; and (C) chronic high-risk ischemic heart disease. The exclusion criteria were: (a) patients <20 years of age or >75 years old, or with a life expectancy <5 years; (b) severe heart failure, NYHA functional class III or IV, with the exception of self-limited episodes of acute heart failure at the time of the acute ischemic event; (c) severe left ventricular systolic dysfunction (with ejection fraction ≤35%); (d) patients with restricted capacity to follow the protocol: those unable to follow the prescribed diet for whatever reason, due to personal or family circumstances; (e) risk factors which are severe or difficult to control (such as hypertension and diabetes, where there is organ involvement that limits their survival, chronic renal failure and disabling clinical manifestations of cerebral atherosclerosis); (f) chronic diseases unrelated to coronary risk; and (g) participants in other studies.
The subjects were randomized into two different dietary models (Mediterranean and low-fat diets) during a median follow-up of 7 years. Written consent was obtained from all the subjects before recruitment and the study protocol and all amendments were approved by the Ethics Committee of Hospital Reina Sofia, following the Helsinki Declaration and good clinical practices.
The present study (CORDIOPREV-DIRECT) included all the newly diagnosed T2DM patients who had not been receiving glucose-lowering treatment at the beginning of the study (190 out of 1002 patients). Of these, 7 patients were excluded due to their inability to perform the diagnostic test used in this work. T2DM remission was evaluated in the remaining 183 patients during the 5-year follow-up period. Moreover, 3 participants died during the follow-up period without achieving diabetes remission. The 183 newly diagnosed T2DM patients were classified as Responders, patients who reverted from T2DM during a median of 60 months of the dietary intervention without the use of diabetes medication (n = 73); or Non-Responders, who did not achieve diabetes remission at the end of the follow-up period (n = 110). T2DM remission was defined as glycosylated hemoglobin <6.5%, fasting plasma glucose <126 mg/dL and 2 h plasma glucose after an oral glucose tolerance (OGTT) test <200 mg/dL, for at least 2 consecutive years, and without the use of diabetes medication to lower blood glucose levels [16].
Diet, dietary assessment, and follow-up visits
The enrolled patients were randomized in two different dietary patterns with well-known metabolic health effects: a Med diet rich in fat from olive oil, with 35% of the calories from fat (22% monounsaturated, 6% polyunsaturated, <10% saturated), and a maximum of 50% carbohydrates and 15% protein; and the low-fat, high-complex carbohydrate diet (LFHCC) recommended by the National Cholesterol Education Program and the American Heart Association, comprising <30% total fat (<10% saturated fat, 12–14% MUFA fat, and 6–8% PUFA fat), 15% protein, and a minimum of 55% carbohydrates. The follow-up visits and dietary adherence in the CORDIOPREV study have been reported previously by Quintana-Navarro et al. [17]. During the study, dieticians administered personalized individual face-to-face interviews at inclusion and every 6 months (Food Frequency Questionnaire (FFQ), Mediterranean Diet Adherence Screener (MEDAS) [18] to assess Med diet adherence, or used a 9-item dietary screener for the low-fat diet to assess low-fat diet adherence [19], among other variables). Additionally, 2-h group sessions were held every 3–4 months to reinforce the dietary recommendations and to deliver the resource materials. Finally, a bimonthly telephone follow-up was conducted in order to monitor compliance with the assigned diet, negotiate nutrition goals, and reinforce the dietary recommendations. Full study diets, dietary assessments, and follow-up visits have been reported previously [15].
Biochemical measurements of metabolic parameters
Venous blood from the participants was collected in tubes containing Ethylenediaminetetraacetic acid (EDTA) as an anticoagulant after a 12-h overnight fast. Lipid variables (HDL-c, LDL-c, and triglycerides), glucose homeostasis variables (glucose, insulin, and glycosylated hemoglobin (HbA1c)), and inflammatory variables (hs-CRP) were determined, as previously reported [12].
Oral glucose tolerance test
The oral glucose tolerance test (OGTT) has been reported previously [12, 20]. In summary, patients underwent a standard Matsuda test at baseline and year-to-year during the follow-up period. After an overnight fast, blood was sampled from a vein before the oral glucose intake (0 min) and again after a 75 g flavored glucose load (75 g dextrose monohydrate in 250 mL water, NUTER. TEC GLUCOSA 50). Blood samples were taken at 30, 60, 90, and 120 min to determine glucose and insulin concentrations [21].
Isolation of circulating miRNAs from plasma samples
Venous blood from the 183 newly-diagnosed T2DM patients who had not been receiving glucose-lowering treatment at the beginning of the study was collected at baseline (day 0 before dietary intervention) in tubes containing EDTA, and centrifuged at 2000×g for 10 min to separate the plasma from the blood cells. RNA isolation was carried out from plasma samples, as previously described by Jimenez-Lucena et al. [12].
cDNA synthesis and circulating miRNAs levels using real-time PCR
The cDNA synthesis was carried out using the TaqMan MicroRNA Reverse Transcription Kit (Life Technologies—Thermofisher Scientific, Carlsbad, CA, USA), following the manufacturer’s instructions, as previously described in our group by Jimenez-Lucena et al. [12].
The circulating miRNAs study was carried out on 56 miRNAs, of which our group had previously studied 28 in a population of non-diabetic patients [12, 22]. The remaining 28 miRNAs were selected based on a bibliographic search according to their association with insulin sensitivity, insulin secretion, inflammation, and the growth and proliferation of beta-cells (Supplementary Table 1). We measured the levels of miRNAs at the baseline of the CORDIOPREV study using the OpenArray® platform (Life Technologies—Thermofisher Scientific, Carlsbad, CA, USA), following the manufacturer’s instructions. The relative expression data were analyzed using OpenArray® Real-Time qPCR Analysis Software (Life Technologies—Thermofisher Scientific, Carlsbad, CA, USA) and the normalization method has been described previously [16].
Statistics
The differences between Responders and Non-Responders in the study population baseline characteristics were assessed using One-way ANOVA analysis. To analyze the interaction between diet and groups, an analysis of the baseline characteristics of the participants was carried out using a univariate general linear model.
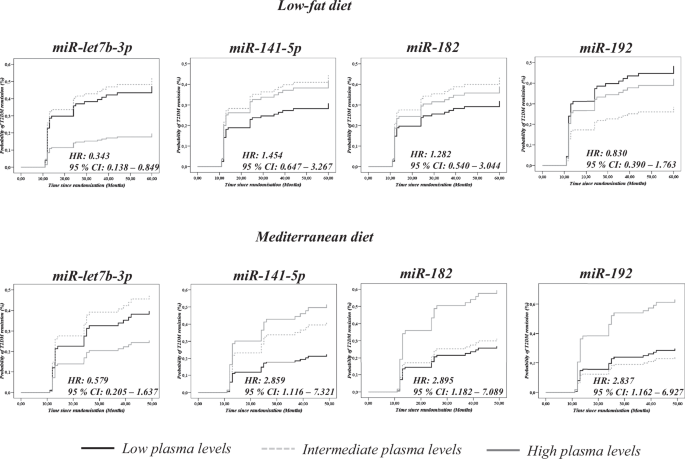
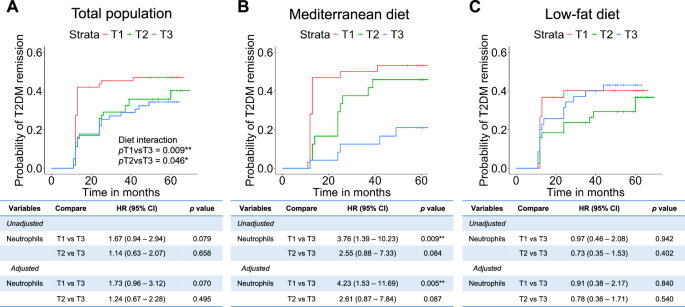
In addition, the 183 patients included in our study were classified according to the tertiles (T1 = low levels, T2 = intermediate levels and T3 = high levels) of circulating levels of 45 miRNAs and then COX regression analyses were performed for each miRNA separately for each diet, where T1 was considered as the reference. We also assessed the hazard ratio (HR) between T3 and T1, with 95% CI.
To evaluate the differences in circulating levels of miRNAs between Responders and Non-Responders according to the diet consumed by the patients, a One-Way ANOVA analysis was performed separately by diet. p Values < 0.05 were considered statistically significant. These analyses were performed using SPSS software (now PASW Statistic for Windows, version 21) (IBM, Chicago, IL, USA).
In addition, clinical variables (BMI, Age, HDL-c, triglycerides) and miRNA data were transformed (centering and scaling) using the preProcess function from the caret package through the free statistical software “R” version 3.6.1. This function uses two methods for the normalization and transformation of the variables included in the models. Thus, the method = "center" subtracts the mean of each variable from each absolute value of the variable, while the method = "scale" divides each value of the variable by its standard deviation. Next, ROC curve analyses were carried out in two steps, first through the glm (General lineal model) function, which is used to fit generalized linear models and gives a symbolic description of the linear predictor and a description of the error distribution [23]. Next, we performed the ROC curve using the pROC library. pROC is a tool for visualizing, smoothing, and comparing ROC curves. The AUC can be compared with a statistical test based on U statistics or bootstrap analysis. After the analysis, we evaluated the AUC, sensitivity, specificity, accuracy and threshold values for each model built. The most significant variables were identified by Pr(>|z|) values < 0.05, registered in the summary of each glm analysis.
T2DM scores based on miRNAs added to clinical variables
In the present study, based on miRNAs and clinical variables, T2DM remission scores were calculated with the aim of selecting a dietary model (Med or low-fat diets) that promotes disease remission. To this end, we calculated the score in three steps. First, we performed a glm analysis using the R software, including four miRNAs and six clinical variables, and we assessed the z value of each variable in the summary analysis separately for both the Med and low-fat diets (Supplementary Tables 2 and 3). Next, we multiplied the z value of each variable by the absolute values of the variables in all the patients included in the study. Third, the miRNAs and clinical variables were added together to obtain a single score per subject. To evaluate the probability of T2DM remission based on scores, the 183 patients included in our study were classified according to the tertiles of the T2DM remission score for both the Med and low-fat diets (T1, low score; T2, intermediate score; T3, high score). Using the SPSS software (now PASW Statistic for Windows, version 21) (IBM, Chicago, IL, USA), we performed a Cox regression analysis for each diet assessing the hazard ratio (HR), with T1 as the reference.
Optimal cut-off points for T2DM remission score by diet
To identify the cut-off points that allow us to select a dietary model that promotes remission using the scores, a ROC analysis was initially carried out. Next, we obtained the coordinates of the curve for each score (T2DM remission score for the low-fat diet and T2DM remission score for the Mediterranean diet). After that, the Youden index was calculated according to the equation (sensitivity + specificity) − 1 [24]. The Youden index was then plotted against the score values for both the Med and low-fat diets. We identified the maximum value of the Youden index with its respective score value, which was considered as the cut-off point.


Comments (0)