Study design and participants
The current study was conducted as part of the CORDIOPREV study (https://clinicaltrials.gov/study/NCT00924937?cond=NCT00924937&rank=1 and the number of registrations was NCT00924937). The CORDIOPREV study is a randomized, single-blinded, controlled dietary intervention trial that involved 1002 patients with CHD, in which they were recruited between July 2009 and February 2012. The CHD patients had experienced a coronary event more than six months prior to their enrollment. Furthermore, they were assigned to follow dietary intervention for seven years, in addition to receiving conventional treatment for CHD. Dietary intervention was assigned to follow two different dietary models, consisting in a low-fat diet and a Mediterranean diet. The study’s rationale, methodology, and baseline characteristics of the participants as well other findings regarding to the main outcome of this study have been previously detailed [13]. The study protocol was developed in accordance with the principles outlined in the Declaration of Helsinki and was approved by the Institutional Review Board of the Reina Sofia University Hospital in Córdoba, Spain. All participants provided written informed consent prior participating in the study.
Criteria selection for type 2 diabetes mellitus remission
Within the CORDIOPREV study, patients who had been diagnosed with T2DM at the outset of the research and were not undergoing antidiabetic treatment were included. The diabetes diagnosis adhered to the criteria established by the American Diabetes Association (ADA) [14]. These criteria involved fasting glucose levels of 126 mg/dL or higher, 2-h glucose levels during an oral glucose tolerance test (OGTT) of 200 mg/dL or higher, or an HbA1c level of 6.5% or higher [15]. T2DM remission was defined as achieving and maintaining specific blood sugar levels for at least two consecutive years without the use of diabetes medication, according to the International Experts outline of T2DM Remission criteria of ADA. These target levels included HbA1c < 6.5%, fasting plasma glucose < 126 mg/dL, and a 2-h plasma glucose level of less than 200 mg/dL following a 75 × g OGTT. Patients were monitored annually starting from the first year of follow-up, and their status as either in remission or still managing diabetes was determined at the fifth year of the study [7].
Patients who had diabetes diagnosed at the beginning of the study and were not receiving glucose-lowering treatment were included in the CORDIOPREV-DIRECT study (190 out of 1002 patients). Of these, 7 patients could not be included due to their inability to perform the diagnostic test used in this work. Thus, the remaining 183 in which had T2DM at baseline and whom accomplished inclusion criteria, were included in the study. After 5-year of follow, 73 of them remitted from T2DM without the administration of diabetes medications, in which they were known as Responders. Meanwhile, Non-responders were patients who did no remitted from diabetes, during the follow-up period (N = 110). Data at the 5-year follow-up were unavailable for 7 patients due to their inability to undergo the diagnostic tests. Five of these patients passed away, and two abandoned the dietary intervention and did not permit clinical follow-up via electronic health records. Consequently, the analysis of follow-up included data from 176 patients.
Dietary intervention
Participants were randomly assigned to follow one of two diets within the CORDIOPREV design: a Mediterranean diet [less than 10% calories from saturated fat, 22% from monounsaturated fat (MUFA), 6% from polyunsaturated fat (PUFA) (a minimum of 35% of calories from fat), along with 15% protein, and a maximum of 50% carbohydrates], or a low-fat diet [less than 10% calories from saturated fat, 12–14% from MUFA, 6–8% from PUFA ( <30% of calories from fat), along with 15% protein, and a minimum of 55% carbohydrates]. In both diets, the cholesterol content was adjusted to <300 mg/day. Both study diets included foods from all major food groups, but no total calorie restriction was set. No intervention to increase physical activity or lose weight was included.
Full details on dietary assessment and follow-up visits have been published elsewhere [16]. Briefly, participants in both intervention groups received the same intensive dietary counseling. Nutritionists carried out individual interviews at baseline and every 6 months, and quarterly group education sessions were held with up to 20 participants per session and separate sessions for each group. The present study was conducted over a follow-up period of 5 years. Details of the specific recommended diets, mean baseline values and changes in energy and nutrient intake after 5 years of intervention with both dietary patterns have been previously described. In our study, although both dietary models share common characteristics in some of the major components (i.e., high intake of vegetables, fruit, legumes, and whole grains), patients consuming the Mediterranean diet also had a high intake of oily fish, nuts, and extra virgin olive oil, together with a low intake of harmful foods such as red/processed meats and pastries/commercial bakery products.
Laboratory measurements
Anthropometric parameters were obtained using BF511 body composition analyzer/scale, (OMROM, Japan) and a wall-mounted stadiometer (Seca 242, HealthCheck Systems, Brooklyn, NY). Blood samples were obtained from all the participants after overnight fasting. Serum samples were extracted from blood samples by centrifugation at 7.000 × g for 15 min at 4 °C. We measured fasting glucose, total cholesterol, triglycerides, and high-density lipoprotein (HDL)-cholesterol levels in serum using the Dimension Autoanalyzer (Dade Behring Inc., Deerfield, IL, USA). Calculations were made for low-density lipoprotein (LDL)-cholesterol using the Friedewald formula [15]. Fasting Insulin levels in plasma were assessed using a chemiluminescent (i-2000 Abbott Architect® analyzer). Plasma concentrations of high-sensitivity C-reactive protein (hs-CRP) were determined using a high-sensitivity ELISA (BioCheck, Inc., Foster City, CA, USA). Glycosylated hemoglobin (HbA1c) was measured was determined in fresh samples, using G8 (Tosoh Corporation, Shiba-Mianto-ku, Tokyo, Japan).
Absolute count of basophils, lymphocytes, monocytes and neutrophils were measured by flow cytometry using an automated analyzer. Neutrophil-to-basophil Ratio (NBR) was calculated as absolute count of neutrophils/absolute count of basophils (This marker indicates alterations in immune function and inflammatory processes, and useful in evaluating conditions, such as autoimmune diseases). Neutrophil-to-erythrocyte Ratio (NER) = absolute count of neutrophils/absolute count of erythrocyte (this biomarker indicates alterations in the immune system and inflammatory processes, and useful in evaluating various health conditions). Neutrophil-to-HDL Ratio (NHR) = absolute count of neutrophils/absolute count of HDL (biomarker for systemic inflammation and cardiovascular status, as neutrophils are associated with inflammation, while HDL is considered a cardioprotective component). Neutrophil-to-lymphocyte ratio (NLR) = was calculated as absolute count of neutrophils/absolute count of lymphocytes (biomarker for inflammation and immune response. A higher NLR indicates an increased inflammatory response).
Oral glucose tolerance test
The patients underwent an OGTT at the beginning of the study and subsequently once a year throughout the dietary intervention. After overnight fasting, participants consumed a 75-gram flavored glucose load (Trutol 75; Custom Laboratories, Baltimore, MD, USA). After this, blood samples were collected at time intervals of 0, 30, 60, 90, and 120 min to measure glucose and insulin concentrations [17]. We used this information to calculate the homeostatic model of insulin resistance (HOMA-IR), insulin sensitivity index (ISI) and the disposition index (DI) as previously described [12]. Additionally, data for the ISI from 65 patients and the DI from 102 patients were missing because they did not complete the OGTT test at the specified time intervals.
Statistical analysis
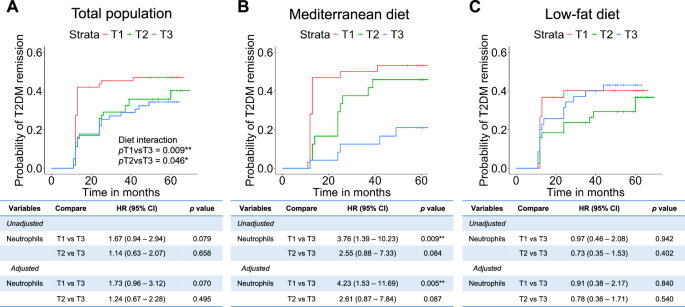
The results are presented as mean ± standard deviation (SD) for continuous variables and as numbers (percentages) for categorical variables. A Student t-test or Mann–Whitney test was applied according to the normality of the variables. For multiple comparison, we used Bonferroni–Hochberg to adjust the final p-value. Kaplan–Meier curves were used for overall survival analyses. Hazard ratio (HR) was performed using multivariate Cox proportional hazards regression for variables, using age, sex, body mass index, diet, HDL-c, triglycerides and statin treatment for the adjustment model. Interaction model was calculated by Cox regression using the adjusted variables. ROC curves of the model including the clinical and neutrophil variables. Model 1: Hb1Ac as reference. Model 2 includes age, sex, body mass index, diet, HDL, triglycerides and statin treatment, as clinical variables. Model 3 includes Model 1 and Model 2. Model 4 includes all models, plus neutrophil variables, including neutrophils, NLR, NHR, NER and NBR. Analyses and graphic representation were pointed out, performed using R v.3.5.1 software (Integrated Development for R. Rstudio, PBC, Boston, MA, USA), and the significance p value was set at p < 0.05 [18].


Comments (0)