
Remember me


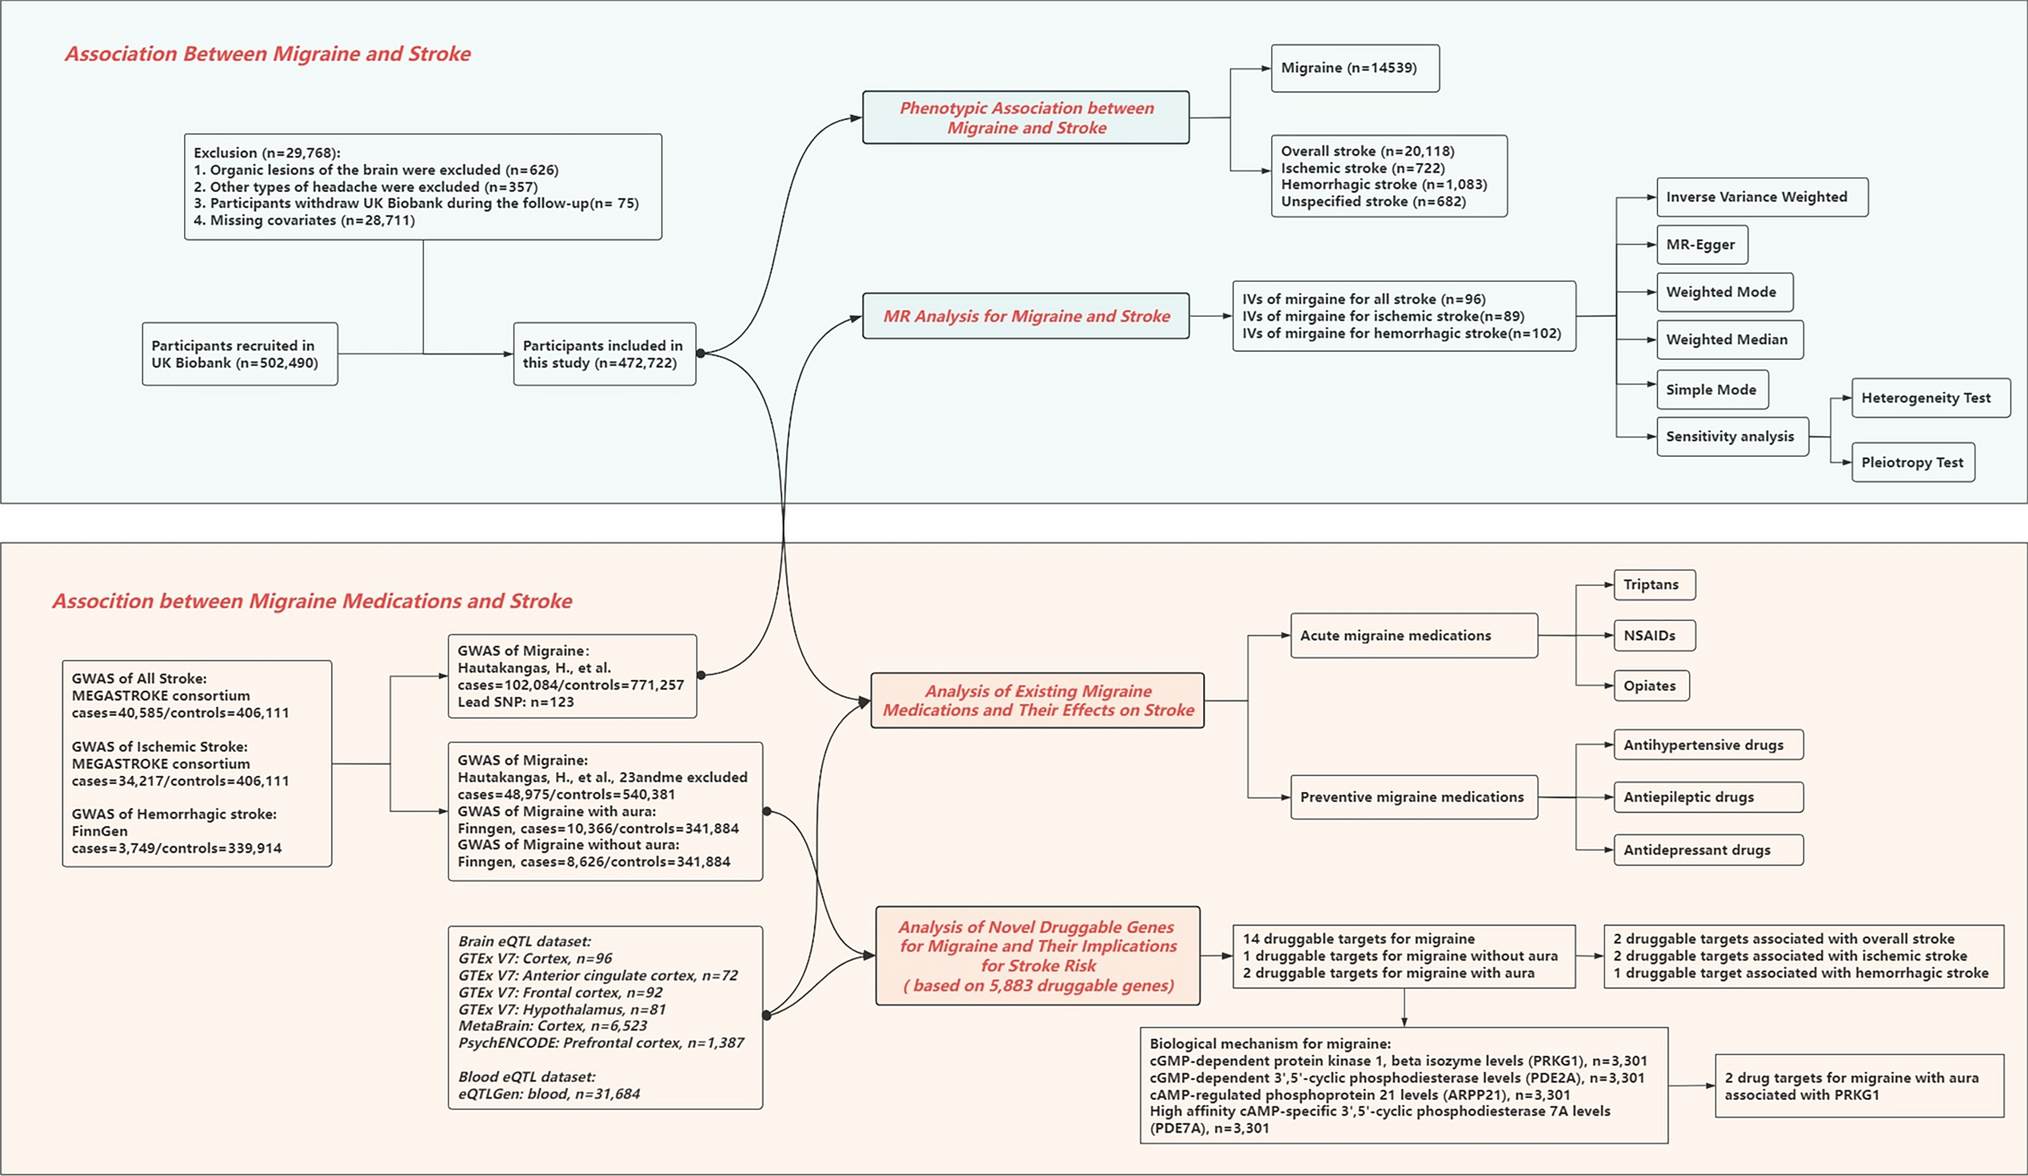

The genetic relationships between Roma individuals and other populations were assessed through Principal Component Analysis (PCA) and ADMIXTURE analyses. The plot of the first two PC components (Fig. 1b) shows that Iberian Roma, along with other European Roma groups, cluster between European and Indian populations, with minimal overlap with other groups (the first four principal components are shown in Fig. 1b and Supplementary Fig. 1). This pattern is consistent with previous genetic studies (Mendizabal et al. 2012; Ceballos et al. 2018; Font-Porterias et al. 2019; Bianco et al. 2020). The ADMIXTURE analysis at K = 4 reveals populations clustering by continental origin, with the Roma forming a distinct group, showing with two main components linked to European and South Asian populations (Supplementary Fig. 2). At the lowest cross-validation error, K = 6 (Supplementary Fig. 3), a Roma-specific component is highlighted, ranging from approximately 30–80% (Fig. 1c and S2).
Fig. 1
Genetic population structure of the European Roma groups. (a) Distribution and sample sizes of Roma populations included in the present study. (b) Principal component analysis (PCA) of all samples analysed in this study. IBS and PJL stand for Iberian Spanish and Punjabi from the 1000 Genomes Project, respectively. (c) ADMIXTURE results showing the lowest cross-validation error (K = 6)
To investigate gene flow patterns from populations encountered during the Roma diaspora, we analysed allele sharing using the outgroup f3-statistics and f4-statistics. In the f3 outgroup test, the non-Roma European populations showed the highest f3 values (Supplementary Fig. 4a-c), followed by West Asian and South Asian groups, with African populations showing the least affinity, irrespective of the Roma subgroup (Supplementary Fig. 4a-c). The f4 tests showed that Roma are genetically closer to European groups than to South Asian ones (Supplementary Fig. 5). Among European groups, Iberian Roma were more closely related to the Basques (Supplementary Fig. 6a), while Czech Roma were genetically closer to Central Europeans (CEU) (Supplementary Fig. 6a). When examining proximity to South Asian groups, both Iberian and Czech Roma showed divergence from southern and western Indian populations (STU, BEB, ITU) and closer genetic affinity with Pakistani and northwestern Indian groups (Supplementary Fig. 6b), supporting the hypothesis of a Punjabi origin of the Roma diaspora (Mendizabal et al. 2011; Pamjav et al. 2011; Rai et al. 2012; Martínez-Cruz et al. 2016).
We further explored the genetic relatedness among populations using FineStructure analysis, which examines haplotype similarities. This analysis revealed that most Roma individuals cluster within a single macrobranch, with the exception of two Iberian individuals clustering with non-Roma Iberians (IBS) and one Hungarian Vlax individual clustering with the general Hungarian population. These Roma individuals were not included in further dating analyses to avoid estimation biases (Supplementary Fig. 7a-c). Within the Roma macrobranch, a geographical structure emerged, with distinct clusters for Iberian, Czech, and Macedonian Roma, while other European Roma clustered together, likely due to their small sample sizes (Supplementary Fig. 7a-c). For subsequent analyses, we grouped all Iberian Roma samples into one Recipient cluster (IberianRoma) and all other European Roma samples into another Recipient cluster (EuropeanRoma).
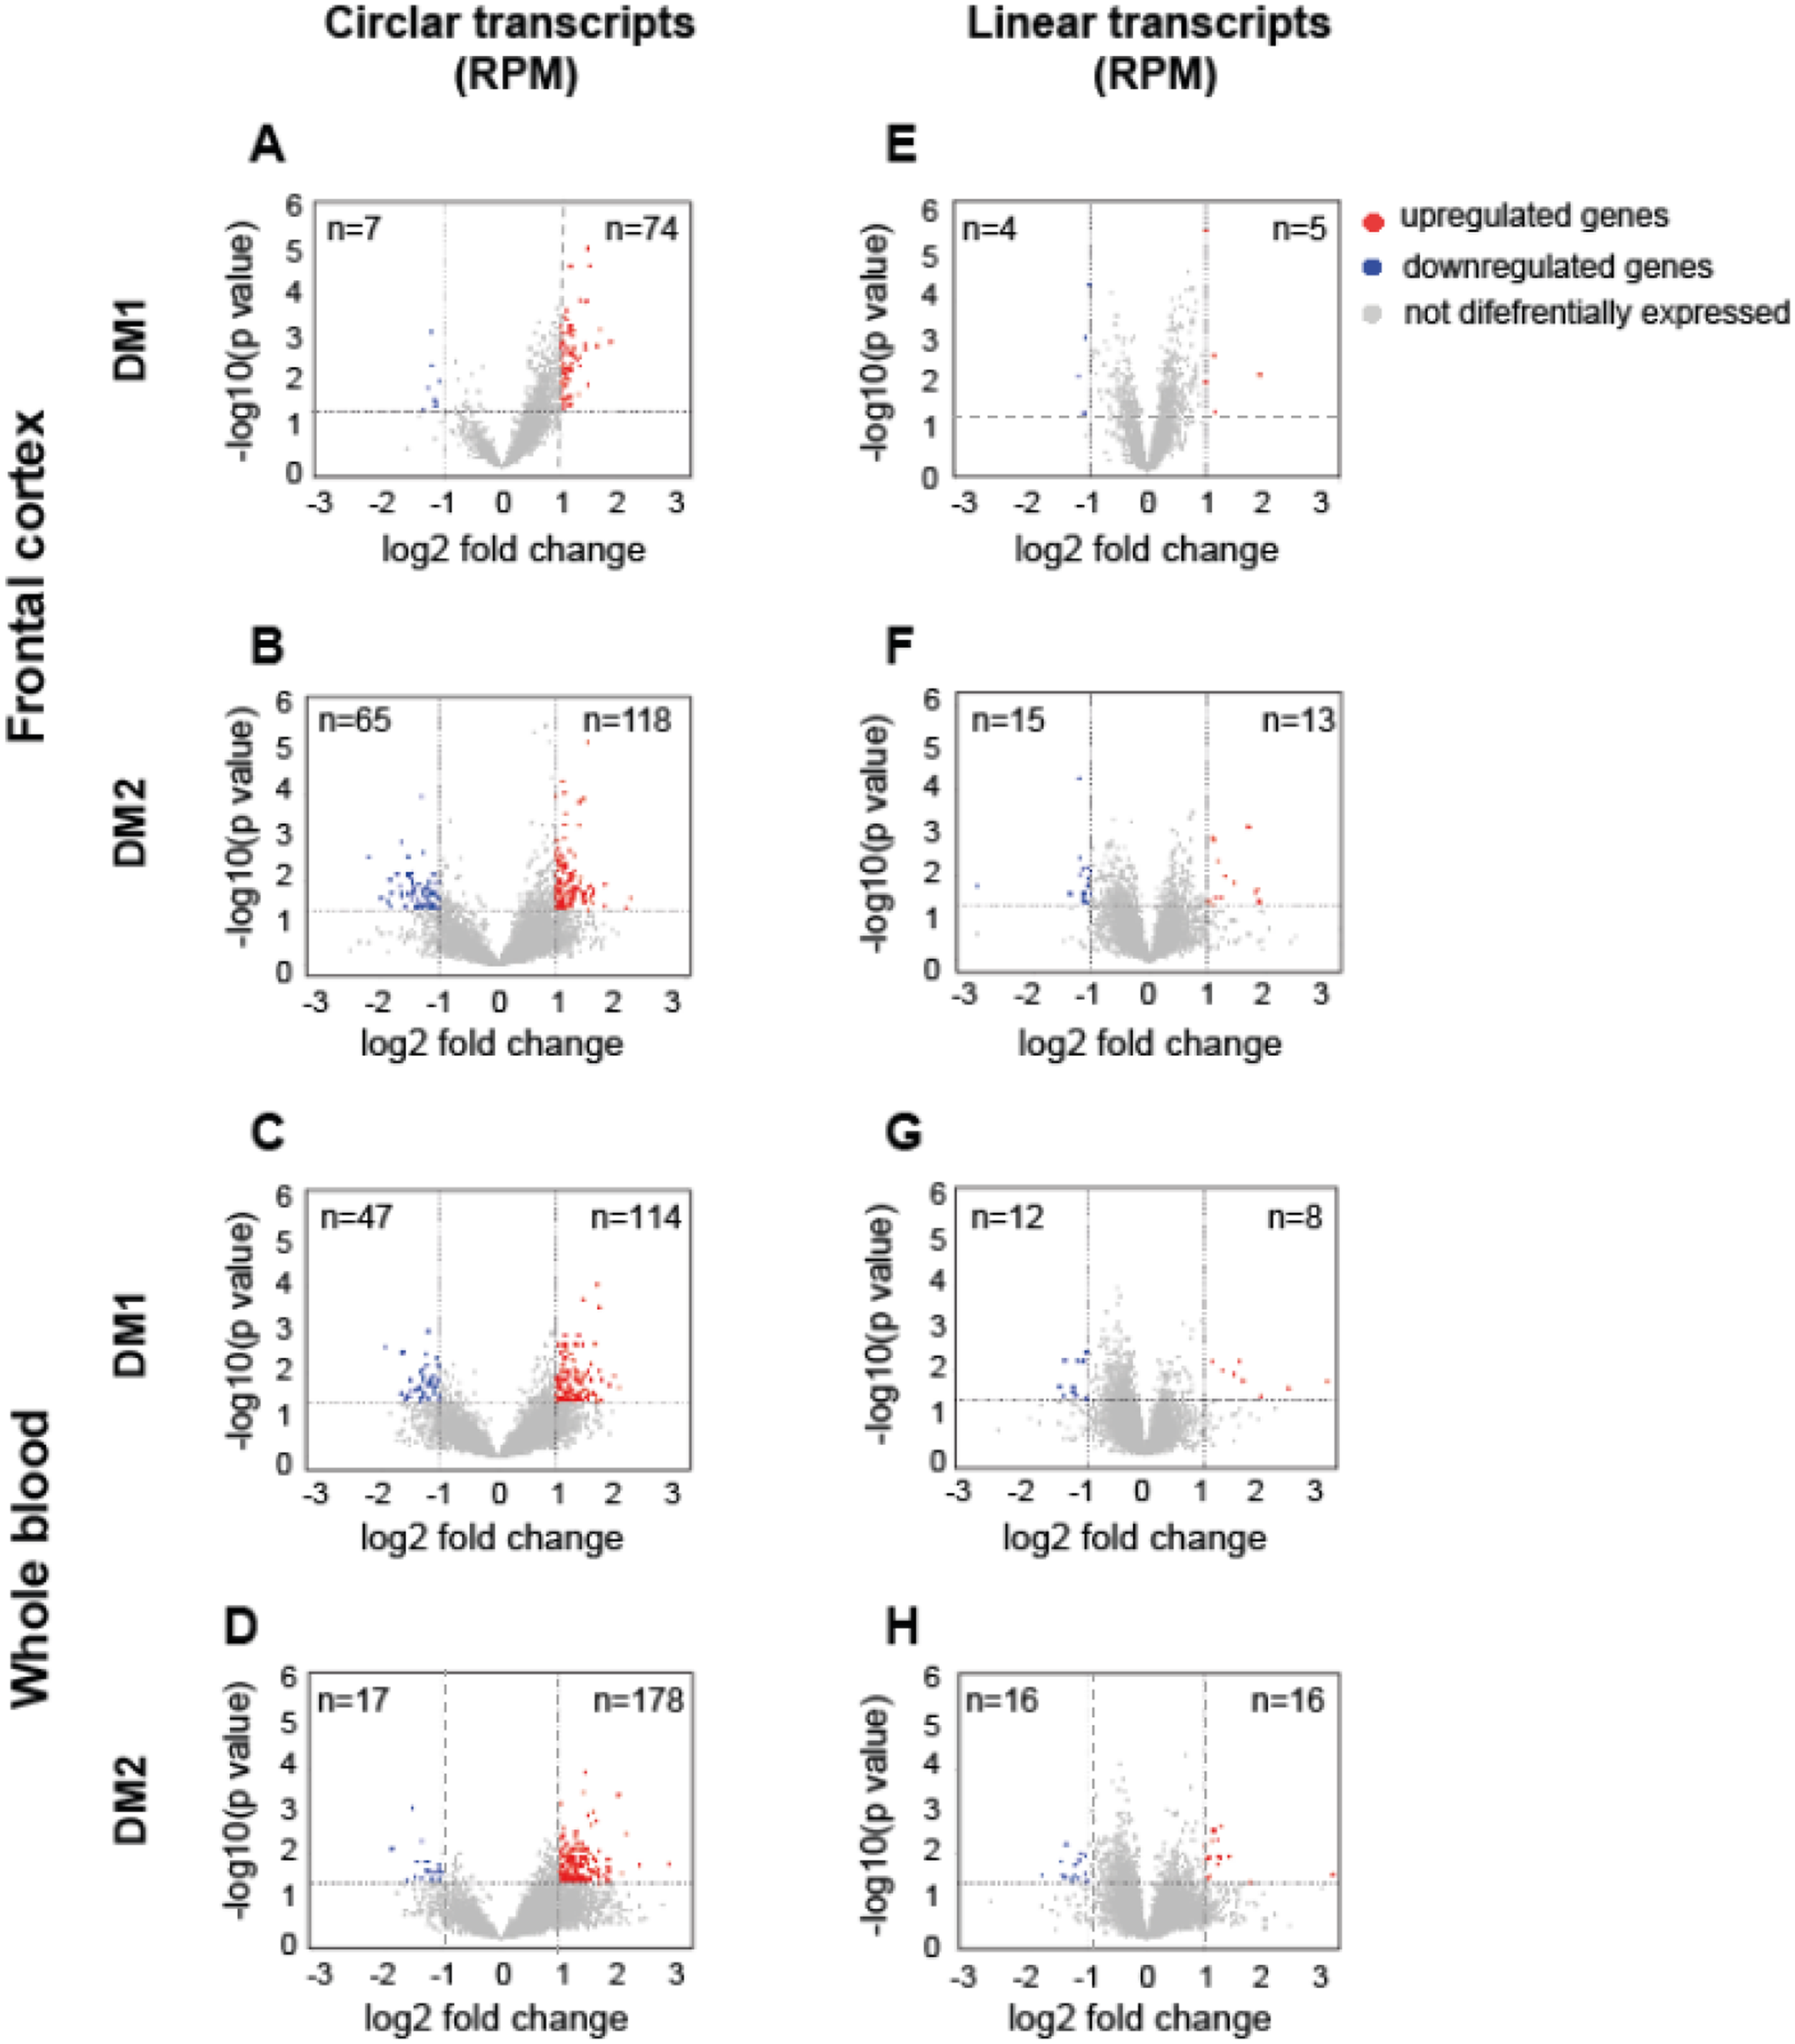
Ancestry profiles derived from NNLS analysis showed that Roma individuals primarily shared haplotypes with European clusters, particularly Balkan and CentralEurope, followed by West and South Asian clusters, though the order varied (Supplementary Fig. 8). Minor components included other populations with negligible contributions. To simplify the interpretation of the NNLS results, we grouped the Donor clusters (Supplementary Table 1a) into 14 geographical macro-regions. Both Roma clusters show similar Donor compositions, although Iberian Roma showed a higher non-Roma Iberian ancestry and traces of southern European and North African ancestry, which were absent in other European Roma groups (Fig. 2a). We further divided the Iberian Roma in five subclusters and the European Roma in three subclusters (Supplementary Table 1b) for finer-scale analysis. Among the Iberian Roma subclusters, the European component ranged from 42 to 70%, while the South Asian component varied from 13 to 27%. Notably, the IberianRomaSouthEast subcluster exhibited the highest European and lowest South Asian percentages, with the other subclusters displaying more similar percentages (Supplementary Fig. 9a-b).
Fig. 2
Ancestry proportions in Roma and geographic correlations. (a) Inferred proportions of shared ancestry among Iberian (N = 93) and European Roma (N = 49) clusters using the NNLS method. Roma individuals that clustered outside the Roma branch in the FineStructure dendrogram were not included in this analysis. (b) Pearson’s correlation tests for the three main ancestral components (Iberian, Southeastern European, and Indian) derived from the NNLS analysis, plotted against longitude and latitude for the Roma
To further examine ancestry proportions, we estimated population-level averages from the NNLS results rather than using cluster averages. These findings revealed moderate differences, suggesting lower heterogeneity among Iberian populations compared to the clusters, and also among European populations. The primary distinction between Iberian Roma and other European Roma lies in the presence of Iberian and North African components, along with smaller South Asian and Southeastern European components (Supplementary Fig. 10a-b).
In summary, the Roma populations analysed exhibit genetic profiles with varying proportions of West Eurasia and South Asia ancestry, shaped by geographic factors. Pearson’s correlation tests on the NNLS ancestry components by macro-region revealed significant correlations between longitude and several ancestral components (Supplementary Table 2a-b; Supplementary Fig. 11). Specifically, there is an east-to-west and south-to-north decrease in Southeastern European and Northern Indian components among European Roma, reflecting greater gene flow with non-Roma groups outside the Balkans. Conversely, an east-to-west increase in Iberian and North African components was observed among Iberian Roma, indicating higher gene flow with non-Roma Iberians (Fig. 2b).
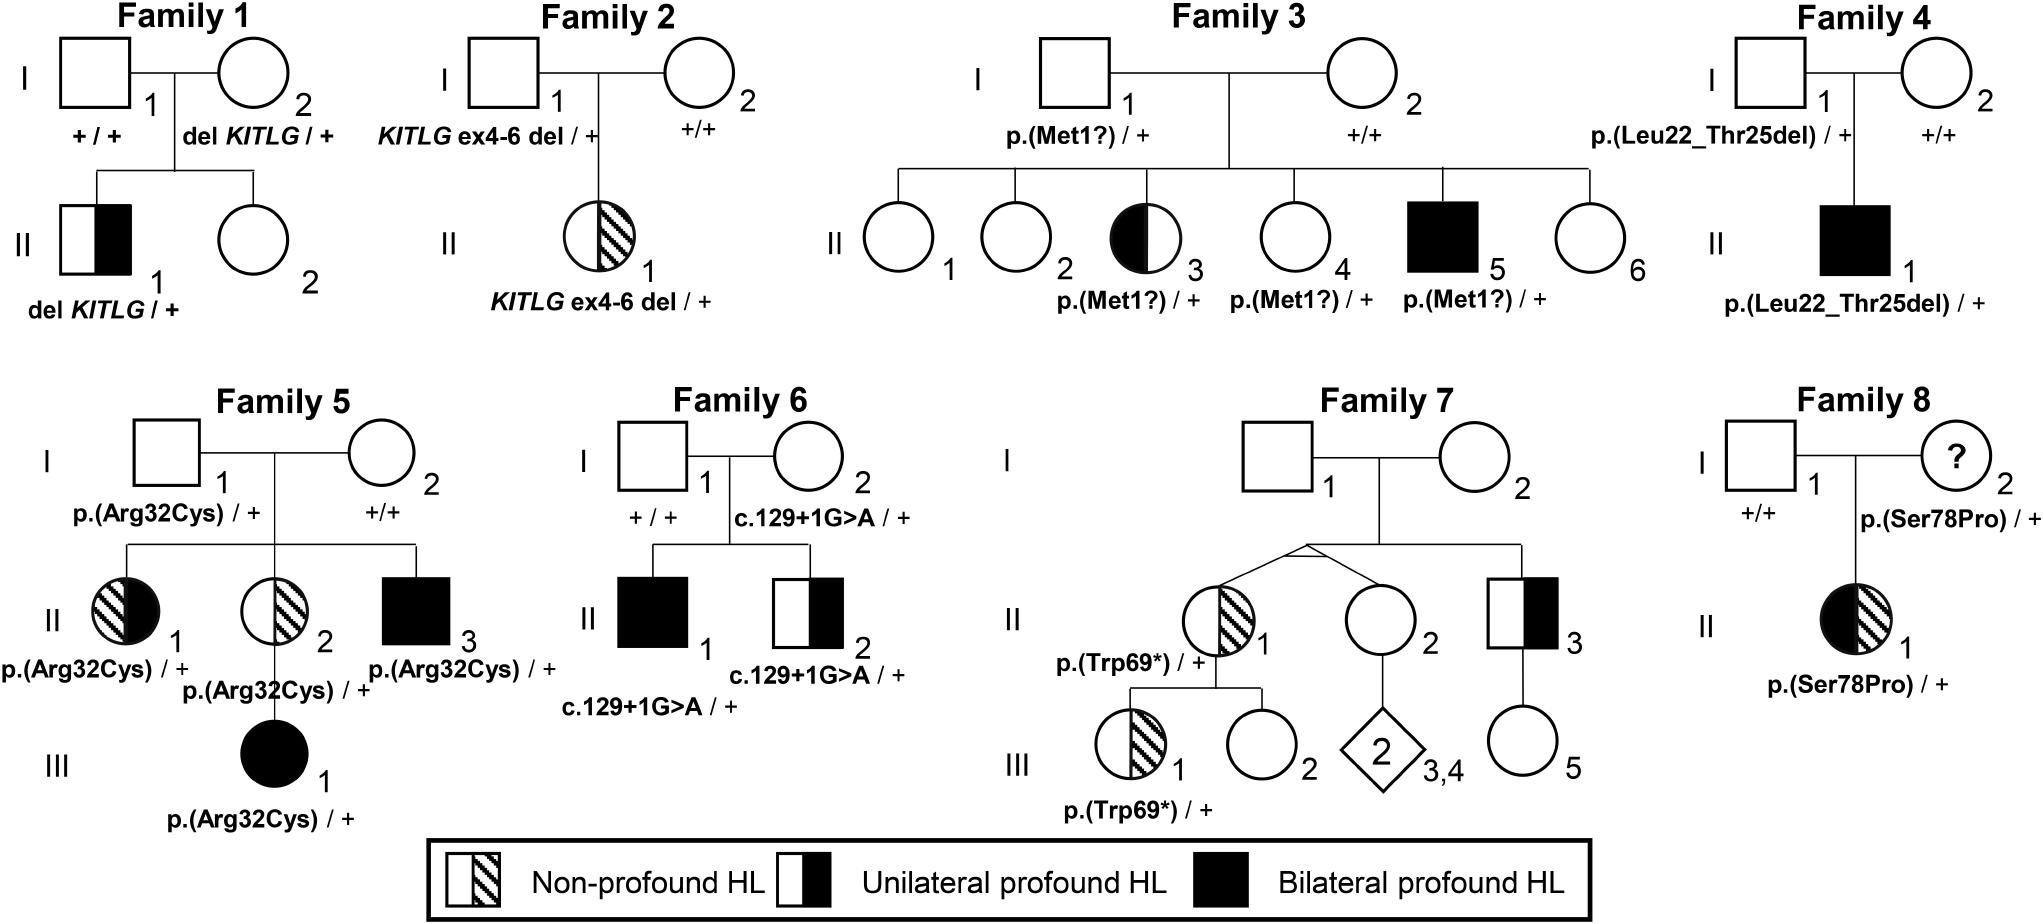
Multiple events of admixture in European Roma groupsTo estimate the timing of the major admixture events in the Roma populations, we used two methods based on an admixture pulse model. To explore admixture dynamics across various geographical scales, we conducted fastGLOBETROTTER analyses on the IberianRoma and EuropeanRoma clusters (Supplementary Tables 3 and Supplementary Fig. 12a-b), followed by analyses of the Iberian and European Roma subclusters (Supplementary Table 3a and Fig. 12c-d). The fastGLOBETROTTER analysis identified multiple waves of admixture (Fig. 3a), while MALDER detected only a single event for each significant test. For the EuropeanRoma cluster, two significant admixture events were identified (Fig. 3, Supplementary Table 3a-b). The first occurred approximately 30 ± 0.49 generations ago (GA) (1218 to 1243 CE, assuming 25 years per generation), involving two nearly equal ancestry sources: a major source with over 50% South Asian ancestry and a minor source predominantly consisting of Southeastern European, Caucasus, and Middle Eastern/West Eurasian ancestries. The second event, dated about 10.06 ± 1.06 GA (1722 to 1775 CE), had a major source contributing 73%, characterised by a blend of the earlier sources, evenly distributed among Southeastern European, Caucasus-Middle Eastern, and South-Asian groups. The minor source in this recent event was primarily European, with smaller contributions from West and South Asian ancestries. For the Iberian Roma cluster (Fig. 3, Supplementary Table 3a), two admixture events were also identified. The first occurred approximately 25 ± 0.21 GA (1363 to 1374 CE), with two sources: one comprising 64% European (mainly Iberian) and Caucasus-Middle East components, and the other an equal mix of South Asian and European/West Asian ancestries, including a small 2% North African component. The second event, dated to about 5 ± 0.29 GA (1864 to 1878 CE), had a major source showing a balanced contribution from European, Caucasus-Middle Eastern, and South Asian ancestries, while the minor source was predominantly West Eurasian, with a small South Asian component.
Fig. 3
Admixture events in Roma history. (a) Admixture events inferred by fastGLOBETROTTER, showing relative ancestry proportions grouped into macro-regions for each source of the two inferred admixture events. The plot displays recent admixture events at the bottom and older events at the top, separately for Iberian Roma (n = 93) and European Roma (n = 49). (b) Comparison of inferred admixture events between the fastGLOBETROTTER (representing older events) and MALDER dating methods. CE = Common Era
The key differences between the Iberian Roma and European Roma clusters were the presence of Iberian, North African, and Southern European components in the Iberian Roma, compared to a much larger Central and Southeastern European components in the European Roma. Additionally, the minor source in the recent admixture event of Iberian Roma included a JewsMix ancestry component, which comprises Jewish individuals from Poland, Turkey, and Morocco. This component, absent in European Roma, may indicate gene flow from North African or Jewish groups.
MALDER’s estimates, which identified single admixture events for each reference pair, also revealed several statistically significant results (Supplementary Table 4). For the EuropeanRoma, using Punjabi1 and Balkan clusters as references, the estimated date was 35.67 ± 2.18 (1001 to 1215 CE). For the IberianRoma, using Punjabi1 and IBS as references, the estimated date was 26.41 ± 1.78 GA (1253 to 1427 CE), while using Punjabi1 and Balkan clusters produced a date of 28.81 ± 2.22 GA (1171 to 1389 CE). These IberianRoma estimates overlap with those from fastGLOBETROTTER but have larger standard errors (Fig. 3b). To further trace the earliest Roma migrations and their dispersion routes from South Asia, we used MALDER to infer admixture dates between incoming Roma and local populations. Using Punjabi1 as a proxy for proto-Roma ancestry, we tested whether the Iberian Roma could have been formed through admixture events with various populations along the proposed dispersion path. As expected from a westward dispersal originating in South Asia, the earliest date (36.49 ± 2.22 GA) was obtained for an admixture event between the Punjabi1 and Iranian clusters (Supplementary Fig. 13). The dates inferred for other groups along the way were consistent with this hypothesis, showing more recent admixture dates along an east-to-west axis, with the latest date (25.23 ± 1.81 GA) corresponding to an admixture event between Punjabi1 and Basque clusters (Supplementary Fig. 13). Both methods used to infer admixture dates identified sources consistent with the NNLS analysis, primarily composed of South Asian, Southeastern European, and Middle Eastern sources, with the addition of an Iberian source specifically in the Iberian Roma.
Evolution of admixture dynamics over timeWe investigated how admixture dynamics with non-Roma European populations have varied over time among different Roma groups by analysing the distribution patterns of European local ancestry segment sizes and the shared IBD segments within Roma groups and between Roma and non-Roma Europeans. We categorised these European segments based on their length, using time approximations from previous studies (Baharian et al. 2016; Harris et al. 2018; Castro e Silva et al. 2022) to infer when the haplotypes were formed (see Supplementary Note 1 and Supplementary Note 2). On average, the length of non-Roma European ancestral segments was similar across different Roma groups, ranging from 15.7 to 22.3 Mb (Supplementary Fig. 14a). When analysing the number of non-Roma European segments by length category (Supplementary Fig. 14b), Iberian Roma, along with the Romungro from Hungary and Lithuanian Roma, exhibited an increased number of segments in the longer categories (representing more recent admixture events). In the shorter categories, there were fewer differences, or none, compared to other Roma groups. The average number of segments in most categories for Iberian Roma differed significantly compared to Czech Roma and the Romungro from Ukraine (Supplementary Table 5b). This suggests that the timing of admixture with non-Roma Europeans has varied across Roma groups, with a more recent increase observed in Iberian Roma over the last 200 years. This period corresponds to the end of the Roma slavery and the contemporary era (Greenberg 2010; Marushiakova and Popov 2010).
To further support the idea of changing levels of admixture over time, we analysed the distribution of shared IBD segments within Roma populations and between Roma and non-Roma populations. Iberian Roma consistently showed significantly lower levels of within-population shared IBD compared to other Roma groups (Supplementary Fig. 15, Supplementary Table 6a-b). Conversely, shared IBD between Roma and non-Roma groups did not significantly differ in most cases when comparing Iberian Roma to other Roma groups (Supplementary Table 7). This suggests that while Iberian Roma have experienced lower levels of endogamy, they have maintained similar levels of gene flow with local non-Roma populations compared to other Roma groups.
Roma in the Iberian Peninsula exhibit high internal genetic structureIn addition to exploring the continental-scale genetic structure of European Roma, we aimed to investigate the genetic structure of Roma at a regional level. To this end, we assessed the genetic structure of Iberian samples (both Roma and non-Roma) using PCA and ADMIXTURE analyses, classifying the samples based on their geographic locations within the Iberian Peninsula (see Material and Methods) (Fig. 4a). The PCA plot reveals a clear distinction between Roma and non-Roma individuals (Fig. 4b). While non-Roma form a cohesive and distinct cluster, the Roma are more scattered across the plot, indicating regional substructure, as evidenced by the non-overlapping averages of PC1 and PC2 estimated for each Roma geographical group (Supplementary Fig. 16). The ADMIXTURE plot at the lowest cross-validation error K = 2, further differentiates Roma and non-Roma groups: Iberian non-Roma (IBS) show a single ancestral component, whereas Iberian Roma exhibit two components at varying frequencies across individuals (Fig. 4c). In contrast, the IBS display uniformity in their ancestral components even at K = 4, while the Roma show four components that are unevenly distributed (Supplementary Fig. 17; cross-validation plot in Supplementary Fig. 18).
Fig. 4
Population stratification of the Iberian Peninsula. (a) Distribution and size of Iberian Roma populations included in this study. Iberian Indeterminate population is not represented on the map due to insufficient geographic information. (b) Principal Component Analysis (PCA) using the Iberian dataset. (c) ADMIXTURE results showing the lowest cross-validation error (K = 2)
To detect differences in ancestry profiles across Roma from different Iberian regions, we conducted an NNLS analysis, which showed that proportions are highly similar across all regions (Supplementary Fig. 19).
We formally tested the genetic structure of the Iberian samples through a series of AMOVA analyses (Supplementary Table 8). The analyses were conducted in four steps, including all individuals from the Iberian dataset except those classified as “Indeterminate”. When Iberian Roma and IBS were considered as a single group, significant genetic heterogeneity was detected between individuals (2.79%, p = 0.00001). When these two groups were analysed separately, 1.43% (p < 0.0001) of genetic heterogeneity was observed. To further explore internal heterogeneity within each group, we found that genetic heterogeneity within the Iberian Roma (1.07%, p = 0.0001) was more than ten times higher than that among Iberian non-Roma (0.08%, p = 0.0021). This finding was reinforced when Roma samples were grouped by region, showing significant heterogeneity (0.55%; p = 0.0001) between regions, while the regional heterogeneity in IBS is ten times lower (0.04%, p = 0.0019).
Finally, we estimated gene flow between Iberian Roma and IBS. A f4 test was conducted to determine whether Iberian Roma individuals from different geographical regions share more alleles with non-Roma from the same regions. The results indicate that Roma groups share nearly equal numbers of alleles with all non-Roma groups, except for the IBS from Western Iberia (Supplementary Fig. 20a). Eastern Iberian Roma and Indeterminate Roma groups tend to show slightly greater genetic similarity with IBS, while comparisons involving IBS and Western and Central Iberian Roma often fall outside the significant threshold (Supplementary Fig. 20a).
To investigate interactions with Jewish and North African populations following the arrival of the Roma in the Iberian Peninsula in the 15th century, f4 tests were conducted to analyse gene flow between these groups. The results indicate that Jews and North Africans share more alleles with the Iberian non-Roma than with the Iberian Roma, except for the Cochin Jews from India (Supplementary Fig. 20b-c). This may be due to the absence of direct gene flow between Roma and these populations, while the genetic proximity to Cochin Jews likely reflects the Indian origin of the Roma.
Mating patterns in the Roma population: endogamy and ancestry-assortative matingWe analysed shared segments of IBD to understand demographic history and mating patterns within the Roma population. Compared to other global populations (Supplementary Fig. 21), Roma exhibit a high degree of internal IBD sharing, both in terms of segment size and number (Supplementary Tables 9 and 10). This level of sharing surpasses that observed in traditionally endogamous populations, such as the Cochin Jews, Brahui, Balochi, and Mozabite (Reich et al. 2009; Henn et al. 2012; Waldman et al. 2016), as well as Jews from Libya and Tunisia (Campbell et al. 2012). Iberian Roma share more IBD segments with Basque, Punjabi, Greek, and Iberian (IBS) populations; while European Roma share the most with Greek, Punjabi, Hungarian, and Czech populations. In general, Roma groups share more IBD segments with Greek than Punjabi, although Iberian Roma show lower levels of sharing with both (Supplementary Tables 9 and 10).
The inferred historical effective population size (Ne) estimates for most Roma groups reveal a common pattern (Supplementary Fig. 22). Ne has remained low, gradually decreasing from around 50 to 8 generations ago (800–1800 CE), with the lowest Ne occurring between 7 and 29 generations ago (Supplementary Table 11). In contrast, reference populations such as Iberian, Czech, and Punjabi exhibit larger Ne values (Supplementary Fig. 22) and do not show a similar decline in Ne over time.
Genetic bottlenecks, like those experienced by the Roma, result in a higher number of shared ancestors over time and an increase in long runs of homozygosity (ROHs) (Ceballos et al. 2018). In populations where mating pairs share recent ancestors, such as the Roma, a higher number of long ROHs is expected, as they indicate recent endogamy. Conversely, many short ROHs can signal older bottlenecks followed by genetic admixture with different communities. Analysing the distribution of ROH lengths provides insight into the historical patterns of isolation and endogamy within the Roma population. To explore these patterns, we examined the length and number of ROH in our cohort (Supplementary Table 12) and found that Roma groups generally have more and longer ROHs compared to non-Roma reference populations (Supplementary Fig. 23). When analysing the average number of ROHs by length category, Roma groups exhibit fewer short ROHs but more medium-length ROHs compared to most populations (Supplementary Fig. 24a-b), with numbers comparable to South Asian groups such as Kalash and West Asian groups like the Bedouins in most categories (Supplementary Fig. 24a-d). These findings reinforce the notion that the Roma have higher levels of endogamy compared to non-Roma Europeans, primarily due to more recent isolation.
Lastly, to investigate the presence of ancestry-assortative mating within Roma populations, we applied the ANCESTOR method to the previously inferred local ancestry tracts, focusing on the proportions of European and South Asian ancestries. The results revealed that the inferred ancestries of mating pairs over the last generation showed significantly positive correlations in most Roma groups, deviating from the expectation under random mating (Supplementary Fig. 25a-b). This suggests that European and South Asian ancestry traits have influenced the mating patterns within the Roma population.
Comments (0)