
Remember me

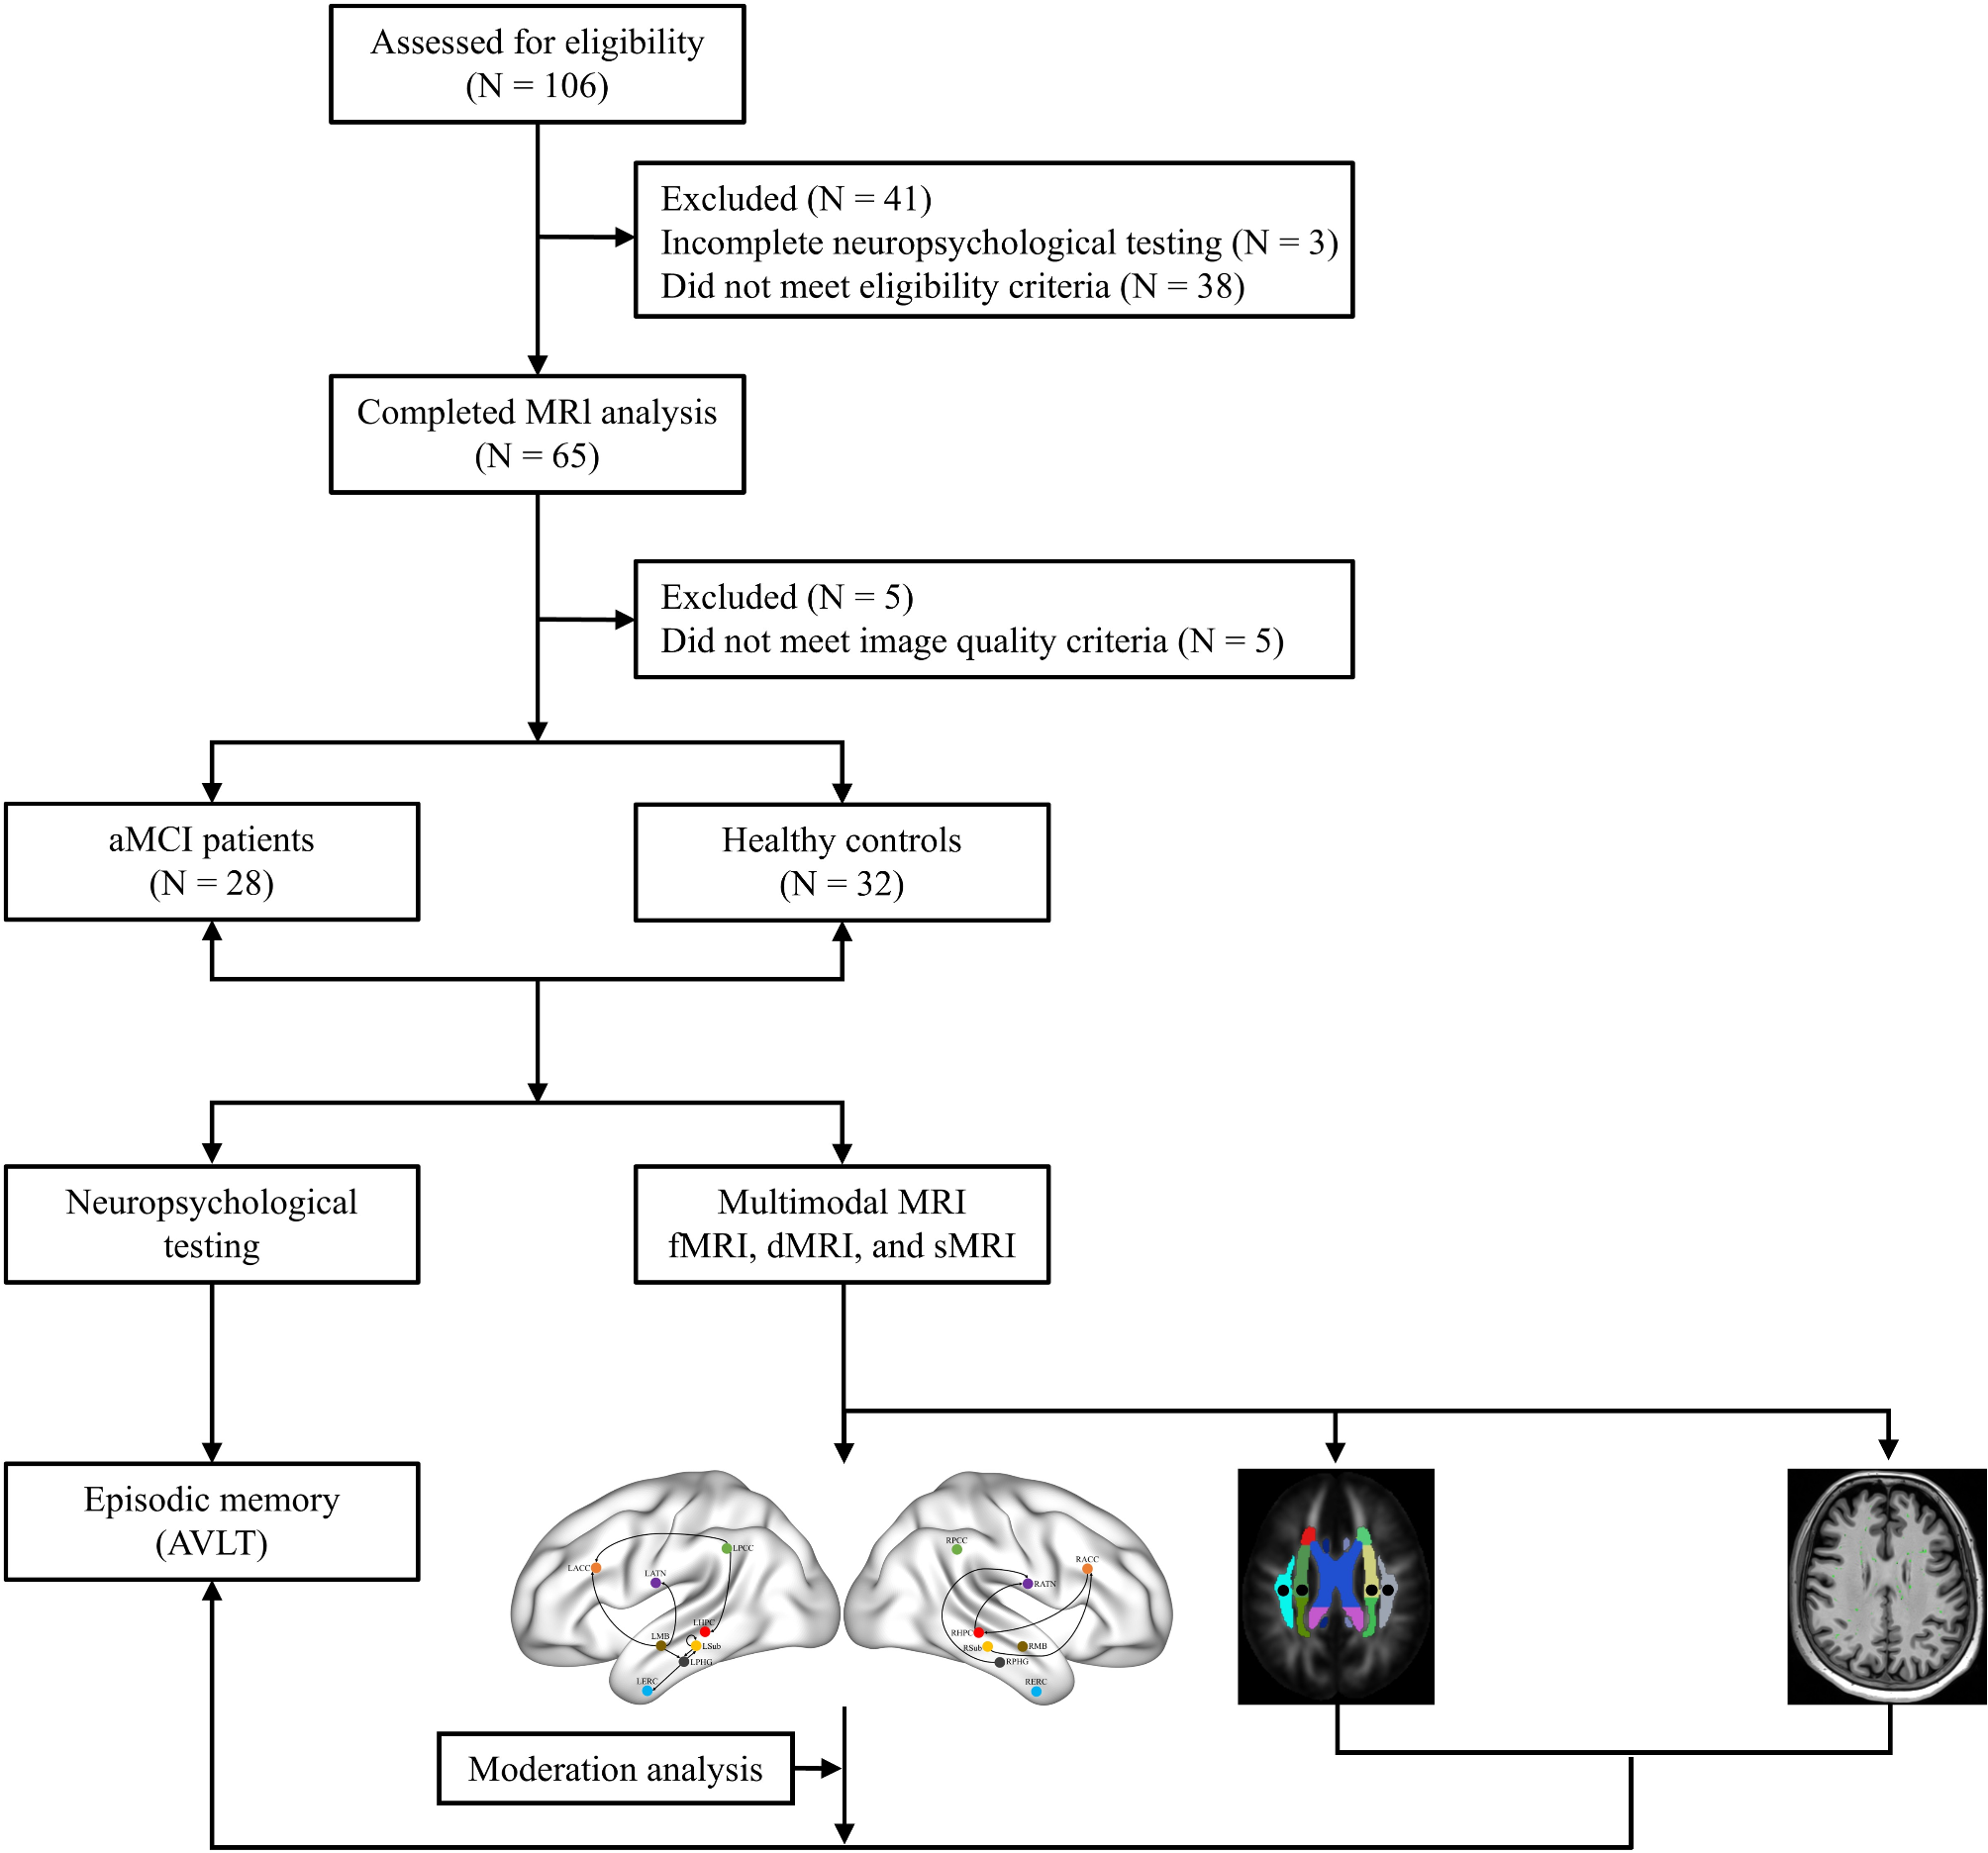


In this case‒control study, we initially enrolled 106 participants from the Memory Clinic of Shanghai Jiao Tong University Affiliated Sixth People’s Hospital and local communities in Shanghai from January 2020 to October 2023. Among them, 38 (35.85%) participants were excluded because they did not meet the eligibility criteria, 3 (2.83%) participants had incomplete neuropsychological testing, and 5 (4.72%) participants were excluded because they did not meet the image quality criteria. Finally, 28 (26.42%) aMCI patients and 32 (30.19%) healthy controls (HCs) matched for age, sex, and education were included. Approval for the study was obtained from the ethics committee of Shanghai Jiao Tong University Affiliated Sixth People’s Hospital (NO. 2019-041), in accordance with the Declaration of Helsinki, and all participants provided informed consent. The participant screening flowchart is presented in Fig. 1.
Fig. 1
Flow chart of the study. aMCI, amnestic mild cognitive impairment; HCs, healthy controls; MRI, magnetic resonance imaging; fMRI, functional magnetic resonance imaging; dMRI, diffusion magnetic resonance imaging; sMRI, structural magnetic resonance imaging; AVLT, Auditory Verbal Learning Test
The inclusion criteria for the aMCI group included the following: (1) met Jak/Bondi’s diagnostic criteria [25] (Supplemental Table S1); (2) had a Mini-Mental State Examination (MMSE) score greater than 24 points [26]; (3) were aged 55 to 80 years; (4) had objective memory impairment, with Auditory Verbal Learning Test Long-Term Delay Recall (AVLT-N5) and Recognition (AVLT-N7) scores falling below 1.0 standard deviation (SD) from the age-corrected normative mean [27]; (5) had complex Instrumental Activity of Daily Living (IADL) ability that might have been slightly impaired while still maintaining independent daily living [28]; (6) had a Clinical Dementia Rating (CDR) memory score of 0.5 [29] but did not meet the diagnostic criteria for dementia set by the National Institute on Aging-Alzheimer’s Association (NIA-AA) [30]; and (7) were right-handed.
The exclusion criteria for all participants included the following: (1) a history of mental illnesses, including delirium, mania, depression, or anxiety; (2) contraindications for magnetic resonance imaging (MRI) examination; (3) less than 6 years of education; (4) severe aphasia and audio‒visual impairment; (5) severe medical diseases, such as cardiopulmonary insufficiency, liver, or renal insufficiency; and (6) other diseases that cause cognitive impairment and white matter hyperintensity lesions, such as cerebrovascular disease, craniocerebral trauma, hydrocephalus, brain tumors, or intracranial infection.
Neuropsychological testingAll participants underwent neuropsychological testing administered by two senior neuropsychologists who were blinded to the participants’ clinical diagnoses. General cognitive function was assessed via the MMSE [26] and the Montreal Cognitive Assessment-Basic (MoCA-B) [31, 32]. Attention function was assessed via the Symbol Digit Modalities Test (SDMT) [33], and language function was assessed via the Boston Naming Test (BNT) [34]. Executive function was assessed via the Stroop test [35], and spatial function was assessed via the Judgment of Line Orientation (JLO) test [36]. Memory function was evaluated via the AVLT, and daily living activities were assessed via the Functional Activities Questionnaire (FAQ) [28].
MRI acquisitionA 3.0 Tesla Magnetom Prisma scanner (Siemens Healthcare, Erlangen, Germany), which employs a head coil for scans ranging from the cranial vertex to the level of the foramen magnum, was used for the MRI scans. The MRI protocols included functional MRI (fMRI), diffusion MRI (dMRI), and structural MRI (sMRI). The participants were required to be free of recent colds and inflammation, maintain a quiet state for 30 min before the scan, and wear earplugs. During the scan, they were asked to lie still and quiet in the scanner, close their eyes without falling asleep, and try to keep their heads as still as possible. The detailed MRI protocols are provided in Supplemental Table S2.
Data preprocessingThe standard pipeline of Statistical Parametric Mapping version 12 (SPM12, https://www.fil.ion.ucl.ac.uk/spm/software/spm12/) and the FMRIB Software Library (FSL, https://fsl.fmrib.ox.ac.uk/fsl, version 6.0.7) were used for fMRI data preprocessing. This data preprocessing pipeline included the exclusion of the first 10 volumes, slice timing correction, realignment, normalization, smoothing (6 mm full width at half maximum Gaussian kernel), detrending, ICA-based denoising (Automatic Removal of Motion Artifacts, AROMA) [37], regression covariates (Friston-24 head motion parameters and signals from white matter and cerebrospinal fluid) and filtering (0.01–0.08 Hz). Participants were excluded if they did not meet Satterthwaite’s stringent framewise displacement (FD) criteria (including FDJenkinson and FDPower) [38, 39]. For sMRI data preprocessing, FSL was used to remove nonbrain tissue. Additionally, the recon-all pipeline from FreeSurfer (https://surfer.nmr.mgh.harvard.edu/, version 7.4.1) was utilized to obtain the total intracranial volume (TIV), which was used as a covariate in subsequent statistical analyses. Similarly, the standard pipeline of MRtrix3 (https://www.mrtrix.org/) [40] was used for dMRI preprocessing. This standard pipeline included denoising, Gibbs ringing removal, motion correction, eddy-current correction, top-up correction of susceptibility distortions, and bias field correction. Meticulous data quality checks were performed during preprocessing and all subsequent processing steps to ensure the images’ integrity and precision.
Effective connectivity within the Papez circuitEffective connectivity analysis includes the following steps (Fig. 2A): (1) Extraction of the time series of all brain regions in the Papez circuit. The model was constructed by placing spheres (radius = 6 mm) in the following regions of interest (ROIs): the left and right anterior thalamic nuclei (ATN, MNI coordinates: ±4 − 1 0), the left and right entorhinal cortex (ERC, MNI coordinates: ±26 − 1 -33), the left and right mamillary body (MB, MNI coordinates: ±2–7 -14), and the left and right subiculum (Sub, MNI coordinates: ±27 − 18 -16) [41]. For the left and right ACC, HPC, PCC, and PHG, bilateral masks of these regions were constructed via the WFU PickAtlas toolbox (http://fmri.wfubmc.edu/software/PickAtlas) [41]; (2) For each participant, a fully connected model of the left and right Papez circuit was established, and spDCM was used for the parameter estimation of the fully connected model [42, 43]; (3) The group-level connectivity parameters were estimated via the parametric empirical Bayes (PEB) algorithm, and the effective connectivity parameters of the group model obtained via the Bayesian model averaging (BMA) algorithm were averaged to derive the group-level effective connectivity strength [42, 43].
Fig. 2
Pipelines for data processing. A Effective connectivity. ① Extraction of the time series of all brain regions in the Papez circuit. LACC, left anterior cingulate cortex; LATN, left anterior thalamic nuclei; LERC, left entorhinal cortex; LHPC, left hippocampus; LMB, left mamillary body; LPCC, left posterior cingulate cortex; LPHG, left parahippocampal gyrus; LSub, left subiculum; RACC, right anterior cingulate cortex; RATN, right anterior thalamic nuclei; RERC, right entorhinal cortex; RHPC, right hippocampus; RMB, right mamillary body; RPCC, right posterior cingulate cortex; RPHG, right parahippocampal gyrus; RSub, right subiculum. B ALPS. ① The dwi2tensor and tensor2metric are used to calculate the tensor metrics of fractional anisotropy (FA) and the diffusivity along the x-axis (right-left; Dxx), y-axis (anterior-posterior; Dyy), and z-axis (inferior-superior; Dzz); ② Register the FA image to the standard space (JHU-ICBM-FA template) and apply the deformation matrix to all diffusivity maps (Dxx, Dyy, Dzz); ③ Place 5 mm diameter spheres on the projection fibers (superior corona radiata (SCR)) and association fibers (superior longitudinal fasciculus (SLF)) at the level of the left and right lateral ventricles; and ④ Obtain the X, Y, and Z directional diffusivity of these fibers. ALPS, along the perivascular space; FA, fractional anisotropy; Dxx, diffusivity along the x-axis (right-left); Dyy, diffusivity along the y-axis (anterior-posterior); Dzz, diffusivity along the z-axis (inferior-superior); JHU-ICBM, Johns Hopkins University - International Consortium for Brain Mapping; WM, white matter. C PVS volume. ① T1-weighted images were preprocessed; ② The PVS volume was extracted for quantitative analysis. PVS, perivascular space
ALPS indexThe calculation of the ALPS index involves the following steps (Fig. 2B): (1) dwi2tensor and tensor2metric are used to calculate the tensor metrics of fractional anisotropy (FA) and the diffusivity along the x-axis (right-left; Dxx), y-axis (anterior-posterior; Dyy), and z-axis (inferior-superior; Dzz); (2) Register the FA image to the standard space (JHU-ICBM-FA template) and apply the deformation matrix to all diffusivity maps (Dxx, Dyy, Dzz); (3) Place 5 mm diameter spheres on the projection fibers (superior corona radiata (SCR)) and association fibers (superior longitudinal fasciculus (SLF)) at the level of the left and right lateral ventricles to obtain the X, Y, and Z directional diffusivity of these fibers. According to the JHU-ICBM-DTI-81 white matter labeled atlas, the center coordinates of the ROIs are as follows: left SCR (116, 110, 99), left SLF (128, 110, 99), right SCR (64, 110, 99), and right SLF (51, 110, 99) [44]; (4) The formula for calculating the ALPS index is \(\:\text\text\text\text\:\text\text\text\text\text=\frac\left(\text\text}_\text\text\text},\text\text}_\text\text\text\text}\right)}\left(\text\text}_\text\text\text},\text\text}_\text\text\text\text}\right)}\) [44], where \(\:\text\text}_\text\text\text}\) is the water molecule diffusivity along the x-axis in the projection fiber region; \(\:\text\text}_\text\text\text\text}\) is the water molecule diffusivity along the x-axis in the association fiber region; \(\:\text\text}_\text\text\text}\) is the water molecule diffusivity along the y-axis in the projection fiber region; and \(\:\text\text}_\text\text\text\text}\) is the water molecule diffusivity along the z-axis in the association fiber region.
PVS volumePVS volume analysis includes the following steps (Fig. 2C): (1) T1-weighted images were preprocessed via Advanced Normalization Tools (ANTs, http://stnava.github.io/ANTs/, version 2.5.0), which included motion correction, denoising, and nonuniform intensity normalization [45]. Segmentation masks for the basal ganglia (BG) and white matter (WM) were generated via cortical segmentation and reconstructed images from FreeSurfer (https://surfer.nmr.mgh.harvard.edu/, version 7.4.1) and FSL. (2) Vessel enhancement was achieved by applying Nonlocal Means (NLM) filtering followed by Frangi vesselness filtering to the T1-weighted images via the Quantitative Imaging Toolkit (QIT, https://cabeen.io/qitwiki) [46]. The filtered images were then standardized to normalize vesselness intensities, and a vessel mask was created by applying a threshold to the normalized vesselness map. (3) The PVS volume was extracted from the vessel mask for quantitative analysis. Additionally, the segmentation results were independently reviewed by two senior neuropsychologists, who evaluated the accuracy of the segmentation by assessing the position, shape, and size of the PVS to ensure consistency with the expected anatomical structures.
Statistical analysisStatistical analyses of the clinical characteristics were conducted via SPSS version 27.0 software (IBM Corp., Armonk, NY, USA). Intergroup comparisons for continuous variables were performed via a two-sample t test, whereas categorical variables were compared via the χ² test. A two-tailed P < 0.05 was considered statistically significant. The effective connectivity within the Papez circuit, ALPS index, and PVS volume were subjected to group comparisons via a general linear model, with age, sex and education included as covariates. TIV was included as an additional covariate in the analysis of PVS volume, with the aim of adjusting for inter-individual differences in brain size [47]. For effective connectivity in each hemisphere, the false discovery rate (FDR) was applied to control for multiple comparison errors.
The differential effective connectivity within the Papez circuit, ALPS index, and PVS volume were subjected to linear regression analysis to explore their relationships with neuropsychological test scores, with age, sex, and education as covariates. A two-tailed P < 0.05 was considered statistically significant, and FDR correction was applied for multiple comparisons. The variance inflation factor (VIF) measures the severity of multicollinearity, where a VIF value exceeding 5 generally indicates the presence of multicollinearity [48].
The moderation effects of PVS function on the relationship between differential effective connectivity within the Papez circuit and episodic memory were analyzed via linear regression and Hayes’ bootstrap method. Episodic memory impairment, particularly long-delayed recall, was a core symptom of aMCI [49]; therefore, we conducted an exploratory moderation analysis using the AVLT-N5 scores. Furthermore, Hayes’ bootstrap method was utilized to generate 5,000 random samples for testing and to calculate the 95% confidence intervals (CI). Moderation analysis was performed via SPSS version 27.0 software (IBM Corp., Armonk, NY, USA), and the significance of the moderation effects was assessed by determining whether the 95% CI excluded zero.
Comments (0)